
A Multi Patch Warping Approach for Improved Stereo Block
Matching
Mircea Paul Muresan, Sergiu Nedevschi and Radu Danescu
Dept. Computer Science Department, Technical University of Cluj-Napoca, Cluj-Napoca, Romania
{mircea.muresan, sergiu.nedevschi, radu.danescu}@cs.utcluj.ro
Keywords: Dense Stereo, Block Matching, Slanted Surfaces, Disparity Refinement, Binary Descriptors.
Abstract: Stereo cameras are a suitable solution for reconstructing the 3D information of the observed scenes, and,
because of their low price and ease to set up and operate, they can be used in a wide area of applications,
ranging from autonomous driving to advanced driver assistance systems or robotics. Due to the high quality
of the results, energy based reconstruction methods like semi global matching have gained a lot of popularity
in recent years. The disadvantages of semi global matching are the large memory footprint and the high
computational complexity. In contrast, window based matching methods have a lower complexity, and are
leaner with respect to the memory consumption. The downside of block matching methods is that they are
more error prone, especially on surfaces which are not parallel to the image plane. In this paper we present a
novel block matching scheme that improves the quality of local stereo correspondence algorithms. The first
contribution of the paper consists in an original method for reliably reconstructing the environment on slanted
surfaces. The second contribution consists in the creation of set of local constraints that filter out possible
outlier disparity values. The third and final contribution consists in the creation of a refinement technique
which improves the resulted disparity map. The proposed stereo correspondence approach has been validated
on the KITTI stereo dataset.
1 INTRODUCTION
Stereo correspondence is one of the most researched
topics in computer vision. Using a pair of cameras
for estimating depth information remains a popular
choice mainly because of the low cost of the sensor,
and the high quality and density of the output,
comparable to the laser scanner technology (Penner
et al., 2015), (Antunes et al., 2012). The principle of
3D reconstruction from stereo image pairs is the
triangulation, which means finding the 3D point
where the rays passing through the pixels
corresponding to the same object in the two images
intersect. In practice, the images are rectified in such
a way that the corresponding points are on the same
line, and the only difference between position of an
object in the left and right image is in the column
coordinate. This difference (or offset) is called
disparity (d) and it is inversely proportional to the
object depth (Z), as described by equation 1. The term
B refers to the baseline of the stereo system and f
represents the focal length, in pixels, of the rectified
images.
Bf
d
Z
(1)
Due to an increasing number of applications
ranging from Advanced Driving Assistance Systems
(ADAS), Autonomous Driving or Biometry (Huang
et al., 2002), (Yasir Mohd Mustafah, December 2012
), (Einecke and Eggert, 2014) requiring accurate 3D
information, a wide variety of stereovision methods
have been developed. Current state-of-the-art
approaches may be classified in two main categories:
global and local stereo correspondence algorithms
(also called block matching algorithms). The global
stereo correspondence algorithms usually try to
minimize an energy function. These algorithms can
be based on belief-propagation (Yang et al., 2009),
dynamic programming (Hirschmuller, 2005), or
graph-cut techniques (Kolmogorov and Zabih, 2002).
The drawback of these methods consists in the large
memory consumption and high running time. The
semi-global matching (SGM) algorithm
(Hirschmuller, 2005) is a subclass of the global
optimization methods and, compared to the global
approaches, it has a simpler energy function to
Muresan M., Nedevschi S. and Danescu R.
A Multi Patch Warping Approach for Improved Stereo Block Matching.
DOI: 10.5220/0006134104590466
In Proceedings of the 12th International Joint Conference on Computer Vision, Imaging and Computer Graphics Theory and Applications (VISIGRAPP 2017), pages 459-466
ISBN: 978-989-758-227-1
Copyright
c
2017 by SCITEPRESS – Science and Technology Publications, Lda. All rights reserved
459

minimize, thus requiring less computational
complexity and producing good quality results. For
this reason SGM has attracted a lot of attention in the
automotive field over the years. Using modern GPUs,
SGM can be parallelized to run in real time (Haller
and Nedevschi, 2010); however, optimizations using
this hardware acceleration method are very power
demanding and the memory footprint remains very
high. In block matching algorithms (BM) the pixels
from one image are compared with the ones from the
second image and there is no energy minimization
constraint. Since single pixel matching can be
erroneous, the correspondence is done using
rectangular windows called blocks. Mainly due to
their simple computational scheme, block matching
algorithms run in less time without the need of
hardware acceleration, and require less memory. The
drawback of these algorithms is that they produce
lower quality disparity maps.
One of the reasons for which block matching fails
to reconstruct certain surfaces is that it generally
assumes the same disparity across the matching
window, and consequently it considers that the scene
consists of frontally viewed planes which are
perpendicular to the camera’s optical axis. This
assumption does not hold for the scenes observed by
ground vehicles or robots, since the surfaces and the
objects on the road can have many degrees of
orientation. A lot of research has been done in order
to tackle the shortcomings of block matching that
affect the quality of disparity maps, while
maintaining the low memory footprint and high
running speed of these algorithms. Our method
improves the quality of the stereo reconstruction on
tilted surfaces by using several oriented matching
blocks and constraining the winner disparity by
means of two flags. We also introduce a refinement
strategy that filters small errors. The remainder of the
paper is structured as follows: in the next section we
present the state of the art advancements for stereo
correspondence block matching algorithms, in
section three we illustrate the paper’s main
contributions, the fourth section contains
experimental results and implementation details, and
finally we end with the conclusions and further work
section.
2 RELATED WORK
Local stereo correspondence algorithms work by
creating finite support regions (usually called blocks)
around each interest point, and finding the
correspondence between these blocks in the left and
right images, by searching on the epipolar lines.
These methods are based on a matching metric
(Scharstein and Szeliski, 2002) and usually apply
different forms of aggregation for smoothing. The
common matching metrics are the sum of absolute
differences (SAD), the sum of squared differences
(SSD), the rank transform (RT), the census transform
(CT), or the normalized cross correlation (NCC). Due
to their low complexity requirements, block matching
methods are viable solutions for embedded
applications. A hardware solution implemented by
the TYZX Company is presented in (Woodfill et al.,
2006). This method uses an ASIC and a FPGA device
in order to compute in real time the BM stereo
correspondence using the census transform.
Modern approaches that tackle the problem of
surface orientation are presented in (Muresan et al.,
2015), (Ranft et al., 2014), (Einecke and Eggert,
2013) and (Einecke and Eggert, 2014). In (Muresan
et al., 2015) the authors create a new matching score
by shifting each individual row of the matching
descriptor in order to get the best matching score
between two features. A penalty is incorporated in the
matching score in case the best score does not come
from a fronto-parallel surface. In (Ranft et al., 2014)
the authors perform multiple operations of sheering
and scaling to the original images and compute
multiple block matching on the obtained images in
order to capture different surface orientations. The
final disparity map is obtained after fusing the
individual block matching results. In (Einecke and
Eggert, 2013) the authors perform a linear image
warping in order to capture the expected disparity for
the ground plane and in (Einecke and Eggert, 2014)
the authors perform an oriented block matching
aggregation. The authors use different penalties in
case the best matching score does not come from a
frontally viewed plane. The penalties are not
encapsulated in the final matching value. The method
presented in (Einecke and Eggert, 2015) uses
matching blocks of different shapes and sizes in order
to eliminate the effect caused by non-frontal surfaces.
This method of aggregation manages to diminish the
bloating effect caused by the usage of large
aggregation blocks and also reduce the noise caused
by small matching blocks.
3 PROPOSED SOLUTION
One of the reasons block matching stereo fails to
reconstruct certain surfaces is because of the inherent
assumption that the 3D depth of all the features within
a matching block is the same. In this section, we
VISAPP 2017 - International Conference on Computer Vision Theory and Applications
460

present an improvement of BM stereo in the presence
of slanted surfaces. Our method (Slanted Block
Matching - SBM) captures the orientation of surfaces
by warping the matching descriptor block. This
operation is performed very fast using a set of lookup
tables. After the matching operation has been
performed the obtained values are aggregated using
blocks of different shapes and sizes, which will help
reduce the errors introduced by the single pixel
matching.
Mainly due to the fact that when we are
computing the matching descriptors we are not
considering how surfaces may be oriented, we can
introduce matching errors. These errors are
aggregated in the following stages of the stereo
pipeline and lead, in the end, to a deteriorated
disparity map. In order to further reduce possible
outliers, we restrict each generated disparity value by
using a set of local constraints. The final map is
refined by removing all the small speckles resulted
from erroneous matching.
3.1 Matching Descriptors
In our work we have used binary descriptors. Our
motivation for choosing such features is that they are
usually easier to compute, they are invariant to
additive and multiplicative offsets in image intensity
values, and the time needed to compute these
descriptors is relatively small. For this reason, in our
work we have chosen a 7x9 weighted center
symmetric census approach. The center symmetric
census, expressed by equation (2), has a higher
robustness against noise than the classical census
transform, which is based on comparisons which all
involve the central pixel of the mask, due to the fact
that a noisy pixel will have only a local effect, and
will not compromise the whole metric. Furthermore,
after each comparison, instead of recording just one
bit, which is the result of the comparison, we are
memorizing two bits. By using two bits we are able
to better weight the certainty of the comparison. In
case the compared pixel is much smaller or much
larger than the value with which we are comparing,
we are storing the value of the comparison two times
whereas if the compared value is situated in an
interval with respect to the value with which we are
comparing we are storing the value of 01. This has the
advantage that if in the other image the comparison
result will be certain the effect of the Hamming
distance on the two images would not have an effect
as damaging to the final result as the classical
approaches. The analytical expression of the modified
center symmetric census (MCST_CENSUS) can be
seen in equation (3).
1
/2 /2 1
1
2
_(,) (, )
(,)( , )
0
0
/2
(, )
(,)(, )
0
Ni M j
NNMj
ij
j
N
M
MCST CENSUS u v I I
uv u v
i
j
M
II
uv uv
j
(2)
00,
,01,
11,
XtY
XY X t YANDX t Y
XtY
(3)
In equation (2), N and M denote the size of the
descriptor patch, and the
sign denotes the bitwise
concatenation operation. In equation (3), t represents
a small intensity threshold, with which we usually
compensate small variations in intensity. In our
solution the value of t has been set to 1.
In order to capture the geometry of slanted
surfaces, seven lookup tables have been created for
the right descriptor image, representing several
degrees of tilting for the descriptor block. Since the
derivative of the position (offset), for each pixel is
kept in the lookup table, computing all seven right
descriptor images is done concurrently, which is very
fast. An intuitive depiction of the slanted descriptor
windows is illustrated in figure 1.
Figure 1: Tilted Modified Center Symmetric Census
descriptor blocks.
The seven lookup tables were created on an
experimental basis. Initially we created multiple
tables with various degrees of inclination and we
gradually eliminated the lookup tables that did not
seem to offer any kind of improvement to the final
result, taking as reference the KITTI 2012 dataset.
Figure 2: Intuitive illustration of a 3x3 lookup table for
frontal (left) and slanted (right) situations.
A Multi Patch Warping Approach for Improved Stereo Block Matching
461

An intuitive example of a lookup table for a 3x3
patch is presented in figure 2. Each position records
the offset with respect to the center pixel, the first
element represents the offset with respect to the row
while the second records the offset with respect to the
column. In our case, seven 7x9 lookup tables were
created, using the modified weighted center
symmetric census descriptor. Six of the seven tables
correspond to the slanted surface scenario, and one
corresponds to the frontal surface scenario.
3.2 Shifted Window Hamming
Distance Computation
When using binary descriptors, the matching cost for
a specific position is usually computed using the
Hamming distance. Classically, given a pixel in the
left image, a search for a pixel with similar
appearance is carried out in the right image, on the
corresponding epipolar line over a number of
candidate positions (also called disparities). The
winning disparity represents the position where we
find the minimum Hamming distance.
Instead of searching for the minimum Hamming
distance between a feature in the left image and one
in the right image over multiple disparities, our
system searches for the best matching feature for the
left pixel in all seven right descriptor images over
multiple disparities. The best matching score will be
determined by the minimum Hamming distance value
between the score obtained for the fronto-parallel
case and the slanted blocks cases, to which we add a
small penalty. The value of the penalty that yields the
best results with respect to the stereo benchmark is 2,
and was determined experimentally. Analytical
representations of the mentioned operations are
depicted in equations (4), (5) and (6).
6
SI(i, j,d)= Min(Hamming(IL(i, j) , SRI ( , , )))
k=1
K
ijd
(4)
Frontal(i, j, d) = Hamming(IL(i, j), FPRI(i, j, d))
(5)
FS(i,j,d)=Min(Frontal(i,j,d),PS(i,j,d)+Penalty)
(6)
In the above equations we denote by SI the slanted
image pixel score, which represents the minimum
score obtained for all six slanted right images (SRI).
By Frontal we represent the score obtained for the
fronto-parallel case for a pixel at position i, j having
a disparity d. FPRI represents the fronto-parallel right
image. The final result of our algorithm for a pixel at
position i, j having the disparity d is denoted by
FS(i,j,d) and it is obtained by taking the minimal
value between the frontal score and the score for
slanted images at which we add a small penalty. We
are adding the small penalty because, similarly to the
work presented in (Hirschmuller, 2005), we are
trying to favour frontal surfaces. The final value FS is
stored in a cost volume C (p,d) where p represents the
pixel position and d is the corresponding disparity (7).
(,) (,)Cpd FSpd
(7)
After computing the Hamming distance, a multi
block aggregation is performed on the cost volume in
order to filter out possible outliers and reduce the
bloating effect of the resulted disparity map. The
aggregation scheme is similar to the one presented in
(Einecke and Eggert, 2015), improved by adapting
the matching blocks experimentally. The block sizes
used have the sizes: 1x155, 155x1, 17x17 and 7x7.
By A we are denoting the aggregated value and the
aggregation scheme is presented in (8).
max ,
1 155 155 1
17 17 7 7
A val val val val
xx
x
x
(8)
By ݒ݈ܽ
ௌ௭
we denote the value obtained by
summing the individual values within a block for one
of the specified sizes.
3.3 Winner Takes All
In the winner takes all stage of the stereo
correspondence pipeline, the index of minimum value
is chosen from the computed cost volume C, for a
certain pixel position p, as expressed by equation (9).
(,)
D
pargmin Cpd
d
(9)
The disparity map obtained through stereo
correspondence can also be deteriorated by several
external factors, such as reflectance, lack of texture,
repetitive patterns etc. For this reason we impose
several constraints on the created cost volume in the
winner takes all stage, such that erroneous results can
be filtered out or at least reduced. In order to
successfully select a disparity value, all imposed
constraints have to be satisfied.
To carry out this task the first step is to find for
each position the first three minimal values.
The first constraint used refers to the identification
of un-textured surfaces from the cost volume. For this
scenario we verify if the three best detected local
minima values are equal. Intuitively, we have
illustrated this phenomenon in figure 3 and equation
10.
1, 1 2 1 3
0,
min min AND min min
Periodicity
otherwise
(10)
VISAPP 2017 - International Conference on Computer Vision Theory and Applications
462

Figure 3: Graphical representation of the periodicity
phenomenon. With blue we highlight the position of three
possible minima values.
The second constraint is offering us a measure of
trust regarding the generated disparity value. This
confidence constraint is computed by using the
smallest three values in the cost volume for a pixel
position p, and finding if the ratio between the third
smallest value and the smallest value is less than a
confidence threshold. The analytical expression
depicting the usage of the confidence constraint is
illustrated in equation 11. The confidence threshold
has been set experimentally to 15.
3
1 ,
1
0,
min
ConfidenceThreshold
min
Con
othe
fidenceF
rwise
lag
(11)
In order to improve the precision of the detection,
sub- pixel interpolation is applied. For this step we
have used the symmetric V method, presented in
(Haller and Nedevschi, 2012). The sub pixel
interpolation is computed as:
int
2
31 31
23
2
21 21
2
21 21
23
2
31 31
(M M ) M M
0.5 0.25 ,
()
(M M ) M M
0.5 0.25 ,
()
final eger
Disp Disp
if M M
MM MM
if M M
MM MM
(12)
The values M
1
, M
2
, M
3
correspond to the winning
disparity and its neighbouring values. In order to
reduce small matching errors, a refinement stage is
applied to the disparity map.
3.4 Winner Takes All
By using refinement steps we hope to eliminate
remaining outliers, and obtain a better disparity map.
The first step consist of a background fill in stage,
which is performed in case of occlusions (Zbontar
and LeCun, 2015) and left-right (LR) check. The
analytical expressions for determining the condition
under which a certain disparity falls in (correct,
mismatch and occlusions) are described in equation
(13). Depending on this condition we know if
refinement is necessary or what refinement steps we
should apply. For example if the result of the
condition is mismatch we should apply a background
fill in, and in case of occlusion we should discard the
disparity value leaving an unreconstructed space.
1
,
,
,
1
RL
dD pd fordD p
R
Condition missmatch if d D pd for any other d
correct if
occlusion otherwise
(13)
In order to eliminate the remaining speckles caused
by incorrect matches, a new speckle removal
technique is presented. Classical speckle removal
techniques, based on region growing, tend to remove
speckles smaller than a predefined size, but do
nothing if the size of the speckle exceeds the imposed
limit. In our approach, even if the speckle has a larger
size, an erosion step is applied, reducing the size of
the error.
The first step of the refinement stage consists in
segmentation. For segmentation, two disparity
threshold values are used, a strong threshold value
(T2) and a weak threshold value (T1). Using the
strong and weak thresholds two segmentation limits
are created (an upper threshold limit and a lower
threshold limit). The disparity values that fall
between these limits are considered in the
segmentation region. Considering that v is the current
disparity value the upper and lower limits are
computed as shown by equation (14).
1
2
lower v T
upper v T
(14)
By using the two thresholds, we ensure that the
segmentation is robust even at object boundaries. The
threshold T1 has a smaller value than T2. After this
procedure a closing morphological operation with a
kernel of 11x11 is performed on the segmented
region. In case the detected region is a small speckle,
it will get filtered out by the erosion in the closing
operation. The final result is appended in the filtered
disparity map. A fill operation is carried out in order
to eliminate the holes caused by the closing operation.
For every pixel we are searching on all eight
directions until we find the closest two disparity
values with minimum difference. The search is
carried out over a number of k positions.
The final step in our refinement scheme consists in
a 1x9 and 9x1 median filter that removes any
remaining noise. The values for the weak and strong
thresholds for our application are 3 and 1 and the
A Multi Patch Warping Approach for Improved Stereo Block Matching
463
searching distance for the fill stage is 49 pixels. No
background interpolation step has been implemented
in our solution, therefore the final map density will be
less than 100%.
4 EXPERIMENTAL RESULTS
For evaluating our block matching approach we used
the online KITTI benchmark (Geiger et al., 2013).
This stereo dataset comprises road scenes and traffic
scenarios. We tested our results against classical
methods using multiple stereo cost functions, such as
census 7x9, modified census transform, sparse
census, and weighted center symmetric census. We
have also displayed the ranking of our method with
respect to the state of the art methods on the KITTI
site. In all the methods displayed in table I, a multi
block aggregation was used, along with the proposed
refinement functions. The differences in quality are
caused by the LUT based warping method of
computing the descriptor. The density percentage
comparison against the classical methods is computed
using the training set with the publicly available
ground truth. Table I illustrates the comparison with
classical rectangular descriptor based solutions.
The system on which we implemented our method
contains an Intel I5-2500 CPU with 3 GHz frequency.
No hardware acceleration methods have been used.
Open MP has been used to parallelize some small
parts of the code. The error threshold used in our
evaluation is 2px.
Table 1: Evaluation with respect to the classical cost
functions using KITTI Data-Set.
Method Density Out-All error
Census 99.67 % 11.865 %
WCS-CENSUS 99.98 % 11.24 %
MCT
99.68 %
11.21 %
SBM 99.97 % 8.785 %
Sparse Census 99.51 % 13.29 %
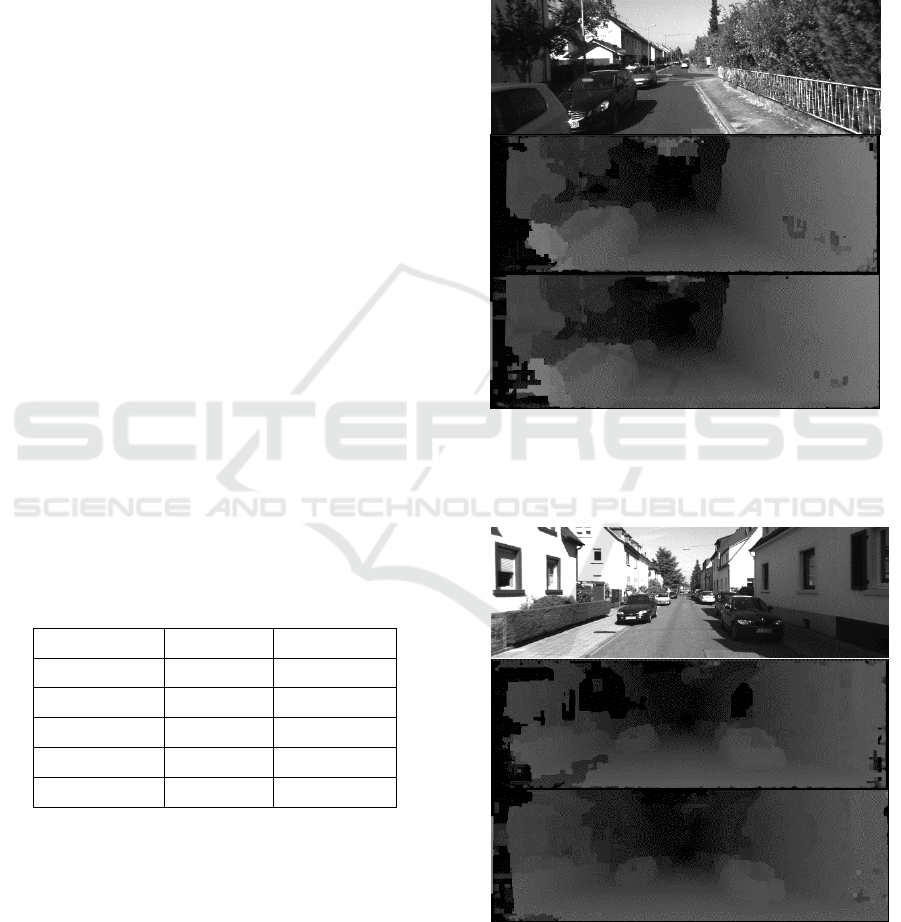
Figure 5 illustrates the results of the matching in
comparison with the 7x9 Census approach. The top
image represents the intensity image from the KITTI
dataset, the second image represents the result of the
census approach and the bottom image depicts the
result of our algorithm. It can be seen that our method
is able to better reconstruct the slanted surface in the
right side of the image. In figure 6 we illustrate yet
another situation in which our proposed solution
outperforms the classical approach. The top image
represents the left intensity image, the second image
represents the result of the sparse census method and
the last image is the image obtained with our
algorithm. In the sparse census method every second
pixel is skipped therefore resulting a sparse descriptor
pattern, not dense like in the case of 7x9 census. The
same aggregation scheme is employed in all tested
images.
Figure 4: The top image is the left intensity image, second
image depicts the disparity map using the census approach,
while the last image is the image obtained with our
algorithm.
Figure 5: The bottom image is the result of SBM, the second
image depicts the disparity map using a sparse census
descriptor and the first image represents the left intensity
image.
VISAPP 2017 - International Conference on Computer Vision Theory and Applications
464
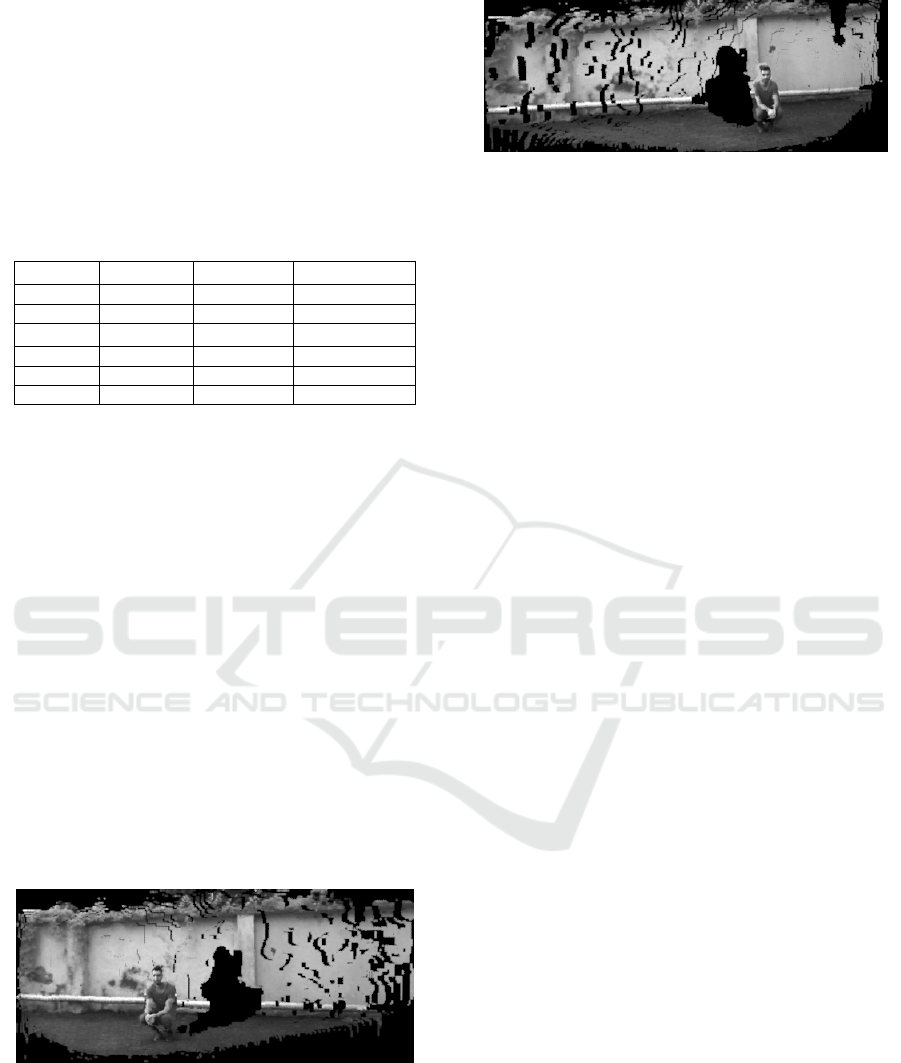
Table 2 shows a snapshot of the comparison with
other methods present in the KITTI dataset from
2016. This overview shows that our local stereo
correspondence method achieves good results, even
surpassing some semi global approaches. The error
metric shown is out all, the percentage of erroneous
pixels out of all the pixels in the image, including the
occluded ones.
Table 2: Comparison with existing methods from the KITTI
benchmark.
Position Method Density Out-All error
32 wSGM 97.03 % 8.72 %
33 AARBM 85.80 % 8.70 %
34 DispNetC
100 %
8.11 %
35 SBM 99.97 % 8.75 %
36 AABM 100 % 8.77 %
37 rSGM 97.22 % 9.24 %
The running time of our algorithm is 0.3s per frame
on the KITTI data set images sizes. The method runs
faster when we are reducing the image sizes. The
proposed implementation can be accelerated in order
to achieve a higher running time. The improvement
of the time was not in the scope of the paper, as the
current work was focused so far only on improving
the quality of the stereo matching results.
The justification of the low memory consumption
is that the algorithm does not need the entire disparity
space to make optimizations in the cost volume; also,
we do not need to remember any past result when
generating the current disparity result. The only
additional memory necessary in comparison to the
classical BM methods is the one required for
memorizing the seven (1 frontal and six slanted)
weighted center symmetric census descriptor images
for the right intensity image. There is a linear
dependency between the amount of the memory used
depends and the size of the input images.
Figure 6: Rotation to the right of the 3D projected points in
PCL.
Figure 7: Rotation to the left of the 3D points.
Another good way of evaluating the quality of a
stereo algorithm would be to visually evaluate the 3D
points form the disparity map. In case there are errors
we would see spikes coming out of the image, or large
unreconstructed regions. We acquired a synchronized
pair of images from a set of Manta cameras. We
rectified them, applied our algorithm and projected
the 3D points using point cloud library. The result of
our algorithm can be seen in figure 6 and figure 7. We
have rotated the scene and took two snapshots in
order to illustrate how the scene can be viewed from
two vintage points.
5 CONCLUSIONS
In this paper we have presented a novel BM method
that improves the quality of the standard local stereo
correspondence methods, while keeping the lean
properties of the algorithm. The basic idea behind our
method is to use several descriptor images for the
right intensity image, each representing the result of
applying a slanted center symmetric descriptor and
keeping the best matching score over a number of
disparities. In our approach we try to favor frontal
surfaces, and so we include a small penalty each time
the best cost comes from a slanted descriptor. By
tilting the matching descriptor we ensure that the
errors created by the perspective effect or due to
slanted surfaces are not aggregated to lead to
erroneous results. Furthermore, we try to reduce
errors by imposing a set of local constraints when
generating a winning disparity. Finally we filter
erroneous speckles, obtaining an improved disparity
map. We did extensive tests on the KITTI dataset in
order to prove that our solution leads to improved
results with respect to classical and state of the art
stereo methods. We have also projected the disparity
points in order to make a visual evaluation of the 3D
reconstructed region.
Further development directions include improving
the running time of our algorithm, and the
implementation of the solution on a low cost
embedded platform. We will also continue with the
search for improving the quality of the stereo
A Multi Patch Warping Approach for Improved Stereo Block Matching
465

matching results, by verifying the relation between
block sizes, camera parameters and the used
descriptor, since variations in any of these three
parameters forces us to change the settings of the
algorithm.
ACKNOWLEDGEMENTS
This work was supported by a grant of the Romanian
National Authority for Scientific Research and
Innovation, CNCS/CCCDI – UEFISCDI, project
number PN-III-P3-3.6-H2020-2016-00252016,
within PNCDI III.
This work was supported by the MULTIFACE grant
(Multifocal System for Real Time Tracking of
Dynamic Facial and Body Features) of the Romanian
National Authority for Scientific Research, CNDI–
UEFISCDI, Project code: PN-II-RU-TE-2014-4-
1746.
REFERENCES
Antunes, M., Barreto, J. P., Premebida, C. & Nunes, U. Can
Stereo Vision Replace A Laser Rangefinder? 2012
Ieee/Rsj International Conference On Intelligent
Robots And Systems, 7-12 Oct. 2012 2012. 5183-5190.
Einecke, N. & Eggert, J. Stereo Image Warping For
Improved Depth Estimation Of Road Surfaces.
Intelligent Vehicles Symposium (Iv), 2013 Ieee, 23-26
June 2013 2013. 189-194.
Einecke, N. & Eggert, J. Block-Matching Stereo With
Relaxed Fronto-Parallel Assumption. 2014 Ieee
Intelligent Vehicles Symposium Proceedings, 8-11
June 2014 2014. 700-705.
Einecke, N. & Eggert, J. A Multi-Block-Matching
Approach For Stereo. 2015 Ieee Intelligent Vehicles
Symposium (Iv), June 28 2015-July 1 2015 2015. 585-
592.
Geiger, A., Lenz, P., Stiller, C. & Urtasun, R. 2013. Vision
Meets Robotics: The Kitti Dataset. Int. J. Rob. Res., 32,
1231-1237.
Haller, I. & Nedevschi, S. Gpu Optimization Of The Sgm
Stereo Algorithm. Intelligent Computer
Communication And Processing (Iccp), 2010 Ieee
International Conference On, 26-28 Aug. 2010 2010.
197-202.
Haller, I. & Nedevschi, S. 2012. Design Of Interpolation
Functions For Subpixel-Accuracy Stereo-Vision
Systems. Ieee Transactions On Image Processing, 21,
889-898.
Hirschmuller, H. Accurate And Efficient Stereo Processing
By Semi-Global Matching And Mutual Information.
2005 Ieee Computer Society Conference On Computer
Vision And Pattern Recognition (Cvpr'05), 20-25 June
2005 2005. 807-814 Vol. 2.
Huang, J., Blanz, V. & Heisele, B. 2002. Face Recognition
With Support Vector Machines And 3d Head Models.
Pattern Recognition With Support Vector Machines
First International Workshop Svm, 2002. 334-341.
Kolmogorov, V. & Zabih, R. 2002. Multi-Camera Scene
Reconstruction Via Graph Cuts. In: Heyden, A., Sparr,
G., Nielsen, M. & Johansen, P. (Eds.) Computer Vision
— Eccv 2002: 7th European Conference On Computer
Vision Copenhagen, Denmark, May 28–31, 2002
Proceedings, Part Iii. Berlin, Heidelberg: Springer
Berlin Heidelberg.
Muresan, M. P., Negru, M. & Nedevschi, S. Improving
Local Stereo Algorithms Using Binary Shifted
Windows, Fusion And Smoothness Constraint.
Intelligent Computer Communication And Processing
(Iccp), 2015 Ieee International Conference On, 3-5
Sept. 2015 2015. 179-185.
Penner, M., Woods, M. & Pitt, D. 2015. A Comparison Of
Airborne Laser Scanning And Image Point Cloud
Derived Tree Size Class Distribution Models In Boreal
Ontario. Forests, 6, 4034.
Ranft, B., Strau, T. & X00df. Modeling Arbitrarily Oriented
Slanted Planes For Efficient Stereo Vision Based On
Block Matching. 17th International Ieee Conference
On Intelligent Transportation Systems (Itsc), 8-11 Oct.
2014 2014. 1941-1947.
Scharstein, D. & Szeliski, R. 2002. A Taxonomy And
Evaluation Of Dense Two-Frame Stereo
Correspondence Algorithms. International Journal Of
Computer Vision, 47, 7-42.
Woodfill, J. I., Gordon, G., Jurasek, D., Brown, T. & Buck,
R. The Tyzx Deepsea G2 Vision System, Ataskable,
Embedded Stereo Camera. 2006 Conference On
Computer Vision And Pattern Recognition Workshop
(Cvprw'06), 17-22 June 2006 2006. 126-126.
Yang, Q., Wang, L., Yang, R., Stew, H., X0e, Nius, Nist,
D. & X0e 2009. Stereo Matching With Color-Weighted
Correlation, Hierarchical Belief Propagation, And
Occlusion Handling. Ieee Transactions On Pattern
Analysis And Machine Intelligence, 31, 492-504.
Yasir Mohd Mustafah, A. W. A., M.H. Ani December 2012
Object Distance And Size Measurement Using Stereo
Vision System.
Zbontar, J. & Lecun, Y. 2015. Stereo Matching By Training
A Convolutional Neural Network To Compare Image
Patches. Corr, Abs/1510.05970.
VISAPP 2017 - International Conference on Computer Vision Theory and Applications
466
