
Unsupervised Discovery of Normal and Abnormal Activity Patterns in
Indoor and Outdoor Environments
Dario Dotti, Mirela Popa and Stylianos Asteriadis
Department of Data Science and Knowledge Engineering, Maastricht University, Maastricht, Netherlands
Keywords:
Ambient Assisted Living, Video Surveillance, Unsupervised Learning, Movement Histograms, Scene
Understanding.
Abstract:
In this paper we propose an adaptive system for monitoring indoor and outdoor environments using movement
patterns. Our system is able to discover normal and abnormal activity patterns in absence of any prior knowl-
edge. We employ several feature descriptors, by extracting both spatial and temporal cues from trajectories
over a spatial grid. Moreover, we improve the initial feature vectors by applying sparse autoencoders, which
help at obtaining optimized and compact representations and improved accuracy. Next, activity models are
learnt in an unsupervised manner using clustering techniques. The experiments are performed on both indoor
and outdoor datasets. The obtained results prove the suitability of the proposed system, achieving an accuracy
of over 98% in classifying normal vs. abnormal activity patterns for both scenarios. Furthermore, a seman-
tic interpretation of the most important regions of the scene is obtained without the need of human labels,
highlighting the flexibility of our method.
1 INTRODUCTION
Automatic monitoring and interpretation of daily
moving patterns has gained popularity over the last
decade, having applications in ambient-assisted living
(AAL), surveillance and shopping behaviour under-
standing. One of the goals in human behaviour under-
standing consists of detecting deviations from normal
behaviours by learning a model of an object’s regu-
lar activity patterns, and defining types of deviations
which could be considered abnormal. This analysis
is useful for modeling normal behaviours in varying
environments, such as a house, an office, or public
spaces (Mousavi et al., 2015). The behaviour model
contains information regarding the set of activities,
the regular times of entering and leaving a space, as
well as the duration of a stay. Sensor-based analy-
sis of individual or crowd behaviour in public spaces
is useful for obtaining a semantic understanding of
the scene, as well as for detecting potentially danger-
ous situations, such as violence, crashes or aggression
(Bermejo et al., 2011), while, in a home environment,
it can be useful for detecting alterations of the physi-
cal or emotional state of a person and improving their
well-being (Saenz-de Urturi and Soto, 2016).
In this paper, we propose an adaptive monitoring
system, able to work in both indoor and outdoor en-
vironments based on two different sensors: 3D sen-
sor Microsoft Kinect v2 and surveillance cameras. In
an office scenario, we aim to learn repeated patterns
of activities, and detecting non-expected behaviours
1
(abnormalities). In the outdoor scenario we use the
public dataset introduced in (Abrams et al., 2012),
where videos are taken from streaming webcams in
different public places capturing the same half an hour
every day for over a year.
Our approach aims to provide a statistical analysis
of the monitored environment, by extracting spatio-
temporal information such as trajectories, as well as
motion features. Trajectory analysis describes the re-
gions which are frequently occupied. Additionally,
motion information extracted from these regions con-
tributes to obtaining high level information such as
stationary behaviours (sitting, working at the desk) as
well as active behaviours (walking, exiting the space)
for the indoor scenario. On the other hand, for the
outdoor case, motion information is useful at distin-
guishing between several moving objects (e.g auto-
vehicles or pedestrians), as well as for identifying
usual spatial-motion patterns for each of the objects
(e.g. pedestrians crossing the street in a designated
1
In the remaining of this paper, we use the term be-
haviour to denote a set of activities over a short time in-
terval.
210
Dotti D., Popa M. and Asteriadis S.
Unsupervised Discovery of Normal and Abnormal Activity Patterns in Indoor and Outdoor Environments.
DOI: 10.5220/0006116902100217
In Proceedings of the 12th International Joint Conference on Computer Vision, Imaging and Computer Graphics Theory and Applications (VISIGRAPP 2017), pages 210-217
ISBN: 978-989-758-226-4
Copyright
c
2017 by SCITEPRESS – Science and Technology Publications, Lda. All rights reserved
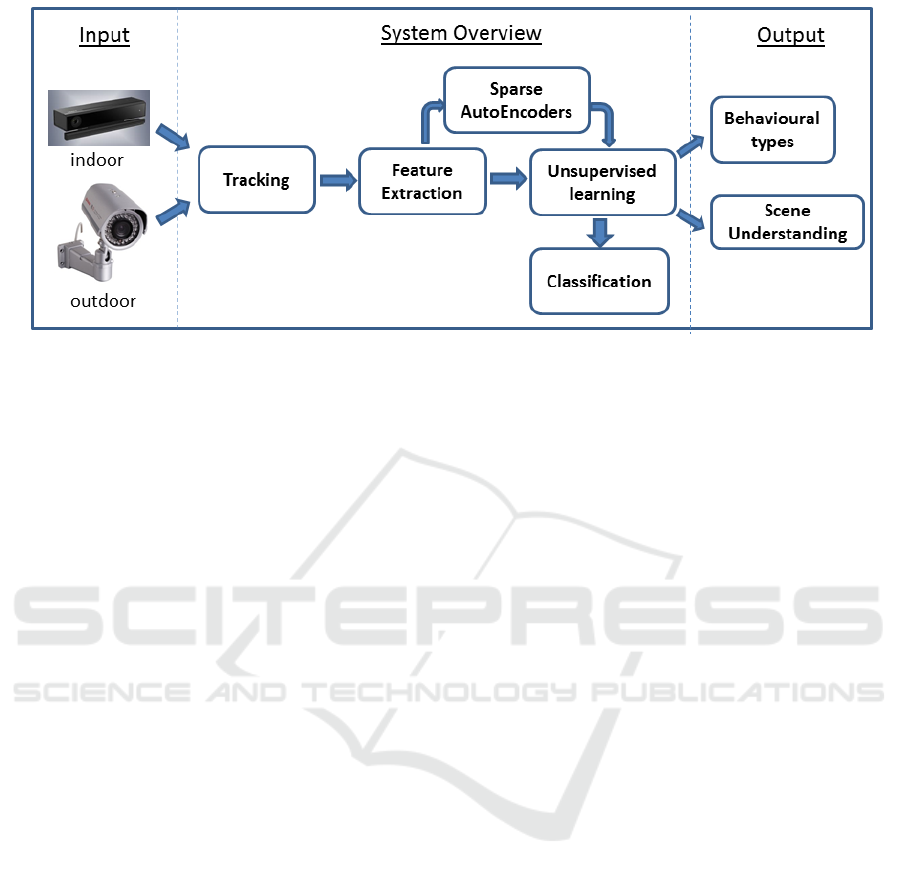
Figure 1: Overview of the proposed system.
area or not, cars moving on the street and parking in a
parking lot). Furthermore, we obtain an improved and
efficient feature representation, by applying a sparse
autoencoder algorithm on top of trajectory features,
which we prove to be useful for representing the ex-
pected and unexpected behavioural patterns in both
indoor and outdoor scenarios.
Manually providing annotation, defining what is
normal and what is abnormal can be difficult and time
consuming, especially if the system needs to be of-
ten deployed in different environments. Therefore, we
propose an unsupervised approach for obtaining data
annotations, by performing clustering on the extracted
features. To simplify this process, one of the results
of our analysis is a map of the environment, where
activity patterns are displayed with different colors.
We illustrate the overview of our proposed approach
in Fig. 1.
The contributions of our work are four-fold: First,
we propose a model for training a system to distin-
guish between normal vs. abnormal behaviours, in
unknown environments, in an unsupervised manner.
Second, we propose a simplistic, yet, efficient tra-
jectory descriptor, which, along with sparse autoen-
coders, can lead to optimized results in activity anal-
ysis. Third, we facilitate the integration of expert
opinion for obtaining a semantic interpretation of the
scene. Lastly, we propose a system that can learn an
environment from scratch and, thus, can be easily de-
ployed in new, unknown settings, both indoor and out-
door.
2 RELATED WORK
There has been proposed a great deal of works in
vision-based monitoring of indoor human behaviour
(Kasteren et al., 2010) (Nef et al., 2015), using dif-
ferent types of cameras, modalities and system archi-
tectures. One important component of any surveil-
lance system is tracking, which has been addressed
using a wide variety of methods (optical flow (Shin
et al., 2005), Kalman filtering (Deng et al., 2015))
and sensors (webcam, stereo, Kinect). In the cases
when tracking is not possible, like high density crowd
situations, motion characteristics are employed, such
as histogram of tracklets (Mousavi et al., 2015), or a
mixture of dynamic texture models (Li et al., 2014).
One common type of human behaviour modeling ap-
plications is to detect anomalies, and the main chal-
lenge is that there is no clear definition of abnormal-
ities, as they are context dependent and can appear
very rarely in the training set. There are several at-
tempts in the literature in this area, especially in the
context of elderly assisted living (Hoque et al., 2015),
or for smart homes (Nef et al., 2015). In this sce-
nario abnormalities are detected mainly using two ap-
proaches: a sudden change of behavior such as falling
down (Yang et al., 2016) or a statistical analysis over
longer period of time (Zhou et al., 2008). In the con-
text of an office-like environment, the benefits of hu-
man behaviour monitoring include prolonged sitting
detection (Paliyawan et al., 2014) using data mining
on real-time skeleton information, or tracking of com-
puter work postures (Uribe-Quevedo et al., 2013).
Learning behaviour patterns based on trajectory anal-
ysis has been investigated in (Efros et al., 2003) which
aims at capturing the overall spatial arrangement of
local motion displacement vectors, as well as in (Jiang
et al., 2009) where the authors propose the use of hi-
erarchical clustering, as a proposition to the analysis
of motion trajectories. Regarding outdoor environ-
ments, research in video surveillance is mainly fo-
cused on detecting aggression, (Nievas et al., 2011)
Unsupervised Discovery of Normal and Abnormal Activity Patterns in Indoor and Outdoor Environments
211

using local motion descriptors such as average mo-
tion and motion orientation variance in combination
with a bag-of-words approach. Others are concerned
with anomaly detection, by analyzing object trajecto-
ries in video and constructing patterns using cluster-
ing approaches, or by constructing mid-level repre-
sentations over crowd motions (Mousavi et al., 2015).
In this paper we focus on a methodology for detect-
ing abnormal behaviours in both indoor and outdoor
scenarios, which is also useful for obtaining a seman-
tic interpretation of the most important regions of the
scene. The main advantage of the proposed approach
relies in its ability to learn behavioural patterns in an
unsupervised way.
3 FEATURE EXTRACTION
Following the flow of activities presented in Fig. 1,
we first obtain trajectories from the tracking algo-
rithm, which are then fed to the feature extraction
module. The first step in our feature analysis is to split
the scene in n regions, where each region corresponds
to a part of the scene. For every region, we extract
different types of descriptors which are subsequently
used for activity representation.
3.1 Occupancy Histogram (OH)
In an indoor environment, often activities are corre-
lated with regions where they are performed, for ex-
ample, working on a computer occurs at the desk,
whereas meetings take place in the meeting area. On
the other hand, outdoor scenarios are less constrained
especially in public spaces like squares. In this sec-
tion, we compute the level of occupancy in each im-
age region and use it as a descriptor for behaviour un-
derstanding. As a first step, similar to the analysis de-
scribed in (Wong et al., 2014), we count the trajectory
points in each non-overlapping spatial patch to form
a region based occupancy histogram. A matrix m × n
is obtained, where m is the number of samples over a
fixed period of time (e.g. one day), each sample cap-
turing the motion characteristics in a given time inter-
val τ, and n is the number of patches, given a spatial
division of the scene.
3.2 Adapted Histogram of Oriented
Tracklets (AHOT)
(Raptis and Soatto, 2010) and (Mousavi et al., 2015)
showed that analyzing spatio-temporal descriptors
called tracklets could improve the recognition of hu-
man motion. A tracklet indicates the movement of a
subject, frame by frame, for a short period of time,
and it represents only a fragment of the global trajec-
tory, as it might terminate due to ambiguities in the
scene.
In this paper, we use an adaptation of the His-
togram of Oriented Tracklets (HOT) feature extrac-
tion algorithm for extracting statistical information
from each spatial block of the scene over the time
interval τ. Our descriptor is inspired from the al-
gorithm described in (Mousavi et al., 2015), where
the histogram representation considers only the maxi-
mum motion magnitude among all the tracklets inside
a spatio-temporal block, information which is useful
at modeling crowd behaviour. In our approach, we
aim at capturing individual motion patterns and there-
fore, we consider the motion characteristics of every
tracklet inside the spatio-temporal cuboid. For each
time sub-interval s
τ
we compute magnitude and ori-
entation values between two positions (x
i,s
t
, y
i,s
t
) and
(x
i,s
t+s
τ
, y
i,s
t+s
τ
), where i is the tracklet index and s is the
index of the spatial block, as follows:
Θ
i,s
= arctan
(y
i,s
t+s
τ
− y
i,s
t
)
(x
i,s
t+s
τ
− x
i,s
t
)
(1)
M
i,s
=
q
(x
i,s
t+s
τ
− x
i,s
t
)
2
+ (y
i,s
t+s
τ
− y
i,s
t
)
2
(2)
3.3 Motion Descriptor (SPEED)
To enable a better understanding of the types of be-
haviors displayed in an outdoor environment, we need
as an initial step, to distinguish between the moving
objects present in the scene. This analysis is use-
ful at detecting abnormal behaviours which are dif-
ferent across the various types of involved objects
such as pedestrians and auto-vehicles. One intuitive
feature that can help in this process is the speed de-
scriptor, which can be augmented with acceleration
and curvature features, giving the final tuple: S
i,s
=
[vel
i,s
, acc
i,s
, k
i,s
], where i is the trajectory index and s
is the index of the spatial block.
3.4 Fused Descriptor (CAHOT)
Additionally, we fuse the two descriptors AHOT and
SPEED explained above, using a histogram represen-
tation. Since AHOT already contains magnitude re-
lated information, we augmented the descriptor with
curvature features due to their invariance properties
which are useful in the clustering process. The result-
ing fused descriptor is called CAHOT.
VISAPP 2017 - International Conference on Computer Vision Theory and Applications
212

3.5 Sparse Autoencoders (SAE)
Given our mid-level motion descriptors, we also aim
to extract more meaningful and compact features us-
ing Sparse Autoencoders (Masci et al., 2011). An au-
toencoder is a technique which aims to minimize the
reconstruction error between the input and the out-
put in an unsupervised way. It is useful at estimat-
ing the underlying data distribution, and by placing
constraints on the network like sparsity (Ngiam et al.,
2010), the algorithm can learn interesting structure of
the data. Autoencoders proved to be suitable not only
for computer vision data, but also for a range of prob-
lems including text, audio, as well as multimodal data
(Ngiam et al., 2010).
For a single layer autoencoder, the encoder f
0
and
decoder g
0
functions are designed to reconstruct the
input data X, represented as a vectorized set of in-
put features X
i
= [x
1
, . . . , x
n
]
T
∈ R
n
, as good as pos-
sible in an unsupervised way. Therefore, given input
data X
i
, the encoding step is obtained using the func-
tion f
0
, while the mid-level representation is denoted
by h(i) = f
0
(W
1
X
i
+ b) and the decoding step is cap-
tured by the function g
0
and the reconstruction result
is denoted by y(i) = g
0
(W
2
h(i) + c). {W
1
, W
2
} are the
weight matrices and {b, c} are the encoding and de-
coding bias parameters. The optimization goal is to
minimize the error between the input data X
i
and the
reconstructed data y(i), using a batch gradient descent
algorithm where the cost function J can be defined as:
J
sparse
(i) =
k
y(i) − X
i
k
2
2
+α
2
∑
j=1
W
j
2
2
+β(ρ, ρ
0
) (3)
where the second term of the function is a regu-
larization term that tends to decrease the magnitude
of the weights—which helps to prevent overfitting—
and the parameter α controls the relative importance
of the two terms. The third term controls the sparsity,
ρ is the mean activation of the hidden units, and ρ
0
is a sparsity parameter which is usually a small value
close to zero, which we impose to be ρ
0
= 0.01. This
sparsity constraint will force most of the hidden units
to be close to 0, reconstructing the input using as few
features as possible.
To verify the efficiency of the proposed algorithm,
we used the tracks from one scenario of the LOST
dataset to train the sparse autoencoder (SAE) algo-
rithm
2
, and the learned weights from the hidden layer
are depicted in Fig. 2, proving that the employed al-
gorithm is useful at obtaining a compact, yet mean-
ingful representation of the input data.
2
For our experiments we used NVIDIA Titan X GPUs
Figure 2: Visualization of the SAE hidden layer weights,
revealing the main behaviour patterns in the outdoor scene.
3.6 Unsupervised Learning
The goal of this study is to develop a system useful
for detecting normal and abnormal behaviour patterns
in unknown environments, in an unsupervised man-
ner. One of the advantages of using an unsupervised
approach, resides in obtaining an automatic labeling
of the data, which can then be used as benchmark
data for labelling (classifying) new, incoming infor-
mation. In this study, we employ different clustering
algorithms to assign labels to different data samples.
We aim to obtain a clear separation between different
behaviour patterns, which are seen as a combination
of motion patterns and the scene regions, where they
take place in. For example, in an office, working at the
desk area, exiting the room using the transition region,
or using the recreational region, are examples of nor-
mal behaviour, while staying in the middle of the of-
fice for a long time, could be an example of an abnor-
mal behaviour, as it might disturb the other workers.
On the other hand, for a surveillance camera set in a
public square, spatial and motion patterns may not be
enough to characterize an abnormal behaviour, given
the great variety of moving objects. In fact, pedestri-
ans, bicycles, and auto-vehicles have different rules to
respect, hence an abnormal behavior model needs to
be defined according to this division. Finally, the la-
bels obtained in this module are used for training and
testing the next system’s component in a supervised
way using the Logistic Regression Classifier.
4 DATASETS
We tested our system on two datasets: The Long-term
Observation of Scenes (with Tracks) or LOST dataset
(Abrams et al., 2012) containing outdoor videos, and
Unsupervised Discovery of Normal and Abnormal Activity Patterns in Indoor and Outdoor Environments
213
KIMOFF (kinect-monitoring-office) a dataset created
by us, monitoring the people in an office environment,
during usual working hours for twenty-four days.
4.1 LOST: Longterm Observation of
Scenes (with Tracks)
LOST (Abrams et al., 2012) is a publicly avail-
able dataset including 24 streaming outdoor webcams
from different locations in the world over a long pe-
riod of time. It provides extracted trajectories and the
bounding box of moving objects but not the ground-
truth for behaviour analysis. The reason we chose
to analyze our proposed methodology on the LOST
dataset is because it offers long-term tracks in differ-
ent outdoor scenarios, while there is limited research
work dealing with abnormal behaviour detection on it.
For example, the work by (See and Tan, 2014) anal-
yses synthetically injected trajectories which are con-
sidered anomalies, but they might insufficient when
dealing with real-world abnormalities. We follow
the same experimental setting made by (See and Tan,
2014), by analyzing only two cameras, ”camera 001”
(Ressel Square, Chrudim, Czech Republic) and ”cam-
era 017” (Havlickuv Brod, Czech Republic).
4.1.1 Pedestrians vs. Auto-vehicles Clustering in
LOST Dataset
Defining an abnormal behavior model from the data
captured by these two cameras can be very challeng-
ing given the big changes of the scenario and the va-
riety of moving objects. Therefore, our first task is
to separate the trajectories belonging to pedestrians
from the trajectories belonging to auto-vehicles using
the feature descriptors introduced in section 3.
To find the best descriptor for this task, we use
as ground-truth the bounding boxes information pro-
vided in the dataset, even though they are often inac-
curate due to tracking errors. We compute the aspect
ratio of each bounding box assigning the label ”auto-
vehicle” if the longer side is horizontal and the label
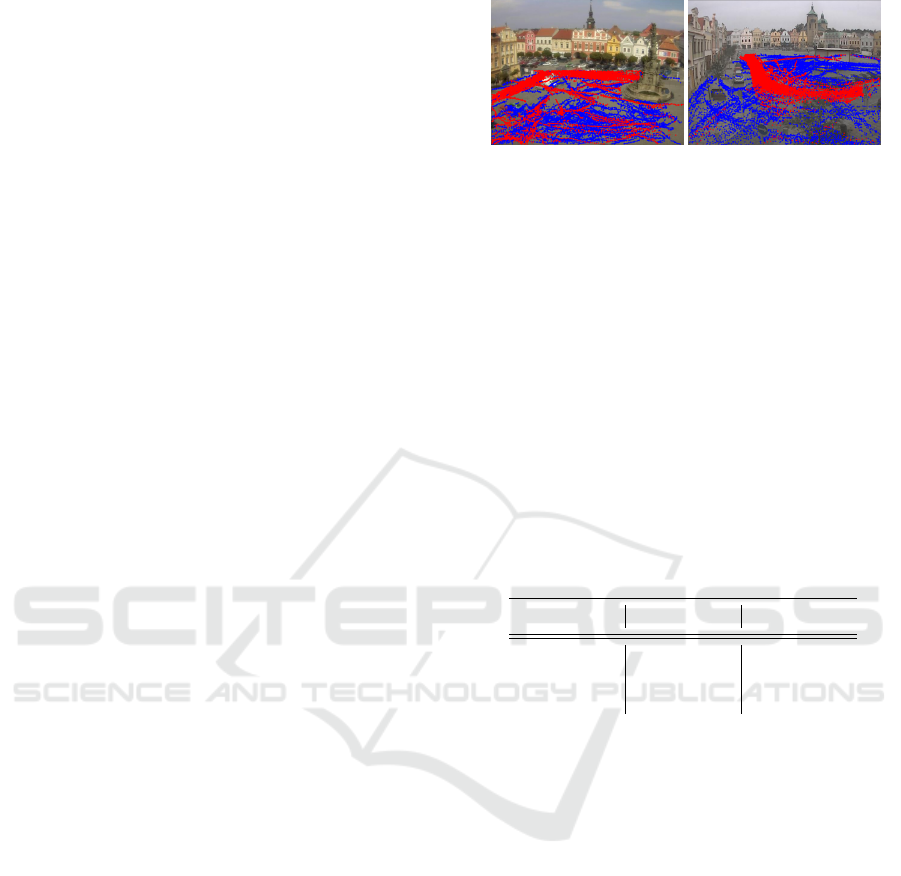
”pedestrian” if the longer size is vertical. Fig. 3 de-
picts the separation between auto-vehicles and pedes-
trians in the two analyzed scenarios. In Fig. 3(a) the
spatial separation between the two classes is less clear
then in 3(b) due to the many events that take place in
the square. In fact, during these events trucks are al-
lowed to enter the square for commercial or construc-
tion purposes.
Table 1 shows the prediction accuracy between
pedestrians and auto-vehicles using different descrip-
tors and the logistic regression classifier. In ”Cam-
era001”, the SPEED descriptor obtains the best re-
(a) (b)
Figure 3: (a)”Camera001” (b) ”Camera017”. Color red in-
dicates the vehicles trajectories, color blue indicates pedes-
trian trajectories.
sult, as it embeds information which is more robust
to the clutter scenario. Orientation information em-
bedded in the AHOT and CAHOT descriptors be-
comes less crucial when the auto-vehicles are allowed
to go almost everywhere, during the events. On the
other hand, in ”Camera017” CAHOT and AHOT de-
scriptors perform better than SPEED because auto-
vehicles follow the same path, information which is
captured by the orientation and curvature features.
Next, because abnormality has different meanings for
each of the classes, we will treat them separately as
input to the abnormal behavior detection module.
Table 1: Pedestrian vs. Auto-vehicles prediction accuracy.
Descriptors Camera001 Camera017
SPEED 83.5% 85.5%
AHOT 82.7% 87.6%
CAHOT 82.8% 87.7%
4.2 KIMOFF: Monitoring Office using
Kinect
As no indoor behaviour dataset suitable for anomaly
detection using trajectories was available, we decided
to create a new one for testing our system. We
recorded a dataset by tracking people in an office
room during working hours using Kinect SDK 2.0
recently released by Microsoft. The SDK skeleton
tracking functionality (Microsoft Kinect SDK, ) de-
tects and tracks 20 joints on the human skeleton at
around 30 frames per second. The sensor was placed
in a high position in the room in order to have a wide
coverage. We chose to track only the head joint due
to the camera position and the context of the exper-
iments (an indoor environment where people are of-
ten sitting at their desk and half of the body is oc-
cluded). Trajectories from twenty-four working days
were recorded from 9 a.m. to 6 p.m., workers were
aware of the camera but they all acted normal, as the
purpose of the recordings was to capture a real-life
situation and not artifacts.
VISAPP 2017 - International Conference on Computer Vision Theory and Applications
214
5 EXPERIMENTAL RESULTS
5.1 Unsupervised Learning Result
Given the different feature descriptors introduced in
section 3, k-means and mean-shift clustering are ap-
plied and the best result is chosen applying user
knowledge, as the clusters have to reflect the human
interpretation of the scene. This is a key point in our
system, as instead of manually labeling each video
sample, we allow the users of the system to validate
the clustering results as well as defining what is nor-
mal and what is abnormal for the considered scenario.
We obtain a set of labels for each scenario (indoors
and outdoors) and for each type of descriptors, which
are then used for training the logistic regression clas-
sifier.
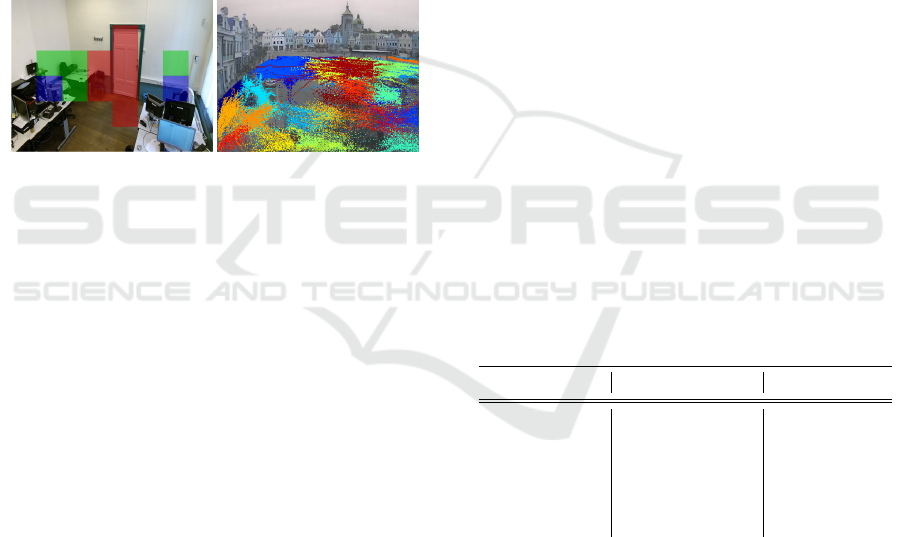
(a) Indoor scenario (b) Outdoor scenario
Figure 4: Unsupervised semantic interpretation of the
scene.
In Fig. 4 we present an example of the obtained
clustering result on both datasets, using the AHOT de-
scriptor. The different colors belong to different ac-
tivity patterns. For the indoor dataset depicted in Fig-
ure 4(a), red indicates the regions of the scene where
big movements are found (e.g. corridor area and the
door), which are transition areas. Green indicates the
regions of the scene where light movements are de-
tected, including areas close to the desks, where ac-
tivities such as standing up, sitting down, or stretch-
ing are observed. Finally, blue indicates the regions
where no-movement is detected, being restricted to
the regions close to the computers, where usually peo-
ple do not move too much because they are focused.
In the clustering process, we included only the re-
gions which had an activation level above a threshold,
meaning that the subjects were visiting these regions
at least n − times, or that the motion magnitude in-
side each region was higher than a threshold set at 0.1.
Figure 4(b) shows the clustering result of the pedes-
trian trajectories in the outdoor scenario. Pedestrians
can be observed in all regions of the scene. How-
ever, they should follow the road regulations perform-
ing actions like crossing the street only in the per-
mitted areas. Following this regulation, we chose the
clusters that contained deviations from the permitted
behaviour and labeled them as abnormal behaviours.
The results obtained are satisfactory, as they can be in-
terpreted in a meaningful way, highlighting that both
spatial regions and motion information are important
to define activity patterns.
Examples of discovered normal and abnormal pat-
terns are shown in Fig. 5, normal behaviour patterns
are defined by trajectories colored in blue, whereas
abnormal behaviours are colored in red. Fig. 5(a)
depicts the most common behaviour pattern in an of-
fice, as we expect that most of the time people are in
front of the computer, creating big clouds of tracking
points in the desk regions. For the outdoor scenario,
Fig. 5(b) shows tracks of pedestrians walking on the
appropriate location: sidewalk. On the other hand,
in Fig. 5(c) one possible abnormal behaviour in an
office is shown; a person is standing up (red trajec-
tory clouds) being close to the worker sitting at the
desk (blue points), which might indicate an interac-
tion pattern for a long period. In Fig.5(d) pedestrians
are crossing the road in dangerous areas where zebra
crossing signs are not present, therefore we defined
these actions as abnormalities.
5.2 Abnormal Behavior Prediction
Performance
In this section we present the analysis of the per-
formed experiments, for detecting normal vs. abnor-
mal activity patterns, using the features described in
section 3.
Table 2: Abnormal behavior prediction accuracy.
Descriptors KIMOFF Dataset LOST Dataset
SAE(AHOT) 98.4% 98.7%
AHOT 96.5% 97.5%
SAE(CAHOT) 86.1% 98.3%
CAHOT 85.2% 94.2%
SPEED 80.1% 97%
OH 97.4% −
Two important parameters in our analysis are rep-
resented by the temporal window of an activity pat-
tern τ and the spatial division of the scene in n blocks.
By adapting these two parameters, our system is able
to detect abnormal behaviors in different scenarios
and to analyze data recorded by two different sensors:
surveillance cameras and Microsoft Kinect V2 sensor.
In the indoor scenario, the best result was obtained
using τ = 10 minutes, due to the average duration of
an activity pattern observed in the dataset. Next, re-
garding the spatial division of the three-dimensional
indoor scene, the best division was n = (8 × 6 × 2).
In the outdoor scenario, we set τ = 2 minutes, as ac-
Unsupervised Discovery of Normal and Abnormal Activity Patterns in Indoor and Outdoor Environments
215
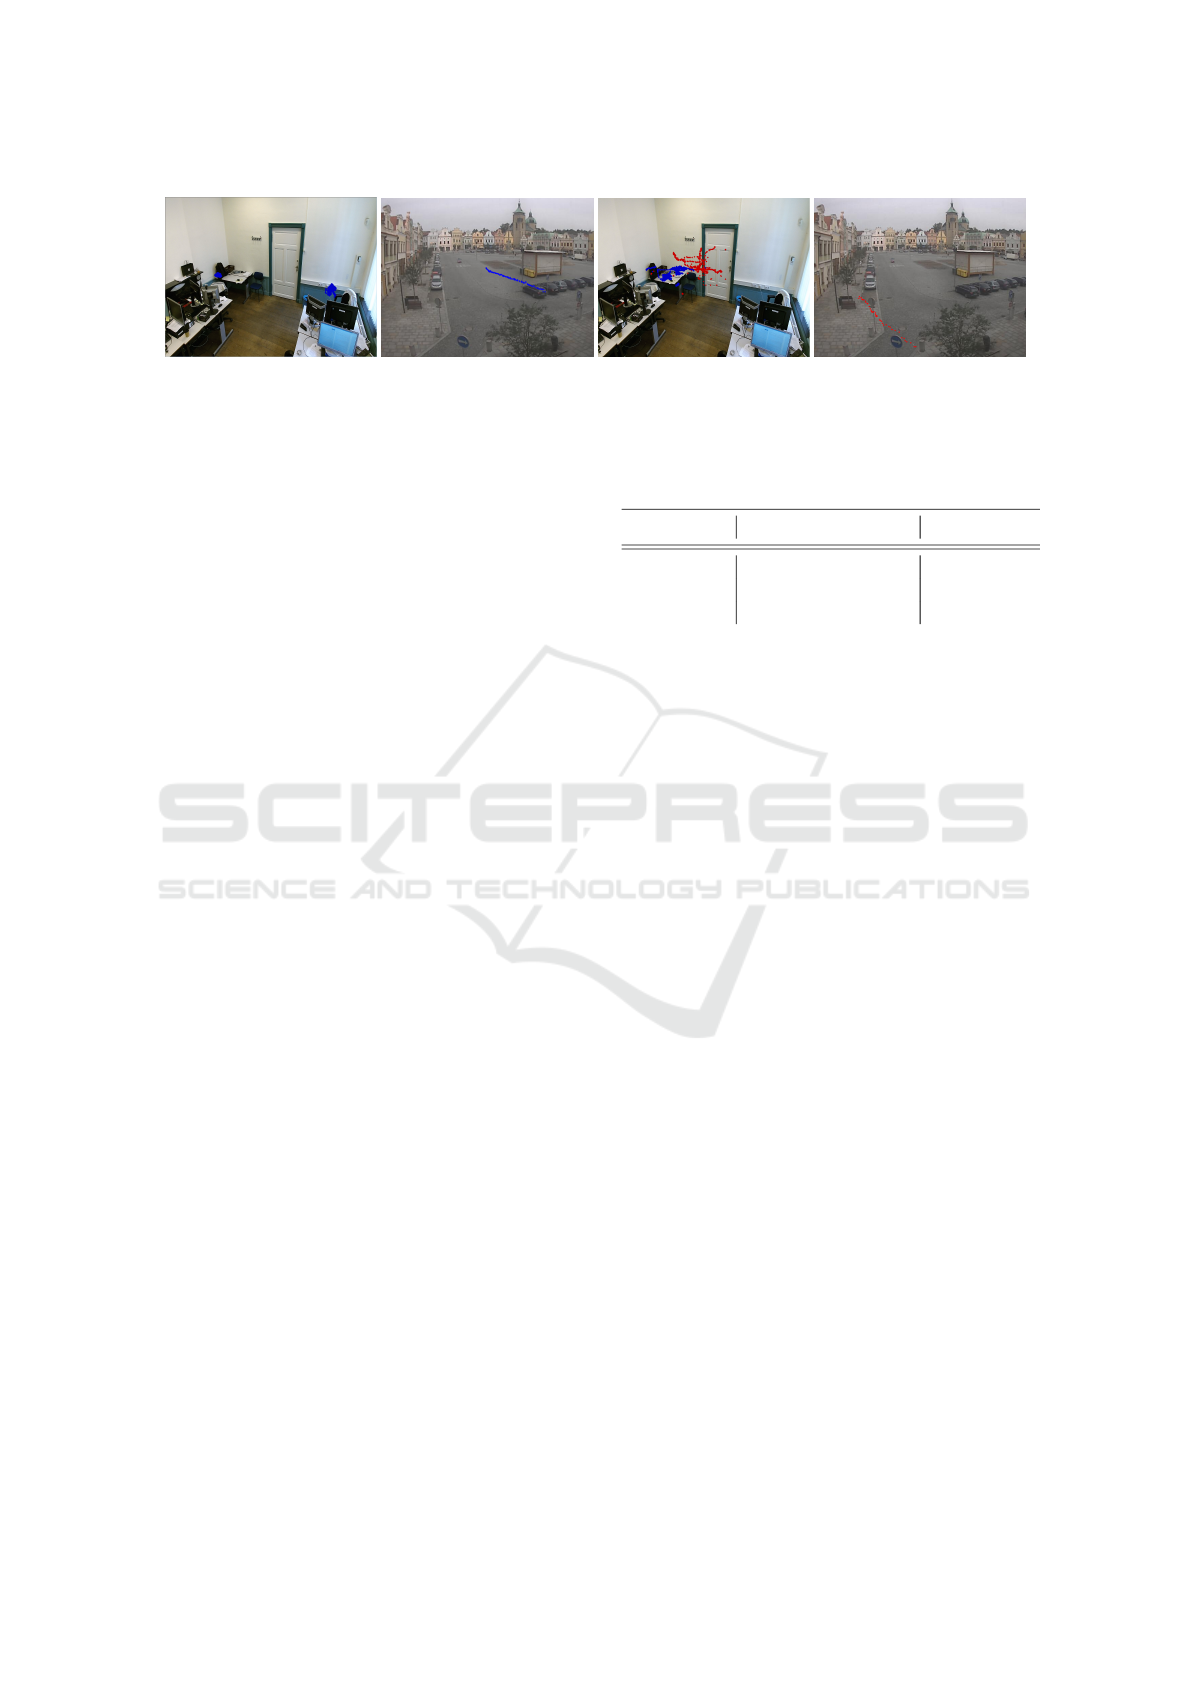
(a) Working at the desks (b) Walking on the pedestrian
sidewalk
(c) Converging in the middle
of the room
(d) Crossing the road in a
dangerous area
Figure 5: Examples of normal and abnormal behaviors from the two analysed datasets.
tivities are shorter and the spatial division of the two-
dimensional scene into 8×6 blocks, as the sky region
was not taken into consideration.
Table 2 displays the results obtained for the pro-
posed feature descriptors using Logistic Regression
classifier. As expected, the motion related descrip-
tors obtain higher results in the outdoor scenario than
in the indoor one, and viceversa, density based His-
togram (OH) obtains the highest result in the indoor
scenario. The best result in both scenarios is obtained
by applying the Sparse Autoencoder algorithm (SAE)
on top of the adapted histogram of oriented Track-
lets (AHOT). The feature representation obtained us-
ing the learned hidden layer parameters (W
1
, b), in-
troduced in section 3.5, is beneficial as it helps at in-
creasing the accuracy of the classification method in
relation to the raw features. In fact, in Table 2 we
highlight that the augmented features obtained by ap-
plying the SAE algorithm, reach higher accuracy than
raw features in all the cases. Moreover, once trained,
the autoencoder algorithm is useful at compressing
the feature vectors, by estimating the underlying fea-
ture distribution and decreasing the processing time
in the case of real-time applications. The best results
are obtained for the SAE algorithm, using 100 hid-
den units, hence drastically decreasing the size of the
AHOT and CAHOT raw descriptors. The number of
hidden units was found experimentally, using 10-fold
cross validation.
As the ”camera 001” scenario of the LOST
Dataset is a public square, where pedestrians can go
anywhere and because we did not find any particular
abnormal behaviours, we decided to compare our re-
sults with the ones introduced in (See and Tan, 2014).
We followed the same methodology for obtaining
synthetically generated trajectories, using a velocity
fluctuation within 2σ, 2.5σ and 3σ (standard devia-
tion) of the mean in a Gaussian distribution. Next, we
extracted SPEED descriptors from the two sets of tra-
jectories (original and synthetically generated ones),
while the obtained results are shown in Table 3, prov-
ing the efficacy of the proposed descriptors at distin-
guishing between the two classes.
Table 3: Anomaly detection results for sythetically injected
trajectories.
Fluctuation (See and Tan, 2014) Our method
σ = 2 67.2% 78.8%
σ = 2.5 82.6% 89%
σ = 3 93% 96%
6 CONCLUSIONS AND FUTURE
WORK
In this paper we proposed a new system for detecting
normal and abnormal human behaviours in an office-
like environment, as well in an outdoor environment.
Our approach is based on a spatial-temporal method
which analyzes trajectories over a spatial grid. One
important aspect of our work relies in the flexibility
and generalization ability of the proposed system, as
our feature extraction and clustering algorithms offer
useful insights on the underlying data in an unsuper-
vised way. This new feature representation enables
the discovery of semantic regions based on the users’
behaviour over long periods of time, facilitating the
annotation task. The obtained results prove the effi-
cacy of our method, as we are able to correctly clas-
sify normal vs. abnormal behaviour in over 98% of
the cases in both scenarios, while sparse autoencoders
improve the classification accuracy by at least 1% in
comparison to the raw spatial and motion descriptors.
As future work, we plan to extend our study by an-
alyzing users’ behaviour inside stationary regions us-
ing action recognition. Furthermore, we aim at fusing
trajectory related data with different types of ambient
sensors, for increasing the confidence of our tracking
module in case of occlusions or a limited field of view.
ACKNOWLEDGEMENT
This work has been funded by the European Union’s
VISAPP 2017 - International Conference on Computer Vision Theory and Applications
216

Horizon 2020 Research and Innovation Programme
under Grant Agreement N 690090 (ICT4Life project).
REFERENCES
Abrams, A., Tucek, J., Jacobs, N., and Pless, R.
(2012). LOST: Longterm Observation of Scenes (with
Tracks). In IEEE Workshop on Applications of Com-
puter Vision (WACV), pages 297–304.
Bermejo, E., Deniz, O., Bueno, G., and Sukthankar, R.
(2011). Violence detection in video using computer
vision techniques. In Int. Conf. on Computer Analysis
of Images and Patterns, pages 332–339.
Deng, Z.-A., Hu, Y., Yu, J., and Na, Z. (2015). Extended
Kalman filter for real time indoor localization by fus-
ing WiFi and smartphone inertial sensors. Microma-
chines, 6:523–543.
Efros, A., Berg, A., Mori, G., and Malik, J. (2003). Rec-
ognizing action at a distance. In IEEE Int. Conf. on
Computer Vision, pages 726–733.
Hoque, E., Dickerson, R. F., Preum, S. M., Hanson, M.,
Barth, A., and Stankovic, J. A. (2015). Holmes: A
comprehensive anomaly detection system for daily in-
home activities. In 11th IEEE Int. Conf. on Distributed
Computing in Sensor Systems.
Jiang, F., Wu, Y., and Katsaggelos, A. K. (2009). A dy-
namic hierarchical clustering method for trajectory-
based unusual video event detection. IEEE Trans. on
Image Processing, 18(4):907–913.
Kasteren, T. v., Englebienne, G., and Krse, B. (2010). Ac-
tivity recognition using semi-markov models on real
world smart home datasets. J. Ambient Intell. Smart
Environ., 2:311–325.
Li, W., Mahadevan, V., and Vasconcelos, N. (2014).
Anomaly detection and localization in crowded
scenes. IEEE Trans. on Pattern Analysis and Machine
Intelligence (PAMI), 36(1):18–32.
Masci, J., Meier, U., Ciresan, D., and Schmidhuber, J.
(2011). Stacked convolutional auto-encoders for hi-
erarchical feature extraction. In 21th Int. Conf. on Ar-
tificial Neural Networks (ICAN’11), pages 52–59.
Microsoft Kinect SDK. https://msdn.microsoft.com/en-
us/library/microsoft.kinect.kinect.jointtype.aspx.
Mousavi, H., M., Perina, A., Chellali, R., and Mur, V.
(2015). Analyzing tracklets for the detection of ab-
normal crowd behavior. In Proc. of the IEEE Win-
ter Conf. on Applications of Computer Vision (WACV
2015), pages 148–155.
Nef, T., Urwyler, P., Bchler, M., Tarnanas, I., Stucki, R.,
Cazzoli, D., Mri, R., and Mosimann, U. (2015). Eval-
uation of Three State-of-the-Art Classifiers for Recog-
nition of Activities of Daily Living from Smart Home
Ambient Data. Sensors, 15(5):11725–11740.
Ngiam, J., Khosla, A., and Kim, M. (2010). Multimodal
deep learning. NIPS 2010 Workshop on Deep Learn-
ing and Unsupervised Feature Learning, pages 1–9.
Nievas, E. B., Suarez, O. D., Garc
´
ıa, G. B., and Sukthankar,
R. (2011). Violence detection in video using computer
vision techniques. In Proc. of the 14th Int. Conf. on
Computer Analysis of Images and Patterns (CAIP’11),
pages 332–339.
Paliyawan, P., Nukoolkit, C., and Mongkolnam, P. (2014).
Prolonged Sitting Detection for Office Workers Syn-
drome Prevention Using Kinect. In 11th Int.
Conf. on Electrical Engineering/Electronics, Com-
puter, Telecommunications and Information Technol-
ogy (ECTI-CON), pages 1–6.
Raptis, M. and Soatto, S. (2010). Tracklet descriptors for
action modeling and video analysis. Lecture Notes in
Computer Science (LNCS), 6311:577–590.
Saenz-de Urturi, Z. and Soto, G. Z. B. (2016). Kinect-Based
Virtual Game for the Elderly that Detects Incorrect
Body Postures in Real Time. Sensors, 16(5).
See, J. and Tan, S. (2014). Lost World: Looking for
Anomalous Tracks in Long-term Surveillance Videos.
In Proc. of the Image and Vision Computing New
Zealand (IVCNZ), pages 224–229.
Shin, J., Kim, S., Kang, S., Lee, S.-W., Paik, J., Abidi, B.,
and Abidi, M. (2005). Optical flow-based real-time
object tracking using non-prior training active feature
model. RealTime Imaging, 11(3):204–218.
Uribe-Quevedo, A., Perez-Gutierrez, B., and Guerrero-
Rincon, C. (2013). Seated tracking for correcting
computer work postures. In 29th Southern Biomed-
ical Engineering Conf. (SBEC), pages 169–170.
Wong, K. B.-Y., Zhang, T., and Aghajan, H. (2014). Data
Fusion with a Dense Sensor Network for Anomaly
Detection in Smart Homes. Human Behavior Under-
standing in Networked Sensing, pages 45–73.
Yang, L., Ren, Y., and Zhang, W. (2016). 3D depth im-
age analysis for indoor fall detection of elderly people.
Digital Communications and Networks, 2(1):24–34.
Zhou, Z., Chen, X., Chung, Y.-C., He, Z., Han, T. X., and
Keller, J. M. (2008). Activity analysis, summariza-
tion, and visualization for indoor human activity mon-
itoring. IEEE Trans. on Circuits and Systems for Video
Technology, 18(11):1489–1498.
Unsupervised Discovery of Normal and Abnormal Activity Patterns in Indoor and Outdoor Environments
217
