
Pattern Recognition Application in ECG Arrhythmia Classification
Soodeh Nikan, Femida Gwadry-Sridhar and Michael Bauer
Department of Computer Science, University of Western Ontario, London, ON, Canada
Keywords: Arrhythmia Classification, Pattern Recognition, Beat Segmentation, 1-D LBP, ELM Classification.
Abstract: In this paper, we propose a pattern recognition algorithm for arrhythmia recognition. Irregularity in the
electrical activity of the heart (arrhythmia) is one of the leading reasons for sudden cardiac death in the
world. Developing automatic computer aided techniques to diagnose this condition with high accuracy can
play an important role in aiding cardiologists with decisions. In this work, we apply an adaptive
segmentation approach, based on the median value of R-R intervals, on the de-noised ECG signals from the
publically available MIT-BIH arrhythmia database and split signal into beat segments. The combination of
wavelet transform and uniform one dimensional local binary pattern (1-D LBP) is applied to extract sudden
variances and distinctive hidden patterns from ECG beats. Uniform 1-D LBP is not sensitive to noise and is
computationally effective. ELM classification is adopted to classify beat segments into five types, based on
the ANSI/AAMI EC57:1998 standard recommendation. Our preliminary experimental results show the
effectiveness of the proposed algorithm in beat classification with 98.99% accuracy compared to the state of
the art approaches.
1 INTRODUCTION
One of the primary cause of sudden death globally is
cardiovascular disease. The improper life style by
having an unhealthy diet, tension and stress, tobacco
consumption and insufficient exercise leads to
cardiovascular disease. Atrial and ventricular
arrhythmias are concurrent side effects arises from
cardiovascular disease. Arrhythmia is abnormal
changes in the heart rate due to improper heart
beating which causes failure in the blood pumping.
The abnormal electrical activity of the heart can be
life threatening. Arrhythmias are more common in
people who suffer from high blood pressure,
diabetes and coronary artery disease.
Electrocardiograms (ECGs) are the recordings of
electrical activities of the heart. Each heart beat in an
ECG record is divided into P, QRS and T waves
which indicate the atrial depolarization, ventricular
depolarization and ventricular repolarisation,
respectively. Electrocardiograms are used by
cardiologists to detect abnormal rhythms of the
heart. Cardiologists must deal with challenges in the
diagnosis of arrhythmia due to the effect of noise in
ECG signals and the nonstationary nature of the
heart beat signal. Automatic interpretation of ECG
data using time-frequency signal processing
techniques and pattern recognition approaches could
be helpful to both cardiologists and patients for
improved diagnostics (Thomas et al., 2015; Elhaj et
al., 2016).
Although in the past few years, several
computer-aided methods for early prediction of the
risk of cardiovascular disease have been
investigated, it is still an extremely challenging
problem. There are many pattern recognition
techniques in the literature to recognize and classify
ECG beats. Particle swarm optimization (PSO) and
radial basis functional neural network (RBFNN)
were employed in the proposed beat classification
algorithm in (Korurek and Dogan, 2010). In
(Khoshnoud and Ebrahimnezhad, 2013), an accuracy
of 92.9% was obtained where linear predictive
coefficients (LPC) were adopted as beat features and
normal and abnormal beat types were classified
using probabilistic neural networks. In (Inan et al.,
2006), beats are classified with an accuracy of
95.16% using the combination of time–frequency
features, using wavelet transform, time domain
information and the use of an artificial neural
network (ANN) as a classifier. In (Martis et al.,
2013a) a combination of a linear DWT feature
extraction and principal component analysis (PCA),
as dimensionality reduction technique, and neural
48
Nikan S., Gwadry-Sridhar F. and Bauer M.
Pattern Recognition Application in ECG Arrhythmia Classification.
DOI: 10.5220/0006116300480056
In Proceedings of the 10th International Joint Conference on Biomedical Engineering Systems and Technologies (BIOSTEC 2017), pages 48-56
ISBN: 978-989-758-213-4
Copyright
c
2017 by SCITEPRESS – Science and Technology Publications, Lda. All rights reserved

network classifier leads to 98.78% classification
accuracy between normal and abnormal beats. In
(Kadambe and Srinivasan, 2006), normal and
abnormal time domain features, P, QRS and T
waves from American Heart Association database
were classified with the accuracy of 96%, 90% and
93.3%, respectively, by discretizing the wavelet
basis function using an adaptive sampling scheme.
Adaptive parameters of wavelet non-linear functions
and the relative weight of each basis function were
estimated using a neural network. An accuracy of
99.65% for arrhythmia recognition was reported in
(Yu and Chen, 2007) using wavelet transform and a
probabilistic neural network. However, a small
subset of MIT-BIH ECG database (only 23 records)
was employed for evaluation. In order to classify
ECG beats, the authors in (Ebrahimzadeh and
Khazaee, 2009) adopted statistical features from
Lyapunov exponents and wavelet coefficients power
spectral density (PSD) values of eigenvectors and
achieved a 94.64% accuracy for eight records from
MIT-BIH arrhythmia database. Due to the effect of
noise, and the nonstationary nature of ECG signal,
nonlinear techniques appear to be more effective in
extracting distinctive and hidden characteristics of
ECG signals. In (Martis et al., 2013b), higher order
spectra (HOS) bi-spectrum cumulants and PCA
dimensionality reduction approach were adopted to
represent ECG signals and feed-forward neural
network and least square support vector machine
(SVM) were used for classifying different types of
beats with an accuracy of 93.48%. In (Khalaf et al.,
2015), a cyclostationary analysis was proposed as a
feature extraction approach to reduce the effect of
noise and also to reveal hidden periodicities of ECG
beats where spectral correlation coefficients were
utilised as statistical signal characteristics and
passed through SVM for classification; this results in
an accuracy of 98.6% for 30 records of the MIT-BIH
Arrhythmia database. Authors in (Oster et al., 2015)
proposed a switching Kalman filter technique for
arrhythmia classification, and automatic selection of
beat type. This method also includes a beat type for
unknown morphologies “X-factor” which
incorporates a form of uncertainty in classification
for the case of indecision on the beat type. The
classification F1 score of the algorithm on MIT-BIH
arrhythmia database was 98.3%. Employing the
fusion of linear and nonlinear features has benefits
the advantages of handling noise and a more
effective description of the signal. In (Elhaj et al.,
2016), a combination of linear (PCA of DWT
coefficients) and nonlinear (high order statistics,
cumulants and independent component analysis)
features were proposed for heart beat representation.
An accuracy of 98.91% was achieved using the
fusion of SVM and radial basis function classifiers
to classify five types of arrhythmia. The
combination of fourth and fifth scale dual-tree
complex wavelet transform (DTCWT) coefficients,
AC power, kurtosis, skewness and timing
information were adopted in (Thomas et al., 2015)
as QRS characteristics. Multi-layer back propagation
neural network was proposed to classify five types
of ECG beats of MIT-BIH Arrhythmia database with
the accuracy of 94.64%.
As discussed, encouraging results on the
arrhythmia classification have been obtained in
previous research. However, more applicable and
fully automatic techniques with high accuracy and
low complexity need to be developed. In particular,
developing automatic computer aided segmentation
of ECG signal into heart beats is very important as
the first stage in beat classification. In previous
research (Thomas et al., 2015; Khalaf et al., 2015),
R peaks were located using an annotated file which
makes the techniques semi-automatic. In contrast, in
the approach proposed in this paper, R peaks are
detected automatically based on a parabolic fitting
algorithm. Moreover, a novel adaptive segmentation
technique used in our work reduces the probability
of beat misclassification and the risk of misdiagnosis
due to the interference of adjacent beats which may
occur when a constant beat size was used as in
previous works (Martis et al., 2013a; Elhaj et al.,
2016). As well, the chosen feature extraction
technique has significant role in the accuracy of
diagnosis. By discovering hidden patterns and
extracting distinctive features from the ECG signal,
which are less sensitive to noise, the accuracy of
arrhythmia classification can be improved without
requiring very complicated classifiers. Uniform 1-D
local binary pattern (LBP), used in our work, has the
advantage of less sensitivity to noise and
effectiveness in extracting hidden and salient
information from non-stationary ECG signals and
due to low computational complexity, it can be
employed in real-time applications (Kaya et al.,
2014).
The proposed arrhythmia recognition approach
in this paper is based on beat classification by
adopting the fusion of wavelet transform and
uniform 1-D LBP feature extraction of ECG signal
and extreme learning machine (ELM) classification.
The ECG signal is pre-processed to remove the
unwanted effect of noise. Then, the de-noised signal
Pattern Recognition Application in ECG Arrhythmia Classification
49
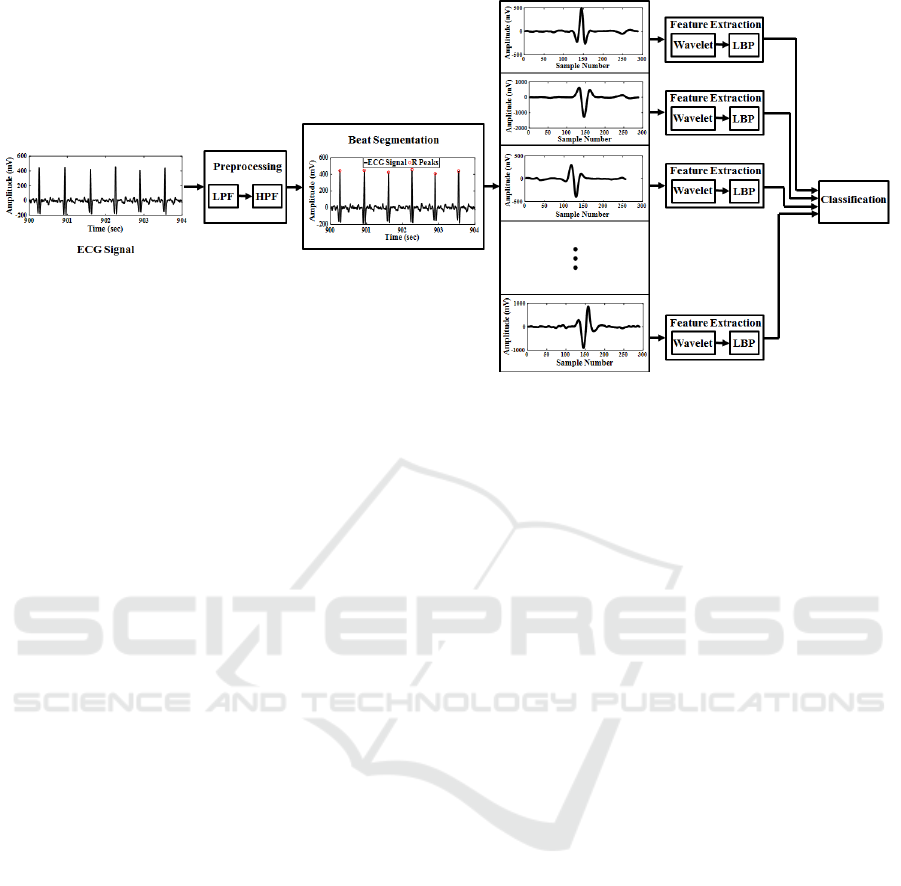
Figure 1: Block diagram of the proposed arrhythmia recognition and classification algorithm.
is divided into heart beats using the proposed
adaptive segmentation technique in this paper, which
is based on the detected R peaks and the median
value of R-R intervals. Each segment of the ECG
signal is transformed into time-frequency space by
applying digital wavelet transform (DWT). Wavelet
coefficients of signal go through a one-dimensional
version of LBP which is a histogram-based signal
descriptor and extracts hidden and distinctive
characteristics of a signal. By transforming the
feature space into histograms, the dimensionality of
the feature space is reduced from the number of
signal samples to the number of histogram bins. In
this paper, we just keep uniform patterns which
contain useful information about the one-
dimensional signal, such as sudden changes, edges,
end of lines and corners. The beat segments are
divided into training and testing sets. The extracted
features of training set are fed to an ELM classifier
for the training procedure. The remaining feature
vectors are used to test the beat classification
algorithm. Figure 1 shows the block diagram of the
proposed algorithm. The rest of paper is organized
as follows: Section 2 describes the adopted ECG
database and Section 3 provides mathematical
details of the pre-processing techniques. Section 4
explains the proposed beat segmentation approach.
Section 5 and 6 discuss feature extraction and
classification techniques and Section 7 provides an
evaluation through experimental results. Finally, the
paper is concluded in Section 8.
2 MATERIALS
In this paper, we consider the ECG signals which are
available online from PhysioNet that offers free web
access to a large-scale dataset of recorded
physiologic signals. The MIT-BIH arrhythmia
database (Moody and Mark, 2001; Goldberger et al.,
2000) is used to evaluate the arrhythmia recognition
and classification technique which has been
proposed in this paper. There are 48 ECG records,
with the length of a little more than 30 minutes, in
the MIT-BIH collection and the sampling frequency
of each ECG signal is 360 Hz. Twenty-three of
recordings were routine clinical ECGs selected from
4000 ambulatory records at Boston’s Beth Israel
Hospital and the remaining 25 ECG signals were
collected from the same set to include other less
common significant arrhythmia types that may not
be represented well in a small randomly selected
group. Each beat in the ECG signal shows one cycle
of electrical activity of the heart. The irregular heart
rhythms are considered as ectopic beats. The entire
MIT-BIH database is grouped into five beat types
based on the ANSI/AAMI EC57:1998 standard
recommendation (Martis et al., 2013a). The five
classes include normal beats (N), fusion beats (F),
supra-ventricular ectopic beats (S), ventricular
ectopic beats (V) and unknown or unreadable beats
(U) as shown in Fig 2. In this paper, we adopted the
entire 48 ECG records in the database including
(90,580) N, (2973) S, (7707) V, (1784) F and (7050)
U beats (110094 beats, totally).
HEALTHINF 2017 - 10th International Conference on Health Informatics
50
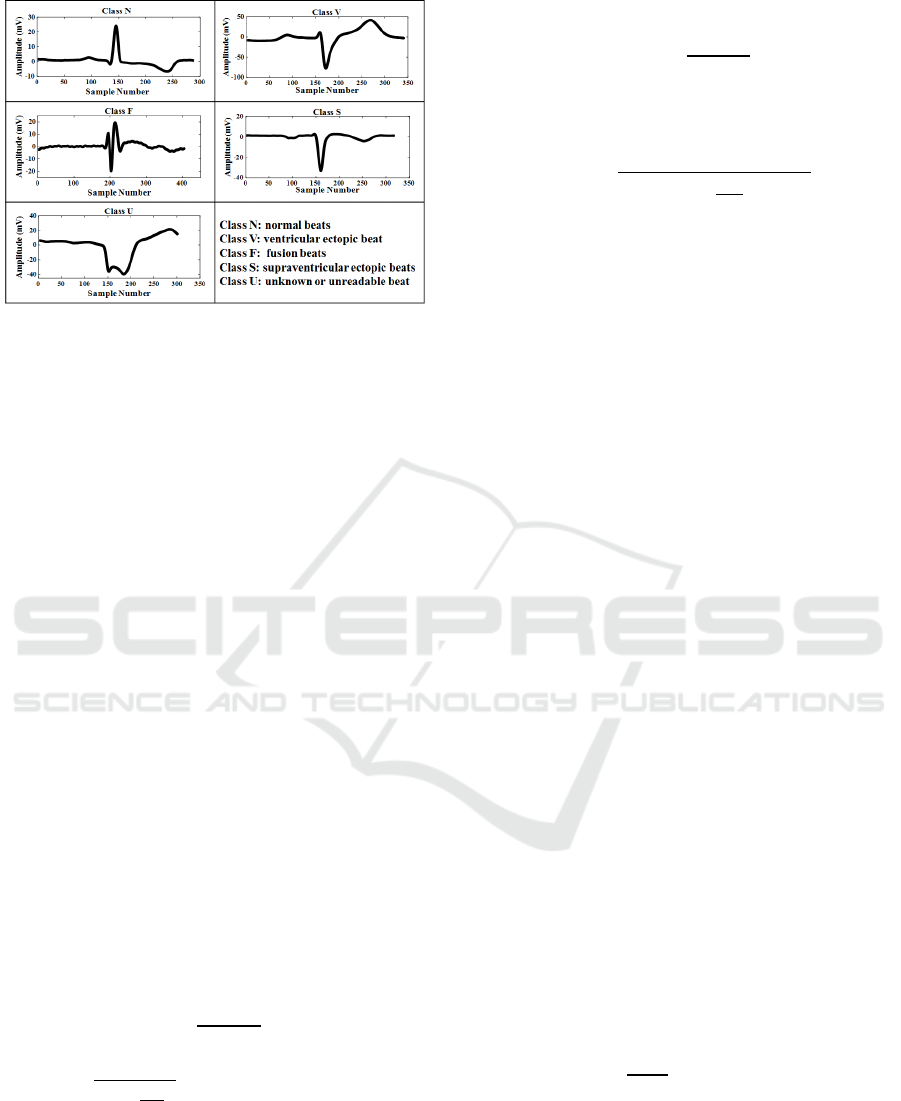
Figure 2: Five categories of ECG beat classes based on the
ANSI/AAMI EC57-1998 standard.
3 PREPROCESSING
The effect of noise on the ECG signal reduces the
accuracy of recognition of arrhythmia in the ECG
records and therefore, the precision of diagnosis of
cardiovascular disease will be decreased. Various
categories of noise are associated with the ECG
signal, such as powerline interference, device noise,
muscle noise, motion noise, contact noise and
quantization noise (Elhaj et al., 2016). In order to
increase the accuracy of disease detection, pre-
processing is required to be applied on the ECG
signal to reduce the effect of noise and improve the
signal to noise ratio. In this paper, we applied a
digital elliptic band-pass filter with passband of 5-15
Hz (maximizes the QRS energy), which is
constructed by cascading a low-pass and high-pass
filters, to remove muscle noise and baseline wander
(Pan and Tompkins, 1985) as follows.
3.1 Low-pass Filter
The adopted low-pass filter has the following
transfer function and amplitude response,
respectively (Pan and Tompkins, 1985).
,
(1)
|
|
3
2
whereTissamplingperio
d
(2)
3.2 High-pass Filter
The transfer function of the high-pass filter is based
on the subtraction of the output of a first-order low-
pass filter from an all-pass filter as follows (Pan and
Tompkins, 1985).
.
(3)
The proposed high-pass filter has the following
amplitude response.
|
|
256
16
.
2
.
(4)
4 BEAT SEGMENTATION
In order to recognize arrhythmia, we had to compute
a beat classification by dividing each ECG signal
into beat segments and classify different types of
beats. The segmentation process consists of R peak
detection and isolation of beats based on the
duration of R-R intervals.
4.1 R Peak Detection
R peaks are the largest deviation of ECG signals
from the baseline. The proposed algorithm for R
peak detection in this work is based on the parabolic
fitting algorithm (Jokic et al., 2011). By adopting
two polynomial functions (PFs) of degree 3, we
modelled the R peak. A signal of length is
defined as follows.
:
1
,
2
,…,
(5)
where
is the
sample of the signal. The
approximation of signal using the polynomial
function of order is denoted by the following
equation.
⋯
,
1,2,…,.
(6)
By minimizing the least square error (the square of
norm of the residual), we can calculate the
coefficients as follows.
‖
‖
,
(7)
0.
(8)
In order to find R peak, a differentiator is first used
to highlight the high inclines of the ECG signal.
Then, the PFs are fitted from the Q peak to the R
peak (through the ascending R leg) and from R peak
to the S peak (through the descending R leg) (Jokic
et al., 2011).
Pattern Recognition Application in ECG Arrhythmia Classification
51

4.2 Segmentation
After detection of the R peaks we need to split ECG
signal into beat segments. The segmentation
technique which is proposed in this paper starts from
each R peak and separates beats by choosing some
samples from the left and right side of the R peak
without inclusion of the former or latter beats. In
previous work in the literature (Thomas et al., 2015;
Elhaj et al., 2016) a constant number of samples are
selected from both signal sides. Therefore, the length
of all beat segments is equal. However, due to the
non-stationary and aperiodic nature of ECG signal,
beat lengths for all of the ECG records are not equal-
sized. Therefore, determining a constant size for all
beats may lead to inclusion of adjacent beats in each
segment. In this paper, in order to reduce the effect
of beat interference, we employ a novel adaptive
segmentation approach. For each ECG record we
calculate the consecutive R-R intervals and find the
median value of R-R durations for each ECG signal
as the adaptive beat duration. Therefore, from each
R peak, we select the number of samples equal to the
half of the beat duration from the left and right sides
of the R peak.
5 FEATURE EXTRACTION
TECHNIQUES
In this section, we describe how we find the
distinctive characteristics of ECG beats to feed to
classification stage for beat recognition. The cascade
combination of wavelet transform and uniform 1-D
LBP is applied on beat segments to extract sudden
variances and sparse hidden patterns from signal.
5.1 Wavelet
Discrete wavelet transform is a viable and powerful
feature extraction technique to analyse ECG signals
locally in multi-resolution manner in time and
frequency domain simultaneously and separate the
signal frequency sub-bands. A signal can be
displayed with different scaling and wavelet basis
functions (Emadi et al., 2012). DWT extracts the
approximation (low frequency components) and
detailed coefficients (high frequency components) as
shown in Fig 3 (
and
are approximation and
detail coefficients and 1,23). A continuous
wavelet transform is generated by a series of
translations and dilations of mother wavelet
.
as
follows (Ródenas et al., 2015).
,
|
|
(9)
where, and are scaling and shift parameters,
respectively. DWT is the sampled version of
continuous wavelet as follows.
,
2
2
.
(10)
The wavelet transform of a signal, of length N,
is the correlation between the wavelet function
,
and signal as shown by the following set of
wavelet coefficients (Ródenas et al., 2015).
,
∑
,
.
(11)
In this paper, we use 8 level wavelet decomposition
and adopt the approximation and detail coefficients
as the extracted features. Therefore, the size of
wavelet features for each beat, depending on the beat
size, is different.
5.2 1-D LBP
Two-dimensional local binary pattern (2-D LBP) is
one of the most successful feature extractors, which
extracts texture features of the 2-D images by
comparing each signal sample (image pixel) with its
neighbour samples in a small neighbourhood. There
is no training requirement which makes the feature
extraction fast and easy to integrate into the new
data sets. Furthermore, due to the application of
Figure 3: Three-level wavelet decomposition.
Figure 4: 2-D LBP for a sample point of a 2-D signal: a)
choosing P neighbours on the neighbourhood of radius R
around a centre sample point, b) comparing signal values
for centre and neighbour points and c) creating the binary
pattern and associated decimal value for the centre sample.
HEALTHINF 2017 - 10th International Conference on Health Informatics
52
histograms as the feature sets, the image-size
dimension of the feature space can be reduced to the
number of histogram bins (Ahonen et al., 2004). is
the radius of the neighbourhood and is the number
of neighbour samples which are compared with the
centre pixel as shown in Fig 4. If the value of the
neighbour sample is greater than or equal to the
centre sample, a 1 is assigned to that neighbour and
if it is less than the centre pixel a 0 is assigned to
that sample. Therefore, we have a -bit binary
pattern for each pixel at
,
location and the
decimal value (DV) associated with the binary
pattern is calculated as follows.
,
.2
,
(12)
1 0
0 0
.
(13)
Decimal values are used to make the histogram for
the 2-D signal. Therefore, the size of feature vector
which is extracted from the 2-D image is equal to
the number of histogram bins (2
). In order to
reduce the size of features and remove redundant
information, we ignore non-uniform patterns due to
the fact that considerable amount of discriminating
information (important local textures such as spots,
line ends, edges and corners) is preserved by taking
only uniform patterns into consideration (Ahonen et
al., 2004). The binary pattern is uniform if there are
at most two bitwise transitions from 0 to 1 or 1 to 0.
Each histogram has 12 bins for uniform
and 1 bin for all non-uniform patterns, in total there
are 13 bins. Therefore, the computational
complexity is also reduced (Nikan and Ahmadi,
2015).
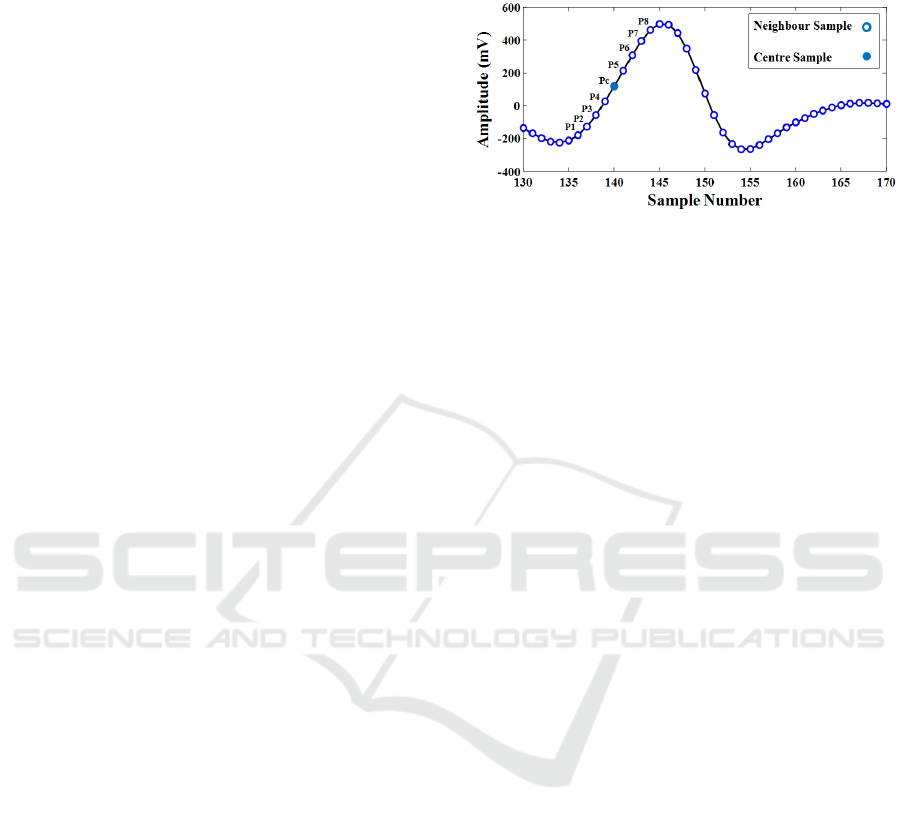
The one-dimensional version of LBP can be adopted
to extract distinctive characteristics from ECG
signals. The same procedure is applied on each
sample point of the signal by comparing P/2
neighbours from right and left side of centre sample
to create the P-bit pattern as shown in Fig 5 (Kaya et
al., 2014). In this paper, the uniform 1-D LBP with
neighbourhood size of 8 points is applied on wavelet
coefficients from the previous section. Therefore, a
histogram of 59 bins (based on the above
formulations 13 8813 59
bins) is created as the feature vector for each beat
segment. This technique not only discovers local
sudden variances and hidden patterns from ECG
signal but also has the advantage of having less
sensitivity to noise, extracting sparser
characteristics, and is computationally effective.
Furthermore, all feature vectors regardless of the
beat size, have equal length of feature sets.
Figure 5: Neighbouring around one sample point of ECG
signal for 1-D LBP feature extraction.
6 CLASSIFICATION
In this section, we describe our approach for training
a classifier to learn the set of arrhythmia classes
from a set of the extracted features from ECG beat
segments. We then use the remaining features for
testing the classifier to predict the class labels of
beat segments; we apply 10-fold cross validation (to
keep consistency with reference works). The feature
set of all ECG beat segments is divided into two
randomly selected subsets for training and
validation, for 10 times, and the classification
approach is applied every time to predict the
arrhythmia class labels for the test set. Each time,
90% of the dataset is devoted to the training subset
and the rest forms the testing subset. The final
accuracy is the average of 10 folds. We employ an
extreme learning machine as the proposed
classification approach. Feed-forward neural
networks are used extensively as classification
strategies in medical pattern recognition applications
due to their capability in approximating the
nonlinear mappings in the data. In order to tune the
weights and biases of the network, traditional
learning mechanisms such as gradient decent
method are employed. However, due to very slow
iterative tuning by a gradient decent technique and
its convergence into local minima, feed-forward
neural networks suffer from slow learning and poor
scalability. Extreme learning machine (ELM), as a
learning algorithm for single hidden layer feed-
forward neural network (FF-NN), is a faster
technique. An ELM classifier is generalized single
hidden layer neural network with random hidden
nodes and determined hidden layer weights without
iterative weight tuning (Huang et al., 2006). For N
distinct training samples, the single hidden layer FF-
Pattern Recognition Application in ECG Arrhythmia Classification
53

NN with N
random hidden neurons, L input and K
output nodes are modelled as follows.
̅
̅
.̅
̅
,
1,2,…, (14)
where, ̅
,
,…,
and
,
,…,
are input and output nodes, . is
the activation function of network,
is threshold of
hidden node and
,
,…,
and
̅
,
,…,
denote the weight vectors
between the
hidden node and the input and
output nodes, respectively. samples can be
approximated to have zero error means such that,
.
̅
(15)
where, (15) can be denoted as follows.
Λ
(16)
where, Λ
̅
,
̅
,…,
̅
and Y
,
,…,
and is the hidden layer matrix,
the
column of which is the output of
hidden
node. It is proven in (Huang et al., 2006) that if .
is infinitely differentiable, then we can assign
random values to the weights and biases and the
required hidden layer nodes is
. Therefore, in
the ELM technique, rather than tuning the weights
and biases iteratively in gradient descent method,
they are randomly assigned in the beginning of
learning. Then, is calculated and output weights
are obtained through the following minimum norm
least squares solution of (16),
Λ
(17)
where,
is the Moore-Penrose generalized inverse
of (Huang et al., 2006).
7 EXPERIMENTAL RESULTS
In order to evaluate the performance of the proposed
algorithm for arrhythmia recognition and
classification, cross validation is applied on the
entire MIT-BIH arrhythmia database (110094 beat
segments). Sensitivity and precision of classification
of each beat type are calculated using true positive
(), false positive () and false negative () as
follows and shown in Table 1.
%
100,
(18)
%
100.
(19)
Table 2 shows the total accuracy of the proposed
arrhythmia classification approach compared to the
previous works in the literature, using the following
equation.
%
100
(20)
where, is the true negative value of the
classification. As shown in Table 2, our proposed
method outperforms other reference techniques in
the accuracy of beat classification. In the presented
work, we adopted the same dataset as what was
employed in the studies that are used for
comparison, except for the work in (Khalaf et al.,
2015), were only 30 ECG recordings were adopted
which is much smaller than the 48 recordings in our
study.
Our proposed algorithm is fully automatic,
compared to the semi-automatic techniques in
(Thomas et al., 2015; Khalaf et al., 2015). Based on
Table 1: Sensitivity and Precision of the proposed
algorithm for classifying each beat type.
Precision % Sensitivity % Beat Class
98.50 97.86
N
98.63 96.20
V
96.35 92.73
F
94.06 90.50
S
82.36 78.66
U
Table 2: Comparison of the accuracy of different
algorithms for arrhythmia classification.
Total Accuracy % Method
94.64
DTCWT+Morphological-ANN
(Thomas et al., 2015)
98.91
PDHI-SVM/RBF (Elhaj et al.,
2016)
98.60
SC-SVM (Khalaf et al., 2015)
98.78
DWT+PCA-NN (Martis et al.,
2013a)
98.99
Proposed algorithm
HEALTHINF 2017 - 10th International Conference on Health Informatics
54

the results in Table 2, the classification accuracies in
(Martis et al., 2013a) and (Elhaj et al., 2016) are
very close to the result of our proposed approach.
However, the proposed adaptive segmentation
method in this paper reduces the interference of
adjacent beats, which is caused by using fixed beat
size as in (Martis et al., 2013a) and (Elhaj et al.,
2016). Our proposed technique outperforms those
approaches by 232 and 89 less misclassifications,
respectively.
8 CONCLUSIONS
The proposed arrhythmia classification approach
introduces a novel adaptive beat segmentation
method based on the median value of the R-R
intervals which reduces the misclassification due to
the inclusion of adjacent beats in each segment.
Moreover, applying uniform 1-D LBP on the
wavelet coefficients not only reduces the
dimensionality of feature space to 59 bins, which
makes the proposed algorithm computationally
effective, but also extracts local sudden variances
and sparser hidden patterns from the ECG signal and
has the advantage of having less sensitivity to noise.
ELM classification leads to 98.99% accuracy of beat
classification of ECG records in the MIT-BIH
arrhythmia database, based on the ANSI/AAMI
EC57:1998 standard recommendation, which
outperforms the performance of the state of the art
arrhythmia recognition algorithms in the literature.
These types of algorithms create opportunities for
automatic methods that can be applied to ECG
readings to help cardiologists assess the risk of
arrhythmias that may result in sudden cardiac death.
This, given the shortage of cardiologists, can
enhance our ability to screen people at risk.
REFERENCES
Ahonen, T., Hadid, A., & Pietikainen, M. (2004, May).
Face recognition with local binary patterns. in
Proceedings of 8th European Conference on
Computer Vision (ECCV), Prague, 469-481.
Ebrahimzadeh, A., & Khazaee, A. (2009). An efficient
technique for classification of electro-cardiogram
signals. Advances in Electrical and Computer
Engineering, 9(3), 89-93.
Elhaj, F. A., Salim, N., Harris, A. R., Swee. T. T., &
Ahmed, T. (2016). Arrhythmia recognition and
classification using combined linear and nonlinear
features of ECG signals. Computer Methods and
Programs in Biomedicine, 127, 52-63.
Emadi, M., Khalid, M., Yusof, R., & Navabifar, F. (2012).
Illumination normalization using 2D wavelet.
Procedia Engineering, 41, 854-859.
Goldberger, A. L., Amaral, L. A., Glass, L., Hausdorff, J.
M., Ivanov, P. C., Mark, R. G., …, Stanley, H. E.
(2000). PhysioBank, PhysioToolkit and PhysioNet:
components of a new research resource for complex
physiologic signals. Circulation, 101(23), E215-E220.
Huang, G. B., Zhu, Q. Y., & Siew, C. K. (2006). Extreme
learning machine: theory and applications.
Neurocomputing, 70(1-3), 489-501.
Inan, O. T., Giovangrandi, L., & Kovacs, G. T. (2006).
Robust neural network based classification of
premature ventricular contraction using wavelet
transform and timing interval feature. IEEE
Transactions on Biomedical Engineering, 53(12),
2507-2515.
Jokic, S., Delic, V., Peric, Z., Krco, S., & Sakac, D.
(2011). Efficient ECG modeling using polynomial
functions. Electronics and Electrical Engineering,
4(110), 121-124.
Kadambe, S., & Srinivasan, P. (2006). Adaptive wavelets
for signal classification and compression.
International Journal of Electronics and
Communications, 60(1), 45-55.
Kaya, Y., Uyar, M., Tekin, R., & Yıldırım, S. (2014). 1D-
local binary pattern based feature extraction for
classification of epileptic EEG signals. Applied
Mathematics and Computation, 243, 209-219.
Khalaf, A. F., Owis, M. I., & Yassine, I. A. (2015). A
novel technique for cardiac arrhythmia classification
using spectral correlation and support vector
machines. Expert Systems with Applications, 42(21),
8361-8368.
Khoshnoud, S., & Ebrahimnezhad, H. (2013).
Classification of arrhythmias using linear predictive
coefficients and probabilistic neural network. Applied
Medical Informatics, 33(3), 55-62.
Korurek, M., & Dogan, B. (2010). ECG beat classification
using particle swarm optimization and radial basis
function neural network. Expert Systems with
Applications, 37(12), 7563-7569.
Martis, R. J., Acharya, U. R., & Min, L. C. (2013a). ECG
beat classification using PCA, LDA, ICA and discrete
wavelet transform.
Biomedical Signal Processing and
Control, 8(5), 437-448.
Martis, R. J., Acharya, U. R., Mandana, K. M., Raya, A.
K., & Chakraborty, C. (2013b). Cardiac decision
making using higher order spectra. Biomedical Signal
Processing and Control, 8(2), 193-203.
Moody, G. B., & Mark, R. G. (2001). The impact of the
MIT-BIH arrhythmia database. IEEE Engineering in
Medicine and Biology Magazine, 20(3), 45-50.
Nikan, S., & Ahmadi, M. (2015). Local gradient-based
illumination invariant face recognition using LPQ and
multi-resolution LBP fusion. IET Image Processing,
9(1), 12-21.
Oster, J., Behar, J., Sayadi, O., Nemati, S., Johnson, A. E.,
& Clifford, G. D. (2015). Semisupervised ECG
ventricular beat classification with novelty detection
Pattern Recognition Application in ECG Arrhythmia Classification
55

based on switching kalman filters. IEEE Transactions
on Biomedical Engineering, 62(9), 2125-2134.
Pan, J., & Tompkins, W. J. (1985). A real-time QRS
detection algorithm. IEEE Transactions on Biomedical
Engineering, BME-32(3), 230-236.
Ródenas, J., García M., Alcaraz, R., & Rieta, J. J. (2015).
Wavelet entropy automatically detects episodes of
atrial fibrillation from single-lead electrocardiograms.
Entropy, 17(9), 6179-6199.
Thomas, M., Das, M. K., & Ari, S. (2015). Automatic
ECG arrhythmia classification using dual tree complex
wavelet based features. International Journal of
Electronics and Communications, 69(4), 715-721.
Yu, S. N., & Chen, Y. H. (2007). Electrocardiogram beat
classification based on wavelet transformation and
probabilistic neural network. Pattern Recognition
Letters, 28(10), 1142-1150.
HEALTHINF 2017 - 10th International Conference on Health Informatics
56
