
Evaluation of the Degree of Malignancy of Lung Nodules in Computed
Tomography Images
L. Gonc¸alves
1
, J. Novo
2
, A. Cunha
1,3
and A. Campilho
1,4
1
INESC TEC - INESC Technology and Science, FEUP Campus, Dr. Roberto Frias, 4200 - 465 Porto, Portugal
2
University of A Coru
˜
na, Department of Computer Science, Campus de Elvi
˜
na, 15071, A Coru
˜
na, Spain
3
University of Tr
´
as-os-Montes and Alto Douro, 5000-801, Vila Real, Portugal
4
Faculty of Engineering of the University of Porto, FEUP Campus, Dr. Roberto Frias, 4200 - 465, Porto, Portugal
Keywords:
Medical Diagnostic Imaging, Computer-aided Diagnosis, Computed Tomography, Machine Learning, Feature
Extraction.
Abstract:
In lung cancer diagnosis, the design of robust Computer Aided Diagnosis (CAD) systems needs to include
an adequate differentiation of benign from malignant nodules. This paper presents a CAD system for the
classification of lung nodules in chest Computed Tomography (CT) scans as the way to diagnose lung cancer.
The proposed method measures a set of 295 heterogeneous characteristics, including morphology, intensity or
texture features, that were used as input of different KNN and SVM classifiers.
The system was modeled and trained using a groundtruth provided by specialists taken from a public lung im-
age dataset, the Lung Image Database Consortium and Image Database Resource Initiative (LIDC-IDRI). This
image dataset includes chest CT scans with lung nodule location together with information about the degree of
malignancy, among other properties, provided by multiple expert clinicians. In particular, the computed degree
of malignancy try to follow the manual labeling by the different radiologists. Promising results were obtained
with a first order SVM with an exponential kernel achieving an area under the receiver operating characteristic
curve of 96.2 ± 0.5% when compared with the groundtruth provided in the public CT lung image dataset.
1 INTRODUCTION
Nowadays, lung cancer is clearly the world’s deadliest
type of cancer and one of the main causes of deaths
in developed countries. In Uniter States, it represents
approximately the 13% of all new cases of cancer and
the 27% of all cancer deaths. It presents an alarm-
ing 5-year relative survival rate of only 18% (Siegel
et al., 2016). As a reference, the number of deaths
regarding lung cancer is greater than the sum of the
second to fourth cancers regarding deceases, that are,
colon, breast and prostate cancers. Among the main
causes of this situation, we can mention the difficulty
in obtaining a good early diagnosis, as the diagnose
is, in most of the cases, difficult due to very small
size and subtlety, and poor contrast of nodules in the
first stages of development. Moreover, it is a com-
plex process demanding from the radiologists an ex-
haustive and tedious revision of Computed Tomog-
raphy (CT) scans (Breadsmoore and Screaton, 2003;
van Ginneken, 2008). This complicates possible pre-
ventive screening programs as happens, for example,
with breast cancer. Given the aggressiveness of this
kind of cancer, the possibility of an early diagnosis
represents a crucial factor for the patient’s survival
rate.
From all the possibilities of medical imaging,
chest CT imaging is one of the most used modali-
ties for lung cancer diagnosis as it presents an ad-
equate quality to identify the presence of lung nod-
ules. Computer-aided Diagnosis (CAD) systems can
play an important role in lung cancer diagnosis as they
can assist and facilitate the tedious, although relevant,
work that have to be performed by the radiologists.
The CAD systems is in general terms organized by 5
different progressive stages. In a first phase, a prepro-
cessing stage can prepare the images for further anal-
ysis, by normalizing the scale or reduce the noise. A
following stage can be an enhancement step to make
more visible some structures, as lung nodules, to ease
the detection phase. Nodule segmentation is the next
step, to accurately define nodule boundaries.
Once the nodule is segmented, an adequate nod-
ule characterization is crucial for analysis and cor-
74
GonÃ
˘
galves L., Novo J., Cunha A. and Campilho A.
Evaluation of the Degree of Malignancy of Lung Nodules in Computed Tomography Images.
DOI: 10.5220/0006116200740080
In Proceedings of the 12th International Joint Conference on Computer Vision, Imaging and Computer Graphics Theory and Applications (VISIGRAPP 2017), pages 74-80
ISBN: 978-989-758-227-1
Copyright
c
2017 by SCITEPRESS – Science and Technology Publications, Lda. All rights reserved
Table 1: Weights for the radiologists classification. 1
st
row, the labels associated to each degree of malignancy. 2
nd
row, p,
the corresponding weight values.
Level of malignancy 1 2 3 4 5
Weight – p 0.15 0.15 0.20 0.25 0.25
responding malignancy differentiation. Measures of
texture, gradient, shape or intensity information (Wu
et al., 2013a; Akram et al., 2015; Liu et al., 2015) are
usually applied in this context. Afterwards, feature
selection can reduce the feature space, removing re-
dundant and irrelevant features. This can be made by
different strategies as, for example, the use of Fisher
criterion and genetic algorithms for this purpose (Liu
et al., 2015). Using this information, different classifi-
cation strategies can be applied to distinguish the nod-
ules regarding its malignancy. Different classifiers as
Support Vector Machines (SVM) or Random Forest
(RF), among others, were also used for this purpose
(Kaya and Can, 2015). The best results in the state-
of-the-art for malignancy nodule classification were
presented by (Wu et al., 2013b) with a receiver oper-
ating characteristic (ROC) curve (AUC value) value
of 91% by comparing the results with diagnosed nod-
ules by either biopsy, follow-up or surgery.
The objective of this work was the development of
a system that discriminate nodules by its malignancy
using as reference annotated delineations of 4 radiol-
ogists.
2 MATERIALS
The dataset has images from the Lung Image
Database Consortium and Image Database Resource
Initiative (LIDC-IDRI) (Armato et al., 2011). The
LIDC-IDRI is a public image dataset that includes
diagnostic and lung cancer screening thoracic Com-
puted Tomography scans with marked up, annotated
lesions. These images contain a variable number of
slices, where each slice has a resolution of 512 ×512
pixels.
Each one of the scans includes annotations pro-
vided by 4 different radiologists, who have assigned
a degree of malignancy in a scale of 1 to 5 where
1 means “Highly Unlikely for Cancer” and 5 means
“Highly Suspicious for Cancer”. The opinions of the
4 radiologists diverge, and this happens quite often.
For that reason, we selected nodules with a clear iden-
tification of the malignancy classification, leaving as
indeterminate others with considerable divergence.
As each nodule has an assigned label from 4 ra-
diologists, we combined the 4 labels by a weighted
average of the individual labels. The estimated com-
bined label of each sample, the degree of malignancy,
M
i
, of each nodule is defined by:
M =
4
∑
k=1
β
k
dm(k) ∴ β
k
= p(k) (1)
where p(k) is the weight value for each radiologist
k and dm(k) is the assigned label m by the radiologist
for the nodule.
Table 1 shows the weights that were used for p and
each corresponding level of malignancy, m. In this
case we employed higher values for higher degrees of
malignancy, labels 4 and 5, as we assign higher rel-
evance that a radiologists classify a nodule as highly
suspicious of being malignant than lowers levels, that
is, unlikely suspicious.
Therefore, a complete set of solid nodules that
were annotated by 4 experienced radiologists were
analyzed and used to construct the dataset. Hence,
in the groundtruth we consider those nodules with a
final score equal or higher to 4, as malignant45 (la-
bels 4 and 5 correspond to significantly suspicious for
cancer), or equal or lower than 2, as malignant12 (un-
likely for cancer). The others are indeterminate.
Finally, the dataset resulted in a total of 177 ma-
lignant45 and 121 malignant12 nodules, in a total of
298 nodules.
3 METHODOLOGY
The process of diagnosis consists of the following
main steps: feature measurement, feature selection,
classification and validation. Once the pulmonary
region of interest is delimited (Novo et al., 2014),
the method takes, as input, the segmented nodules
using an approach that was previously developed
(Gonc¸alves et al., 2016). This approach uses the prin-
ciple of central adaptive medialness previously pro-
posed for lung nodule candidate detection task (Novo
et al., 2015) that also demonstrates its robustness in
nodule segmentation.
Regarding feature measurement, a set of 295
features was defined in order to include a large
and diverse set of features that would be able to
capture malignancy nodule properties. The fea-
ture set includes morphological (volume, compact-
ness or sphericity, among others), intensity (differ-
ent statistics) or texture features (Gray-Level Co-
Evaluation of the Degree of Malignancy of Lung Nodules in Computed Tomography Images
75

Occurrence Matrix (GLCM), Gray-level intensity his-
togram (GLIH) or Gabor filters, among others.
Feature selection was the next step to identify
the main useful characteristics for the classification
avoiding, therefore, irrelevant and redundant features
and facilitating the classification process. Feature se-
lection was applied by 10-fold cross validation us-
ing 2 different algorithms: Correlation Feature Se-
lection (CFS) that analyses the strength of a feature
in predicting the class of the object; this approach
tends to give little importance to the inter-correlation
of the features; and Relief F algorithm, that samples
instances randomly and checks the distance between
them and the neighbours that have the same or dif-
ferent classes. A weight function uses the distances
between the features to rank them (Hall, 1999).
Finally, different classifiers were evaluated using
the selected features. In particular, three SVM classi-
fiers were defined, using an exponential kernel as:
k(x, y) = exp
−
k x − y k
θ
(2)
The SVMs used three values for θ, θ = [1, 2,
3], representing the degree of the exponential kernel.
Three kNN classifiers with k = [13, 15, 17] were also
included. The classification was performed by 10-
fold cross-validation on the second set with 50 rep-
etitions. The mean and standard deviation were cal-
culated from the 50 values of AUC, using the selected
subset of features.
4 RESULTS AND DISCUSSION
We trained and tested the method using the
groundtruth dataset previously defined.
Regarding feature selection, by CFS algorithm,
the features that appeared in more than 80% of the
folds were selected and ranked according to the num-
ber of times they were selected. For the Relief F,
the highest ranked features were chosen until the se-
lected total was equal to the number of features se-
lected by the CFS. The total number of features se-
lected by both methods was 12. The majority of the
features chosen by both methods were texture fea-
tures, though CFS also selected two geometric fea-
tures and Relief F three intensity features. The CFS
selected a great number of GLCM and Laws features.
CFS also included a volume and compactness charac-
teristics, which is coherent as the radiologists tend to
consider compact and round nodules as unlikely for
cancer, or large and irregular nodules as suspicious
for cancer. Relief F selected different features that
pay attention to the center calcification of the nodules,
property used for identifying nodule malignancy.
The main performance classification results are
shown in Table 2 and Table 3. In general terms, the
AUC values for all the classifiers and feature subsets
are satisfactorily high, though there is no considerable
difference between them. Even so, The SVM classi-
fiers provide the best results outperforming all KNN
classifiers, specially with the CFS subset. From all of
them, the lowest value was obtained with the 13-KNN
and CFS with an AUC of 93,2%. On the other hand,
the SVMs results with CFS subset provided very sim-
ilar results so it does not provide a clear conclusion
on which classifier is the best. However, the third de-
gree SVM is slightly better than the others, provid-
ing equivalent AUCs of 96,4% versus an 96,3% and
96,2% from the second and first degree classifiers, re-
spectively.
The classification results can also be checked in
the ROC curves of Figure 1 and Figure 2, where the
previous evaluation comments remain. These ROC
curves were constructed defining progressive thresh-
olds in the a priori probabilities of the classifiers from
0 to 1, with a step of 0.01. Once again, the SVM clas-
sifiers are better than KNN classifiers and their per-
formance is very similar. Although this is true, the
subset from Relief F improves the results of the KNN
and decreases the performance of the SVMs.
Different correct classification examples are
shown in figure 3, with the corresponding degree of
confidence. The degree of confidence is the posterior
probability of a nodule belonging to a particular class
(malignant12 or malignant45), that is, it identifies the
degree of certainty that a classifier has on identifying
a nodule as the corresponding malignant12 or malig-
nant45 class. The left column represents malignant12
nodules and the right column represents the malig-
nant45 ones. In each image the contour of the nodule
is also presented giving a clear idea of their morphol-
ogy, representing the color of the class label (green
for malignant12 or red for malignant45). As observed
in the statistical results, most of the nodules were
satisfactorily classified. We also include examples
of misclassifications in Figure 4. In the case of the
first misclassification (case 72), the nodule presents a
high degree of spiculation and large size, character-
istics that mainly are observed in malignant45 nod-
ules. In the case of the second misclassification (case
283) the small nodule has similar characteristics to
malignant12 ones in terms of shape or size, but other
relevant features are similar to malignant45 nodules
which provokes the final malignant45 labeling.
VISAPP 2017 - International Conference on Computer Vision Theory and Applications
76
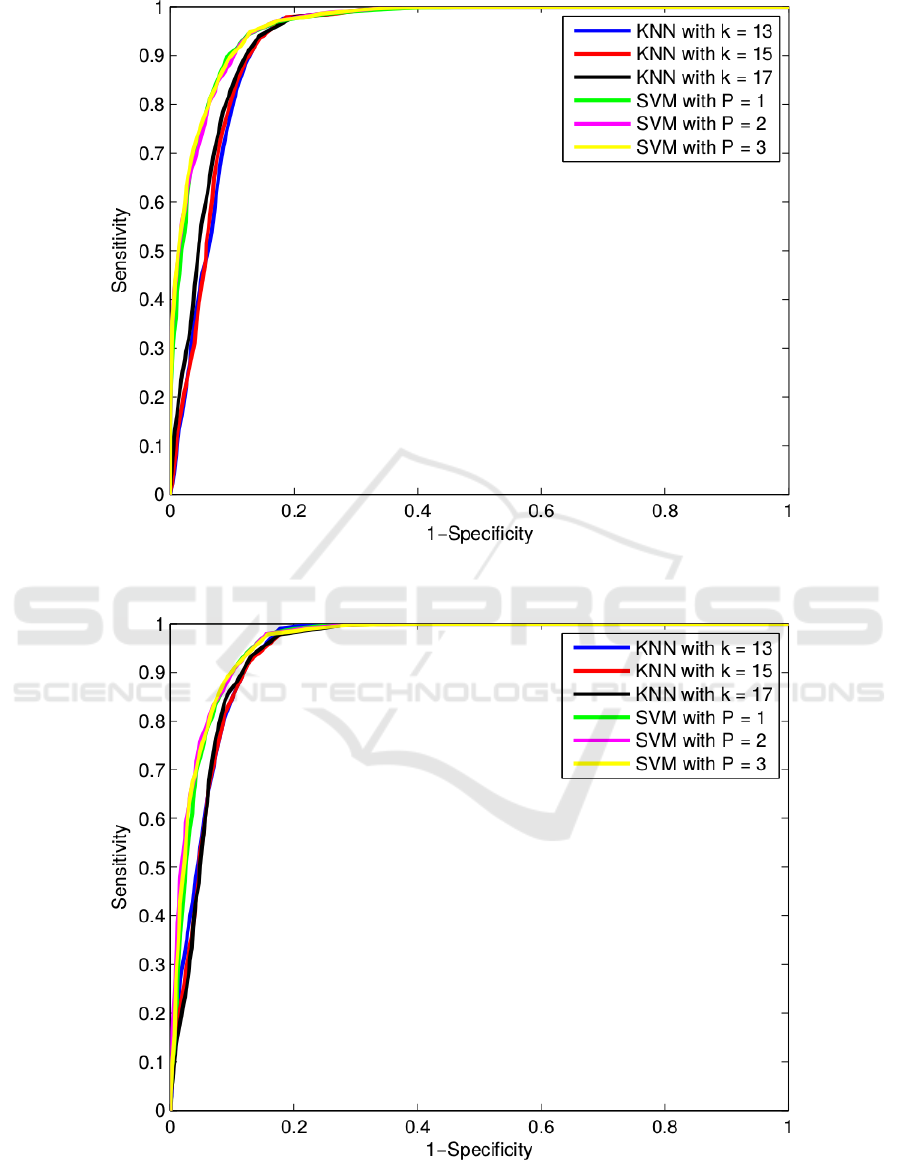
Figure 1: ROC curves of the classification performances of the 6 classifiers and the 12 features selected by CFS algorithm.
Figure 2: ROC curves of the classification performances of the 6 classifiers and the 12 features selected by Relief-F algorithm.
Evaluation of the Degree of Malignancy of Lung Nodules in Computed Tomography Images
77
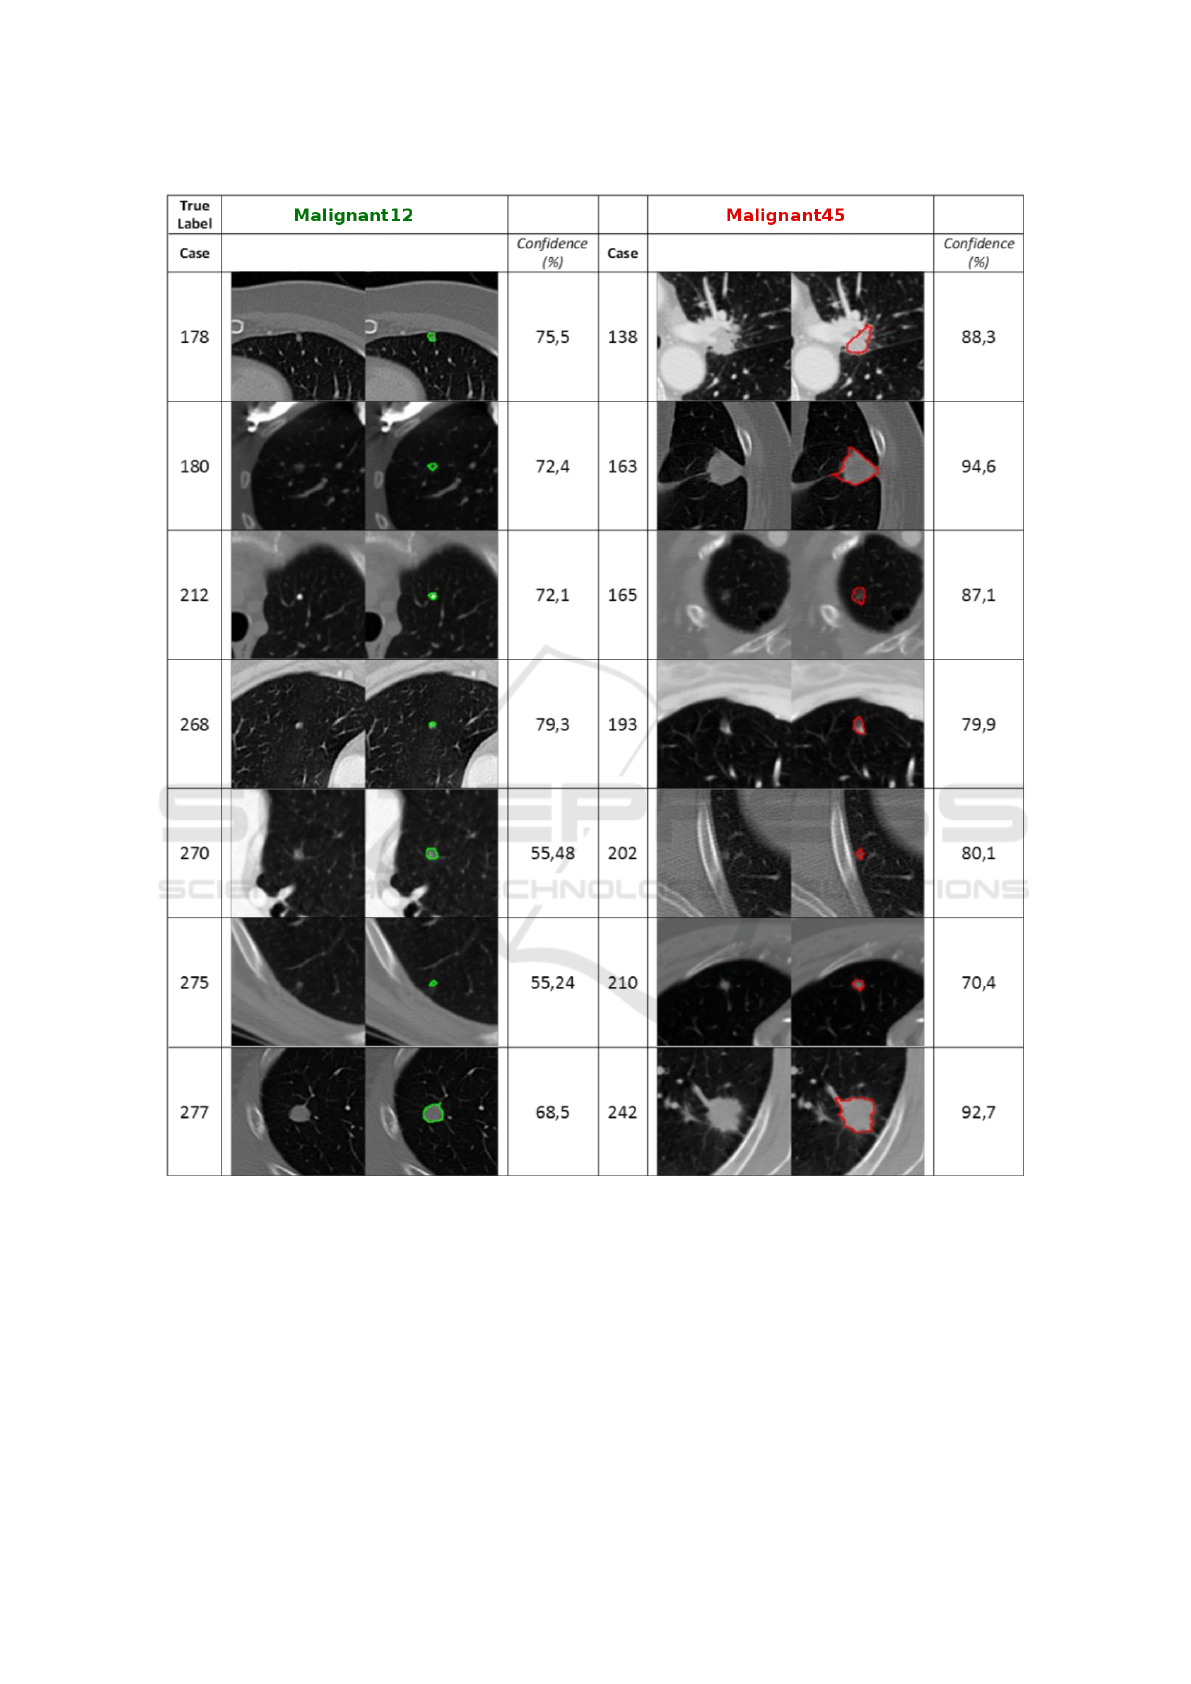
Figure 3: Examples of correct malignant12 (1
st
column) and malignant45 (2
nd
column) nodules class labels. Confidence is
presented as the posterior probability of a nodule belonging to a particular class (malignant12 or malignant45).
5 CONCLUSIONS
This paper presents a system for the diagnosis of lung
cancer by means of lung nodule malignancy classi-
fication in chest CT scans. The system has a set of
295 characteristics, being selected the most represen-
tative ones. Six KNN and SVM classifiers were evalu-
ated. The best performance was achieved by a first or-
der SVM with exponential kernel providing an AUC
value of 96.2 ± 0.5%, which are promising results.
In future work, new features can be included and
wrapper based feature selection methods should be
tested, as better results can be achieved by embedding
the classifiers in the selection process the classifiers.
VISAPP 2017 - International Conference on Computer Vision Theory and Applications
78
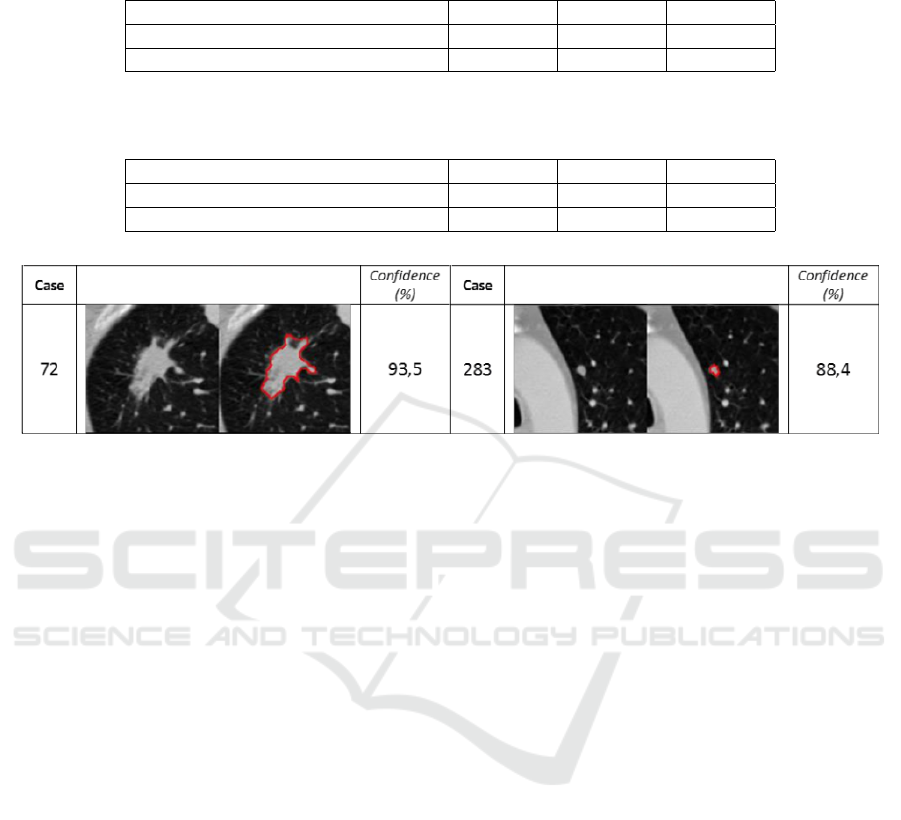
Table 2: Classification results presented as the mean and standard deviation of 50 AUC % values, for 12 features selected by
2 model searches and 3 KNNs.
Area under curve, AUC (%) 13-KNN 15-KNN 17-KNN
Correlation Feature Selection, CFS 93.2 ± 0.8 93.5 ± 0.9 94.1 ± 0.7
Relief F 94.7 ± 0.7 94.4 ± 0.8 94.4 ± 0.7
Table 3: Classification results presented as the mean and standard deviation of 50 AUC % values, for 12 features selected by
2 model searches and 3 SVMs.
Area under curve, AUC (%) 1-SVM 2-SVM 3-SVM
Correlation Feature Selection, CFS 96.2 ± 0.5 96.3 ± 0.6 96.4 ± 0.5
Relief F 96.0 ± 0.6 96.3 ± 0.6 96.2 ± 0.6
Figure 4: Examples of incorrect malignant12 (1
st
column) and malignant45 (2
nd
column) nodules class labels. Confidence is
presented as the posterior probability of a nodule belonging to a particular class (malignant12 or malignant45).
Also, other classifiers like neural networks should be
implemented for classification comparison.
ACKNOWLEDGEMENTS
This work is financed by the ERDF – European Re-
gional Development Fund through the Operational
Programme for Competitiveness and Internationalisa-
tion – COMPETE 2020 Programme, and by National
Funds through the Portuguese funding agency, FCT
– Fundac¸
˜
ao para a Ci
ˆ
encia e a Tecnologia, within
the project with code POCI-01-0145-FEDER-016673
and the grant contract SFRH/BPD/85663/2012 (J.
Novo).
REFERENCES
Akram, S., Javed, M., Hussain, A., Riaz, F., and Akram, M.
(2015). Intensity-based statistical features for classifi-
cation of lungs ct scan nodules using artificial intelli-
gence techniques. Journal of Experimental and Theo-
retical Artificial Intelligence, 27:737–751.
Armato, S., McLennan, G., Bidaut, L., McNitt-Gray, M.,
Meyer, C., Reeves, A., Zhao, B., Aberle, D., Hen-
schke, C., Hoffman, E., Kazerooni, E., MacMahon,
H., Beeke, E. V., Yankelevitz, D., Biancardi, A.,
Bland, P., Brown, M., Engelmann, R., Laderach, G.,
Max, D., Pais, R., Qing, D., Roberts, R., Smith, A.,
Starkey, A., Batrah, P., Caligiuri, P., Farooqi, A.,
Gladish, G., Jude, C., Munden, R., Petkovska, I.,
Quint, L., Schwartz, L., Sundaram, B., Dodd, L., Fen-
imore, C., Gur, D., Petrick, N., Freymann, J., Kirby,
J., Hughes, B., Casteele, A., Gupte, S., Sallamm, M.,
Heath, M., Kuhn, M., Dharaiya, E., Burns, R., Fryd,
D., Salganicoff, M., Anand, V., Shreter, U., Vastagh,
S., and Croft, B. (2011). The lung image database
consortium (LIDC) and image database resource ini-
tiative (IDRI): a completed reference database of lung
nodules on CT scans. Medical Physics, 38:915–931.
Breadsmoore, C. J. and Screaton, N. J. (2003). Classifica-
tion, staging and prognosis of lung cancer. European
Journal of Radiology, 45:8–17.
Gonc¸alves, L., Novo, J., and Campilho, A. (2016). Hessian
based approaches for 3D lung nodule segmentation.
Expert Systems with Applications, 61:1–15.
Hall, M. A. (1999). Correlation-based feature selection
for machine learning. PhD thesis, The University of
Waikato.
Kaya, A. and Can, A. (2015). A weighted rule based method
for predicting malignancy of pulmonary nodules by
nodule characteristics. Journal of Biomedical Infor-
matics, 56:69–79.
Liu, X., Ma, L., Song, L., Zhao, Y., Zhao, X., and Zhou,
C. (2015). Recognizing common ct imaging signs of
lung diseases through a new feature selection method
based on fisher criterion and genetic optimization.
IEEE Journal of Biomedical and Health Informatics,
19:635–647.
Novo, J., Gonc¸alves, L., Mendonc¸a, A., and Campilho, A.
(2015). 3D lung nodule candidates detection in mul-
Evaluation of the Degree of Malignancy of Lung Nodules in Computed Tomography Images
79

tiple scales. IAPR International Conference on Ma-
chine Vision Applications, MVA 2015, pages 5–8.
Novo, J., Rouco, J., Mendonc¸a, A., and Campilho, A.
(2014). Reliable lung segmentation methodology by
including juxtapleural nodules. International Confer-
ence on Image Analysis and Recognition, ICIAR 2014.
Lecture Notes in Computer Science: Image Analysis
and Recognition, 8815:227–235.
Siegel, R. L., , Miller, K. D., and Jemal, A. (2016). Cancer
statistics, 2016. CA: A Cancer Journal for Clinicians,
66:7–30.
van Ginneken, B. (2008). Computer-aided diagnosis in tho-
racic computed tomography. Imaging Decisions MRI,
12:11–22.
Wu, H., Sun, T., Wang, J., Li, X., Wang, W., Huo, D., Lv,
P., He, W., Wang, K., and Guo, X. (2013a). Combina-
tion of radiological and gray level co-occurrence ma-
trix textural features used to distinguish solitary pul-
monary nodules by computed tomography. Society for
Imaging Informatics in Medicine, 26:797–802.
Wu, H., Sun, T., Wang, J., Li, X., Wang, W., Huo, D., Lv,
P., He, W., Wang, K., and Guo, X. (2013b). Combina-
tion of radiological and gray level co-occurrence ma-
trix textural features used to distinguish solitary pul-
monary nodules by computed tomography. Society for
Imaging Informatics in Medicine, 26:797–802.
VISAPP 2017 - International Conference on Computer Vision Theory and Applications
80
