
Segmentation of Retinal Ganglion Cells From Fluorescent Microscopy
Imaging
Silvia Baglietto
1,2
, Ibolya E. Kepiro
3
, Gerrit Hilgen
4
, Evelyne Sernagor
4
, Vittorio Murino
1,5
and Diego Sona
1,6
1
Pattern Analysis and Computer Vision, Istituto Italiano di Tecnologia, Genova, Italy
2
Department of Naval, Electric, Electronic and Telecommunication Engineering, University of Genova, Genova, Italy
3
Nanophysics, Istituto Italiano di Tecnologia, Genova, Italy
4
Institute of Neuroscience, Newcastle, Newcastle-upon-Tyne, U.K.
5
Department of Computer Science, University of Verona, Verona, Italy
6
NeuroInformatics Laboratory, Fondazione Bruno Kessler, Trento, Italy
Keywords:
Cell Segmentation, Active Contour, Multiscale Blob Filtering, Retinal Ganglion Cell.
Abstract:
The visual information processing starts in the retina. The working mechanisms of its complex stratified
circuits, in which ganglion cells play a central role, is still largely unknown. Understanding the visual coding
is a challenging and active research area also requiring automated analysis of retinal images. It demands
appropriate algorithms and methods for studying a network population of strictly entangled cells. Within this
framework, we propose a combined technique for segmenting retinal ganglion cell (RGC) bodies, the output
elements of the retina. The method incorporates a blob enhancement filtering in order to select the specific
cell shapes, an active contour process for precise border segmentation and a watershed transform step which
separates single cell contours in possible grouped segmentations. The proposed approach has been validated
on fluorescent microscopy images of mouse retinas with promising results.
1 INTRODUCTION
The retina is a photosensitive membranous tissue
lying at the back of the eye. Its role is to process
the light stimuli and to transmit the information to
the brain through the optic nerve. Although it is of-
ten compared to a photographic film on which the
images are imprinted and encoded into electrical sig-
nals with a columnar processing, the retina has a very
complex function and structure, composed of several
layers of cells in a tangled network (Gregory, 2015):
photoreceptors feed into bipolar and amacrine cells,
which pass the input to an assorted set of retinal gan-
glion cells (RGCs). Recent studies show that retina
performs sophisticated non-linear computation, ex-
tracting spatio-temporal visual features with high se-
lectivity. This is reflected by the fact that distinct
RGC types have been found to encode specific visual
features for transmission to the brain (Neumann et al.,
2016).
According to the current knowledge, there is a cor-
relation between RGC morphology and function and
this is usually studied at the single cell level (Ber-
son et al., 2010). Recently, an intense debate is ri-
sing around the importance of studying the retina at
the circuit level and the actual challenge is to tackle
the problem at a different scale, analyzing populati-
ons of neurons at a network level (Roska et al., 2006),
(Kim et al., 2010). Several studies are trying to mo-
del responses of RGC populations heading to a bet-
ter understanding of the role of RGCs (Baden et al.,
2016). To support neuroscientists in this study, auto-
mated tools for the large-scale segmentation of RGC
bodies are required.
In this work we propose an automatic algorithm
for cell segmentation from fluorescent images recor-
ded with a confocal microscope. This process would
allow the characterization of different RGC types dis-
tinguished by different soma morphologies at the po-
pulation level, inspiring studies addressing the corre-
lation between soma morphology and functional be-
havior.
Such datasets are complex for many reasons. They
are affected by low contrast at the cell boundaries,
Baglietto S., Kepiro I., Hilgen G., Sernagor E., Murino V. and Sona D.
Segmentation of Retinal Ganglion Cells From Fluorescent Microscopy Imaging.
DOI: 10.5220/0006110300170023
In Proceedings of the 10th International Joint Conference on Biomedical Engineering Systems and Technologies (BIOSTEC 2017), pages 17-23
ISBN: 978-989-758-215-8
Copyright
c
2017 by SCITEPRESS – Science and Technology Publications, Lda. All rights reserved
17
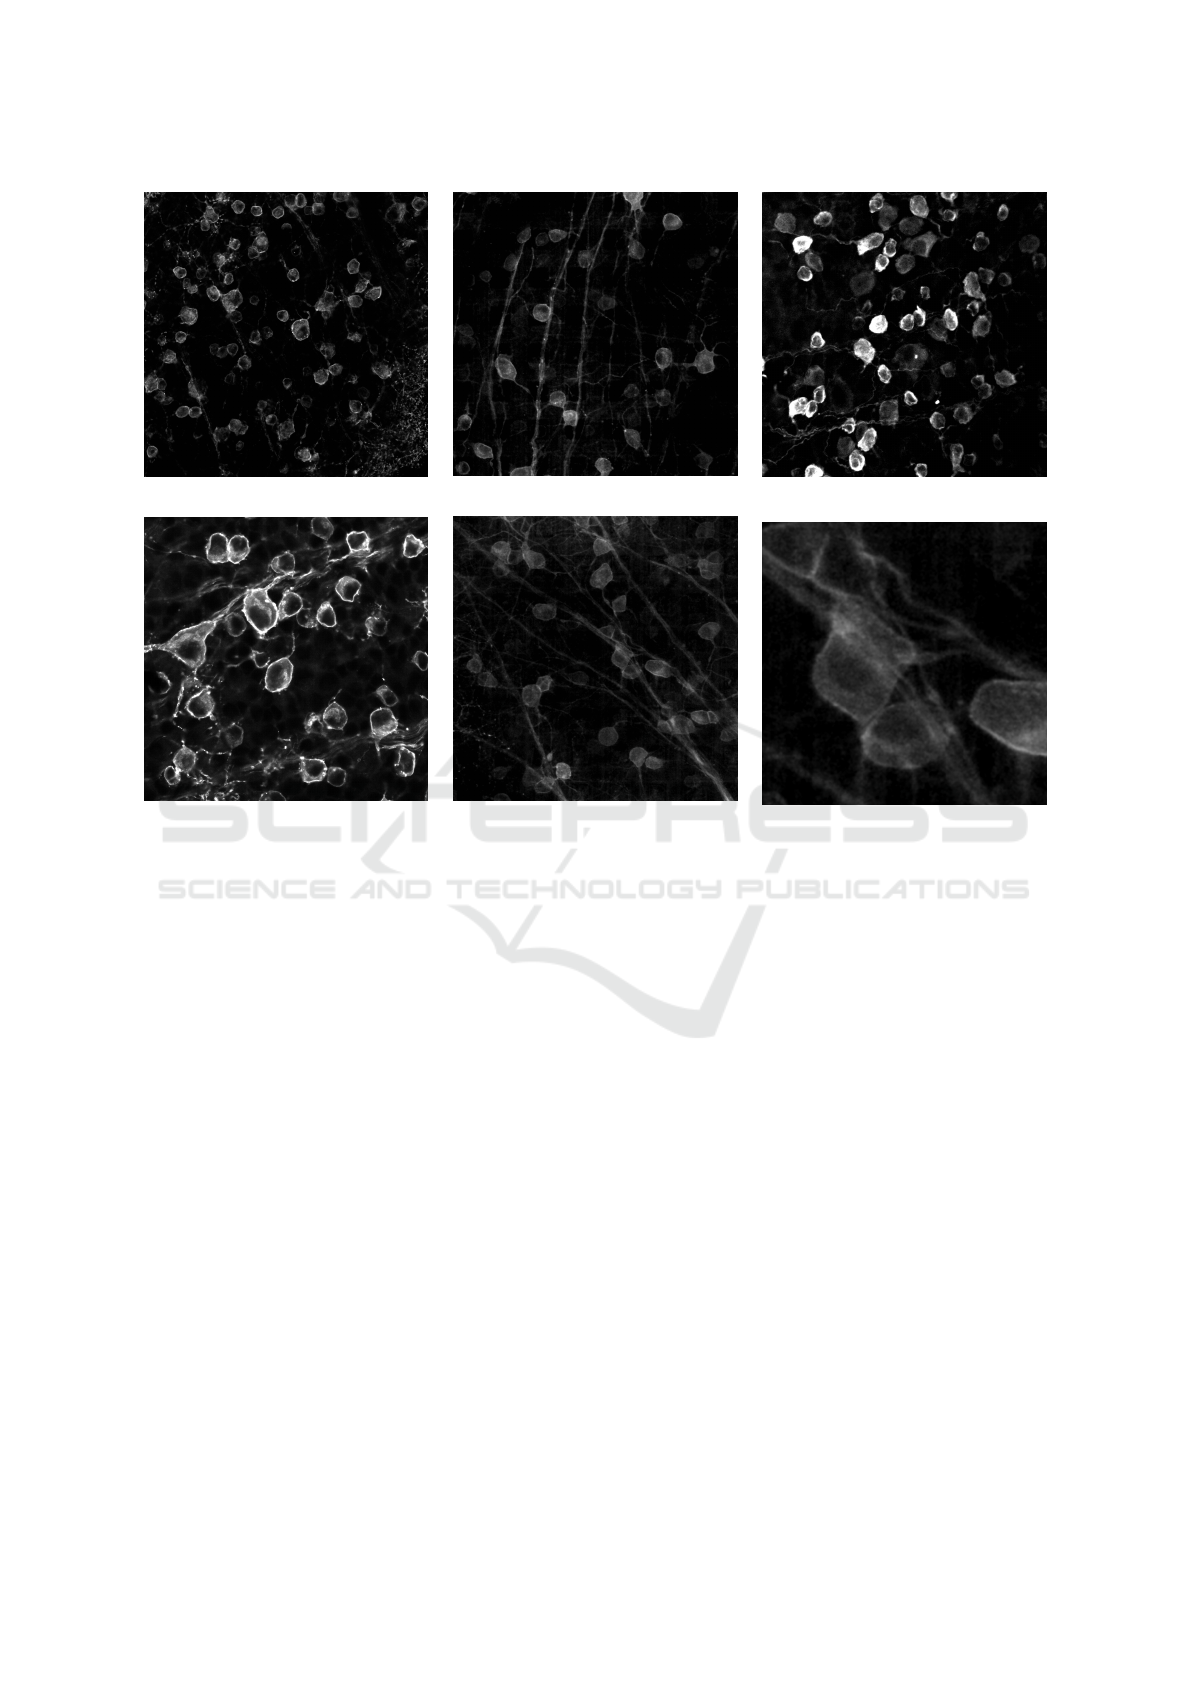
Im1 (PV-EYFP)
Im2 (Thy1-EYFP)
Im3 (Calretinin)
Im4 (Calretinin)
Im5 (Thy1-EYFP)
Detail of Im5
Figure 1: 5 different images containing RGCs used for testing the proposed method. The images show high variability
across samples. In the bottom right, there is a magnified crop of Im5, showing the complexity of images, where the analyzed
structures are mixed with background and other structures.
high cell density and shape deformations, occlusions
among neurons and the presence of a large mass of ot-
her structures such as dendrites and axons on the same
channel. Indeed, the fluorescence in retinal mice ima-
ges, as shown in Fig.1, is expressed by the whole cell
including processes (i.e. dendrites and axons) and it
is non-uniform leading to fragmented appearance of
the objects and to unreliable separation between so-
mas, dendrites and axons. Last but not least, there is a
high variability of samples condition across different
acquisitions.
This global setting introduces to new challenging
computational tasks for image segmentation. Indeed,
state-of-the-art methods usually work on single neu-
ron reconstruction (Gulyanon et al., 2016) and can
hardly be adequate for separating neurons from the
background. The automated segmentation is still a
critical open problem. On the other hand, the ma-
nual interaction to generate the morphological recon-
struction is time consuming and expensive. Tradi-
tional segmentation approaches which use only ba-
sic techniques, such as morphological operators and
thresholding, are not powerful enough and lead to
wrong segmentations (Meijering, 2012). Learning ap-
proaches, such as (Arteta et al., 2013) and (Zhang
et al., 2014), require hand-labelled neurons for trai-
ning and testing. In addition, they cannot manage to
extract the precise segmentation of cells because of
the difficulties dealing with the high variance in cell
appearance. In contrast, active contour methods have
demonstrated good performance in image segmenta-
tion dealing with challenging data (Chan et al., 2001),
(Yezzi et al., 2002). Their main limitation is rela-
ted to the strong sensitivity to the model initialization,
which usually requires variable degrees of user inter-
vention. To this end, recent years have witnessed the
spread of active contour models in different formu-
lations, aiming at hybrid approaches for automating
the initialization process (Ge et al., 2015), (Wu et al.,
2015).
Within this scenario, we designed a method based
on active contour initialized on specific ROIs, which
are automatically identified by a multiscale blob filter
emphasizing only cell bodies. Several shape-based
BIOIMAGING 2017 - 4th International Conference on Bioimaging
18

enhancement filters have been introduced in litera-
ture. Frangi filter has been reported to be one of
the most effective vessel enhancement filter (Frangi
et al., 1998). In light of that, we introduced a no-
vel multiscale blob filtering method derived from the
Frangi filter for the enhancement of neuron somata.
Cell bodies are then segmented by a localizing region-
based active contour algorithm (Lankton and Tannen-
baum, 2008) followed by a watershed-based step to
split groups of neurons and to separate cells from den-
drites and axons.
The remainder of the paper is organized as fol-
lows. In Sec.2 details on the adopted retinal images
are provided. We present the pipeline of our method
in Sec.3. In Sec.4 results are discussed and conclusi-
ons are provided in Sec.5.
2 MATERIALS
Mouse retinal samples were imaged using Leica SP5
upright confocal microscope. Images were acquired
at (sub)cellular resolution and at high averaging num-
ber to reduce the noise level due to limited light pe-
netration in deep layers of the tissue where RGCs
are located. A total of 5 images (2048 × 2048 and
1024 × 1024 pixels), containing some hundreds of
cells, were selected from 3 different retina samples
including: i) three images coming from samples with
genetic fluorescence expression, (i.e., Im1 from PV-
EYFP and Im2 and Im5 images from Thy1-EYFP
mouse), and ii) two images from samples with immu-
nofluorescence staining using the Calretinin calcium-
binding protein (Im3 and Im4) (Fig.1-2). The samples
were selected in order to best capture the variability
in terms of fluorescence expression, cell and axonal
bundle density and background.
3 METHOD
There are mainly three steps in our pipeline as shown
in Fig.2: Multiscale Blob enhancement filtering (Fig
2.b), Localizing Region-Based Active Contour (Fig
2.c) and Watershed Transform (Fig 2.d).
The blob enhancement filtering is used to initia-
lize the high performance active contour method, he-
avily dependent on the initialization mask. Thanks
to this filter, the processing pipeline can proceed wit-
hout user intervention and manual adjustment. Af-
ter blob filtering, the detected blob-shaped objects are
binarized and used as initialization ROIs for a loca-
lizing region-based active-contour that segments cell
borders. In the most challenging images, the active
contour can result in cell clusters due to fuzzy cell
boundaries and occlusions. In order to overcome this
issue, we use the watershed transform.
3.1 Multiscale Blob Enhancement
Filtering
The aim of blob enhancement is to improve the in-
tensity profile of RGC bodies and reduce the contri-
bution of dendritic and axonal structures. It is based
on the multiscale analysis of the eigenvalues of the
Hessian matrix to determine the local likelihood that
a pixel belongs to a cell, i.e. to a blob structure. The
proposed approach is inspired by the work of Frangi
et al. (Frangi et al., 1998) on multiscale vessel en-
hancement filtering. The Frangi filter essentially de-
pends on the orientational difference or anisotropic
distribution of the second-order derivatives to deline-
ate tubular and filament-like structures. We start from
this idea and modify the filtering process (in particular
equation (15) in (Frangi et al., 1998)) in order to have
a reduction of line-like patterns in favor of blob-like
structures (as (Liu et al., 2010)). Instead of a vessel-
ness measure, we define a blobness measure as fol-
lows:
B(x
o
) =
0, if λ
x
o
1
< 0
e
1
2β
2
·
λ
x
o
2
λ
x
o
1
2
, otherwise
(1)
where λ
x
o
1
and λ
x
o
2
are the eigenvalues of the Hessian
matrix at point x
o
and β is a threshold which con-
trols the sensitivity of the blob filter. Both β and
the Hessian scale have been selected in the range of
the average neuron radius. Eq.(1) is given for bright
structures over dark background. In case of dark ob-
jects conditions should be reversed.
3.2 Localizing Region-based Active
Contour
Localizing region-based active contour (Lankton and
Tannenbaum, 2008) is an improved version of traditi-
onal active contour models (Chan et al., 2001), (Yezzi
et al., 2002) where objects characterized by heteroge-
neous statistics can be successfully segmented thanks
to localized energies, differently from the correspon-
ding global ones which would fail. This framework
allows to remove the assumption that foreground and
background regions are distinguishable based on their
global statistics. Indeed the working hypothesis is
that interior and exterior regions of objects are lo-
cally different. Within this framework, the energies
Segmentation of Retinal Ganglion Cells From Fluorescent Microscopy Imaging
19
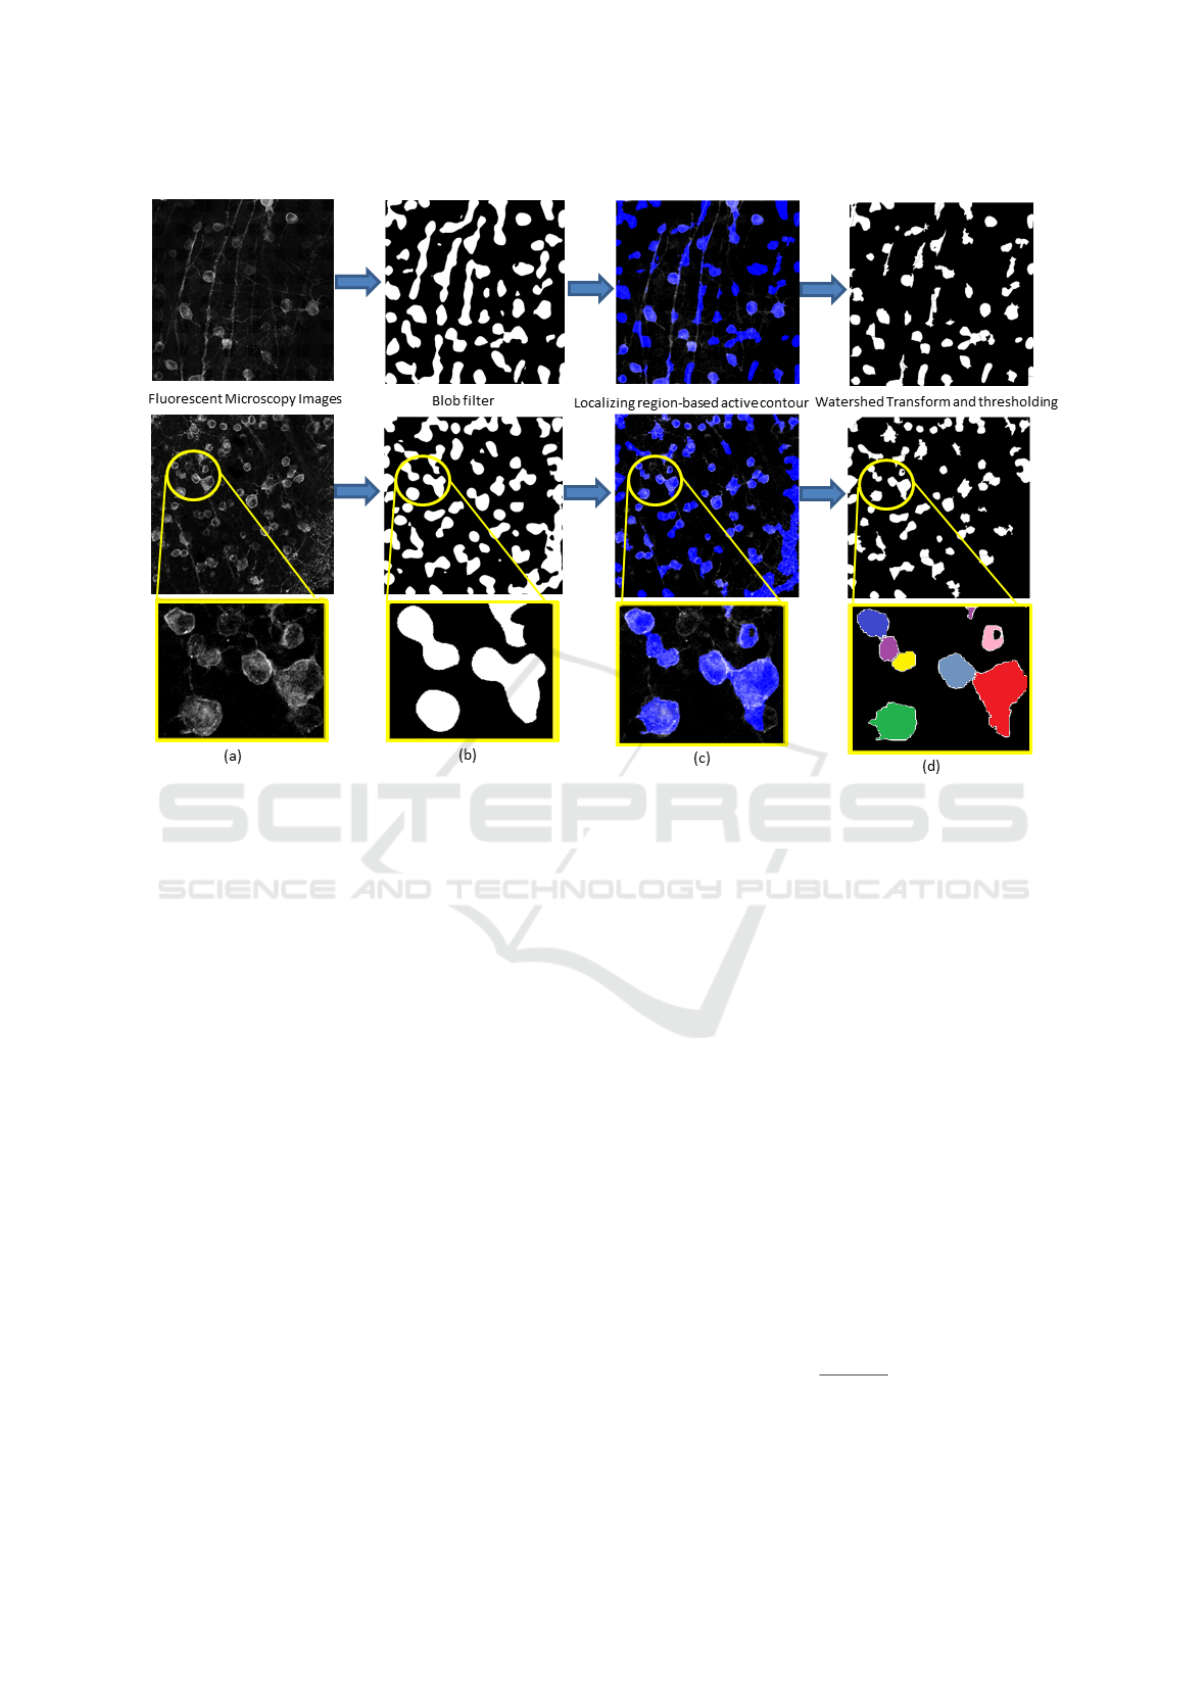
Figure 2: Pipeline applied to two examples (from the top, Im2 (Thy1-EYFP) and Im1 (PV-EYFP)) with a crop in the bottom
line, showing a problem due to contiguous cells. In column, (a): Original Fluorescent Microscopy Images; (b) Results of the
blob filter binarization; (c) Results of the active contour segmentation in blue transparency over the original image for getting
the suitable qualitative performance; (d) Results of the watershed transform and of the final threshold.
are constructed locally at each point along the curve
in order to allow the analysis of local regions. The
choice of the localization radius is driven by the size
of the object to be segmented. In our case, for each
image, we used a radius equal to the average soma
radius, which depends on the image size and on the
microscope lens.
Thanks to this efficient technique, we obtain a seg-
mentation mask which tightly fits real cell bodies.
3.3 Watershed Transform and Size
Filter
The above active contour fails to separate groups of
overlapping or contiguous cells, hence we exploit the
simplicity and computational speed of the waters-
hed transform, introduced by Beucher and Lantu
´
ejoul
(Beucher and Lantu
´
ejoul, 1979).
As a final step, we need to delete components
which are too small or too large for being cell so-
mata (a given example is in Fig.2.c (middle figure)
by applying a size filter to remove structures with size
outside an acceptable range of somata dimensions.
4 RESULTS AND DISCUSSION
We applied our pipeline to 5 different retinal ima-
ges representative of possible variations on the retinal
samples, such as brightness, intensity, size and num-
ber of cells, presence of axonal structures and pro-
cesses, strong background signals, etc. We generated
the ground truth manually segmenting all cells in each
image (around 280 cells). To give a qualitative evalu-
ation, we report different examples in Fig.2-3 where
it is possible to see that our approach works in diffe-
rent sample conditions. To quantify the performance
of our method, we adopt the Dice Coefficient (DC),
a widely used metric for comparing the ground truth
to the computer-aided segmentation. DC is defined as
follows:
DC =
2(A ∩ B)
(A + B)
,
where A is the binary ground truth mask and B is
the binary segmentation result. The DC value ran-
BIOIMAGING 2017 - 4th International Conference on Bioimaging
20
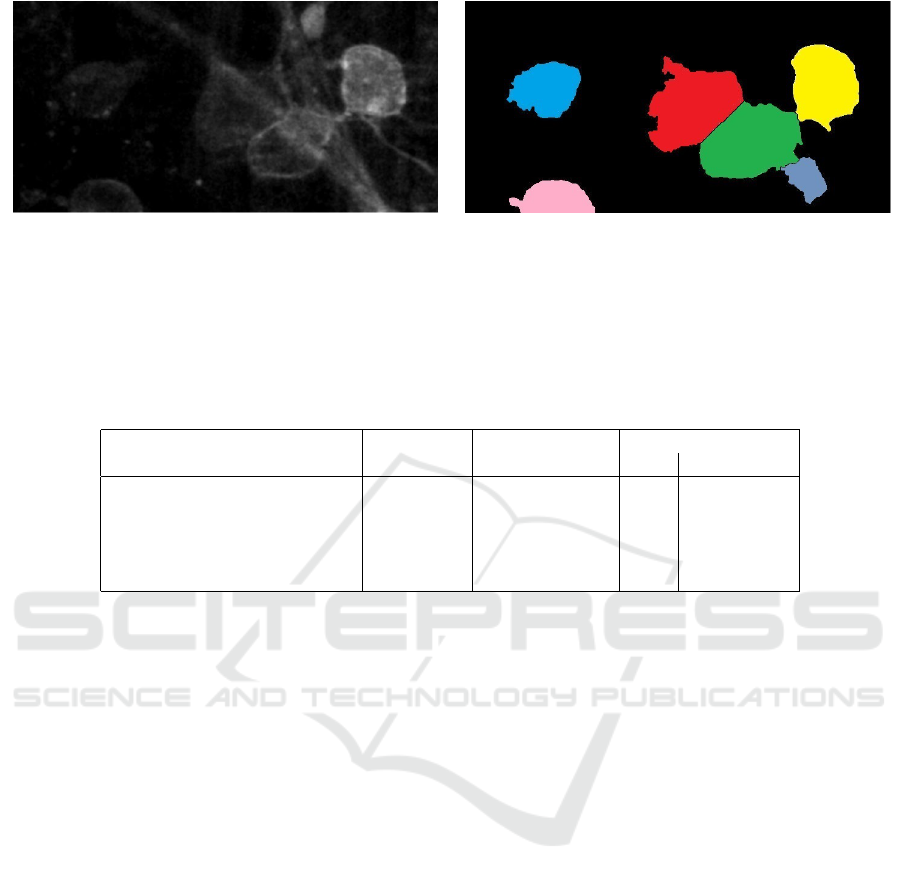
Crop of Im5 Resulted Crop Segmentation
Figure 3: Some cells are not easily visible to the human eye just visualizing the retina images, but they are discovered and
segmented by our algorithm (for example, in this cropped figure, pink and blue cells were hardly detectable). Adding contrast
to the image makes these somata clearer but it increases noise and cell heterogeneity.
Table 1: Segmentation process results. Dice Coefficient has been computed after all steps in the pipeline (Blob Filter, Active
Contour and Watershed Transform) and shows improvements after each step. For the final stage of the pipeline, there is also
the percentage of detected cells computed assuming as detected a cell with minimum overlap with ground truth fixed at 50%.
Image # of cells Blob Filter Active Contour Final
DC DC DC detected cells
Im1 (PV-EYFP) 95 0.60 0.69 0.81 86.32%
Im2 (Thy1-EYFP) 37 0.43 0.58 0.64 89.19%
Im3 (Calretinin) 64 0.62 0.82 0.83 75.00%
Im4 (Calretinin) 29 0.57 0.71 0.79 82.76%
Im5 (Thy1-EYFP) 48 0.51 0.62 0.70 85.42%
ges between 0 (absence of agreement) and 1 (perfect
agreement). A DC higher than 0.70 usually indicates
a satisfactory segmentation (Zijdenbos et al., 1994).
As an additional index of performance, we also
provide the percentage of detected cells for each
image. We consider a cell as detected if it is correctly
segmented for more than 50% of its total area, com-
paring the segmentation mask to the ground truth for
each annotated RGC. Fig.4 shows that 50% threshold
is a good trade off between the certainty of a cell de-
tection and a satisfactory retrieval.
Table 1 shows the quantitative results of these me-
trics on our samples. We compute the DC for each of
the three steps. Each stage clearly improves the seg-
mentation, reaching satisfactory results for all ima-
ges. In Im3 (Fig.1), the fluorescence is mainly ex-
pressed by the body cells; for this reason, we reach
good scores right after the first two steps. The weaker
DC values on images Im2 and Im5 are due to a strong
presence of axonal structures which can be hardly re-
moved.
5 CONCLUSIONS
In this paper we have proposed a new algorithm for
the large-scale segmentation of cells in challenging
retinal images. First, a novel and effective multiscale
blob filter is employed for cell enhancement which
selects ROIs for the initialization of an active con-
tour step, addressing the known weakness of these
methods. Active contour reaches suitable results but
needs a further segmentation in case of multiple cell
aggregations, which has been addressed using a wa-
tershed transform followed by a filter guided by the
size of structures.
We validated our approach against manual seg-
mentations on 5 images in which there are some hund-
reds of neurons representative of a variety of cell ap-
pearances and image conditions.
Thanks to its generality, this approach could be
applied to similar cell segmentation scenarios and
opens new perspectives for the analysis and the cha-
racterization of the retinal morphology at a population
level.
Segmentation of Retinal Ganglion Cells From Fluorescent Microscopy Imaging
21
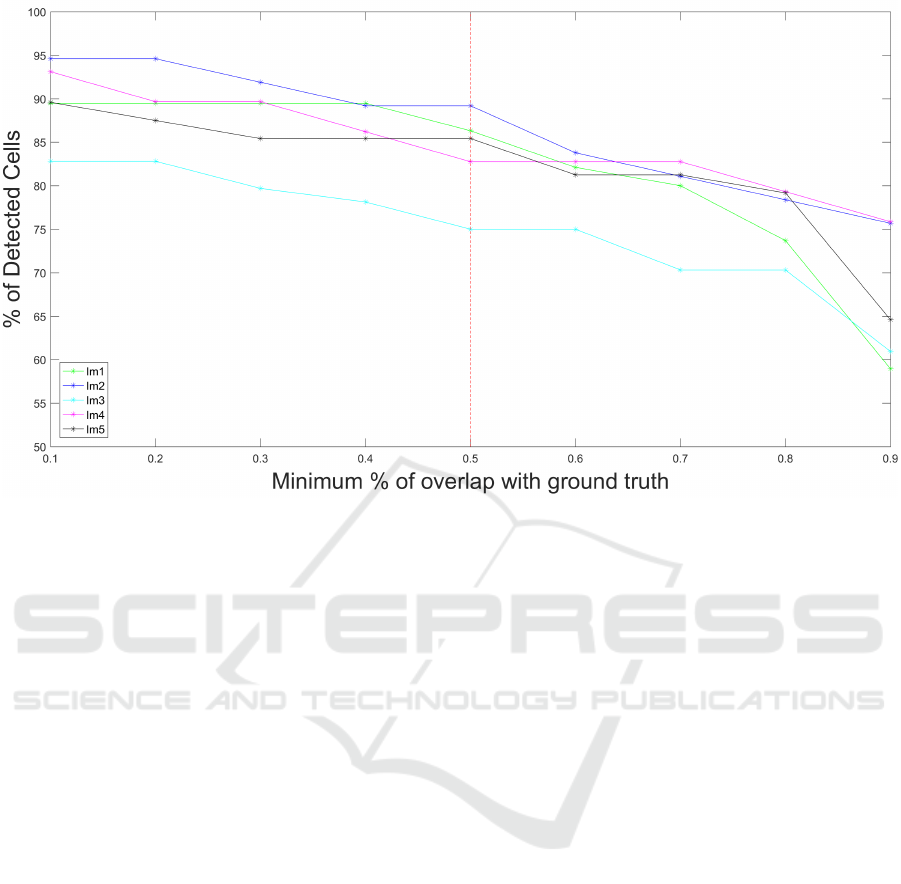
Figure 4: Variation of the % of detected cells as a function of the % of overlap between detected cell and the corresponding
annotated ground truth.
ACKNOWLEDGEMENTS
The research received financial support from the 7
th
Framework Programme for Research of the European
Commision, Grant agreement no. 600847: RENVI-
SION project of the Future and Emerging Technolo-
gies (FET) programme.
We would like to thank Dr. Luca Berdondini, Dr.
Alessandro Maccione, and Dr. Stefano Di Marco
(Neuroscience and Brain Technologies, Istituto Itali-
ano di Tecnologia, Genova) for providing the CMOS
devices and for their support in the sample prepara-
tion. We would also like to thank Dr. Francesca Cella
Zanacchi (Nanophysics, Istituto Italiano di Tecnolo-
gia, Genova) for her support in the microscopy acqui-
sitions.
REFERENCES
Arteta, C., Lempitsky, V., Noble, J. A., and Zisserman, A.
(2013). Learning to detect partially overlapping in-
stances. In Computer Vision and Pattern Recognition
(CVPR), 2013 IEEE Conference on.
Baden, T., Berens, P., Franke, K., Ros
´
on, M. R., Bethge,
M., and Euler, T. (2016). The functional diver-
sity of retinal ganglion cells in the mouse. Nature,
529(7586):345–350.
Berson, D. M., Castrucci, A. M., and Provencio, I. (2010).
Morphology and mosaics of melanopsin-expressing
retinal ganglion cell types in mice. Journal of Com-
parative Neurology, 518(13):2405–2422.
Beucher, S. and Lantu
´
ejoul, C. (1979). Use of waters-
heds in contour detection. In International workshop
on image processing, real-time edge and motion de-
tection.
Chan, T. F., Vese, L., et al. (2001). Active contours without
edges. Image processing, IEEE transactions on, 10.
Frangi, A. F., Niessen, W. J., Vincken, K. L., and Viergever,
M. A. (1998). Multiscale vessel enhancement filte-
ring. In Medical Image Computing and Computer-
Assisted InterventationMICCAI98, pages 130–137.
Springer.
Ge, Q., Li, C., Shao, W., and Li, H. (2015). A hybrid active
contour model with structured feature for image seg-
mentation. Signal Processing, 108:147–158.
Gregory, R. L. (2015). Eye and Brain: The Psychology of
Seeing: The Psychology of Seeing. Princeton univer-
sity press.
Gulyanon, S., Sharifai, N., Kim, M. D., Chiba, A., and Tse-
chpenakis, G. (2016). Crf formulation of active con-
tour population for efficient three-dimensional neurite
tracing. In 2016 IEEE 13th International Symposium
on Biomedical Imaging (ISBI), pages 593–597. IEEE.
Kim, I.-J., Zhang, Y., Meister, M., and Sanes, J. R. (2010).
Laminar restriction of retinal ganglion cell dendrites
and axons: subtype-specific developmental patterns
revealed with transgenic markers. The Journal of Neu-
roscience, 30(4):1452–1462.
Lankton, S. and Tannenbaum, A. (2008). Localizing region-
BIOIMAGING 2017 - 4th International Conference on Bioimaging
22

based active contours. Image Processing, IEEE Tran-
sactions on, 17(11):2029–2039.
Liu, J., White, J. M., and Summers, R. M. (2010). Auto-
mated detection of blob structures by hessian analysis
and object scale. In Image Processing (ICIP), 2010
17th IEEE International Conference on, pages 841–
844. IEEE.
Meijering, E. (2012). Cell segmentation: 50 years down
the road [life sciences]. Signal Processing Magazine,
IEEE, 29(5):140–145.
Neumann, S., Hser, L., Ondreka, K., Auler, N., and Haver-
kamp, S. (2016). Cell type-specific bipolar cell input
to ganglion cells in the mouse retina. Neuroscience,
316:420 – 432.
Roska, B., Molnar, A., and Werblin, F. S. (2006). Paral-
lel processing in retinal ganglion cells: how integra-
tion of space-time patterns of excitation and inhibition
form the spiking output. Journal of Neurophysiology,
95(6):3810–3822.
Wu, P., Yi, J., Zhao, G., Huang, Z.and Qiu, B., and Gao,
D. (2015). Active contour-based cell segmentation
during freezing and its application in cryopreserva-
tion. Biomedical Engineering, IEEE Transactions on,
62(1):284–295.
Yezzi, A., Tsai, A., and Willsky, A. (2002). A fully glo-
bal approach to image segmentation via coupled curve
evolution equations. Journal of Visual Communica-
tion and Image Representation, 13(1):195–216.
Zhang, C., Yarkony, J., and Hamprecht, F. A. (2014). Cell
detection and segmentation using correlation cluste-
ring. In Medical Image Computing and Computer-
Assisted Intervention–MICCAI 2014, pages 9–16.
Springer.
Zijdenbos, A. P., Dawant, B. M., Margolin, R., Palmer,
A. C., et al. (1994). Morphometric analysis of white
matter lesions in mr images: method and validation.
Medical Imaging, IEEE Transactions on, 13(4):716–
724.
Segmentation of Retinal Ganglion Cells From Fluorescent Microscopy Imaging
23
