
Research and Application of Radar Detection Error Model based on
Data Mining
Jun Song
Unit 92941 , Huludao liaoning 125000, China
Keywords: Radar Detection Error Model; Data Mining; Decision Tree.
Abstract: Aiming at the problem of establishing a radar detection error model, this paper proposes a method, which
uses SQL Server 2005 as a data mining implement and selects decision tree algorithm, based on lots of
detected data of the radar. This radar detection error model is used to forecast the detection error in a radar
simulation. The result of comparing with the traditional error simulation method shows that the method
based on the data mining is an efficient approach for analysis, modeling and forecast of the radar detection
error.
1 INTRODUCTION
In the military field, sensor simulation is an
important part of the battlefield situation awareness
system simulation, while the technology of sensor
error simulation plays a key role in sensor
simulation(Jianqing Cheng, 2007). At present, radar
is still the major information-source sensor in the
battlefield situation awareness and formation. To
build up an error model that goes with the detection
property of radar is the key to radar simulation.
The simulation modeling of radar detection error
is a complicated and systematic job, which can be
achieved by two fundamental methods. One method
is the theoretical analysis and deduction method.
That is, a model for radar detection error mechanism
is deduced according to the priori knowledge, which
is referred to as the “white box ” modeling. The
other method is to build up a mathematical model by
making data test for and making analysis on the
signals inputting into and outputting from the radar
system, which is referred to as the “black box”
modeling. Currently, the traditional mathematical
statistics method is commonly used to make “black
box” modeling for the simulation of radar detection
error. That is, radar’s systematic error and standard
deviation are obtained by making statistic analysis
on historical data, and then are simulated with a
white Gaussian noise model. However, this method
is only able to reflect the statistical law of error, but
is not able to reflect the true error characteristics,
thus influencing the fidelity of radar simulation.
Data mining is a process to extract hidden,
unknown but potentially useful information and
knowledge from a mass of incomplete, noisy,
ambiguous and random application data(Han J,2001).
In the real testing of target, abundant measured data
has been collected, including the distance of target
measured by radar, data of target orientation and the
true-value distance and orientation of target
(hereinafter referred to as target true track data).
However, these data has not been fully utilized. In
this paper, the data mining technology is used to find
out the relationship between the hidden radar
detection error and the target true track data from a
mass of test data, so as to improve the fidelity of
radar simulation.
2 MINING ALGORITHM FOR
RADAR DETECTION ERROR
Data mining has five functions, including concept
description, clustering analysis, correlation analysis,
trend analysis and forecast, and variance analysis. In
this paper, data mining is mainly used to analyze and
forecast the characteristics of radar detection error in
different distances and positions, thus the function of
trend analysis and forecast is adopted. Methods used
to make trend analysis and forecast mainly include
decision tree, artificial neural network and so on.
In this paper, the decision tree algorithm is
selected to make data mining. The decision tree has a
tree structure similar to the flow diagram. According
294
294
Song J.
Research and Application of Radar Detection Error Model based on Data Mining.
DOI: 10.5220/0006449302940298
In ISME 2016 - Information Science and Management Engineering IV (ISME 2016), pages 294-298
ISBN: 978-989-758-208-0
Copyright
c
2016 by SCITEPRESS – Science and Technology Publications, Lda. All rights reserved

to the difference in hierarchy, the nodes can be
classified into root node, internal node and leaf node.
The root node indicates the data set of the whole
sample. Each internal node indicates the testing on a
property. Each branch represents a testing output.
Each leaf node represents class or class distribution.
The decision tree, after analyzing and studying the
sampled data, will make use of the tree structure to
classify the data in order to find out the valuable
and potential information, and then will acquire the
classification rule through training, and finally will
use the analyzed result to forecast more data. The
classification rule can be extracted from the decision
tree after it has taken shape. All the intermediate
nodes on the path from the root nodes to the leaf
nodes constitute the conditions of the rule. The
conclusion part of the rule can be obtained from the
leaf node(Jiawei Han,,2001).
The frequently-used decision tree algorithm is
based upon the information entropy, with its core
algorithms being ID3, C4.5, C5.0, CART, SLIQ,
SPRINT, Rain Forest and so on(Glover T W, 2005).
In the paper, the C4.5 algorithm is adopted because
in the sampled data, the data of distance, position
and error is the continuous attribute.
There are two steps to construct a decision tree,
including building decision tree and decision tree
pruning.
The first step is to build a decision tree. Generally,
the decision tree is built from top to bottom. To find
out the best extended attribute is the key to make the
decision tree grow. To achieve this, you shall firstly
determine the form of extended attribute, and then
find out and evaluate all the extended attributes in
this form, and finally select the most sensible ones as
the best extended attributes.
Definition 1: Information gain. Assuming that S is
the set of s data samples, the samples are classified
into c different classes ci (i=1,2, ..., c). Assuming
that si is the number of samples in class ci, S is
classified into c classes of information entropy (or
expected information) which can be expressed as
follows.
∑
=
−=
C
i
ii
ppAI
1
2
)(log)(
(1)
In this formula,
SSP
ii
/=
Assuming that attribute A has V different values
{a1, a2, ..., av}, S is divided into v subsets {s1, s2, ...,
sv} by attribute A. According to attribute A, the
information entropy that dividing S can be defined as
follows.
)(),(
1
j
v
j
j
SI
S
S
ASE
∑
=
−= (2)
Information gain Gain (S, A) is expressed as
),()(),( ASEAIASGain −
=
(3)
Definition 2: Information gain ratio. According to
the attribute A, the information gain ratio that divide
S can be defined as follows.
)(
),(
)(
ASplid
ASGain
AGainRatio = (4)
And
∑
=
−=
v
j
jj
ppASplitI
1
2
)(log)(
C4.5 algorithm has selected the attribute that has
the maximum information grain ratio as the extended
attribute. It can process not only the discrete attribute
but also the continuous attribute. This algorithm
adopts the multi-section method for the discrete
attribute and the bi-section method for the
continuous attribute(An Chen,2006). For the reason
that the sampled data belongs to the continuous
attribute in this paper, it is regulated that the testing
of attribute A should produce two branches which
correspond to condition Av and A>V respectively.
v is referred to as the partial threshold. If A is the
best extended attribute, v is referred to as threshold.
To determine the partial threshold of A, you should
firstly sequence the attribute values of A which is in
the training sample rapidly, and then study the
median v of each pair of adjacent values and the
corresponding conditions Av and A>V. Assuming
A has m different values in the sample, then there are
m-1 medians v, which correspond to m-1 potential
GainRatio v. If the value of a certain information
gain ratio GainRatio v’ is the maximum, such v’ is
the partial threshold of A. Finally you will obtain the
best extended attribute after you have traversed all
the attributes(Guojun Mao, 2007).
Step two. Decision tree pruning. Many branches
of the decision tree may reflect noises and acnodes
of the training data. The purpose of pruning is to
detect and trim such branches, so as to solve the
problem of data overfitting. A subtree is replaced by
a leaf node in order to improve the accuracy in
forecast of unknown data. The frequently-used
pruning method is to set the maximum height
(number of levels) of the decision tree, so as to limit
the tree growth and to set the minimum number of
samples that must be contained in each leaf node to
Research and Application of Radar Detection Error Model based on Data Mining
295
Research and Application of Radar Detection Error Model based on Data Mining
295

stop it from branching. The tree can be evaluated by
means of cross validation or by artificially selecting
partial data to make validation.
3 MINING SOLUTIONS FOR
RADAR DETECTION ERROR
In this paper, SQL Server 2005 is selected as the data
mining platform, and the decision tree algorithm is
used to mine the radar detection error. The SQL
Server 2005 provides the data mining functions
including SQL server integration services (SSIS) and
SQL server analysis services (SSAS)(Deli Zhu,
2007). The integration services are used in data
pre-processing while the analysis services provide
multiple data mining algorithms.
3.1 Data Pre-Processing
Data pre-processing is an important link in the data
mining. Usually the original data supplied for data
mining is lack of consistency, and has plenty of
redundancy and null values. Therefore, data
pre-processing is to process such original data as
well as the noisy data in it. the pre-processing mainly
includes the following procedures.
1) Data conversion, integration and matching. To
make data mining, you should firstly obtain the
difference value between the measured data and the
real tracking data of the target radar. It is necessary
to match the track and to reconcile the step length of
data mining by the method of three-point
interpolation, because the measured data and real
tracking data of radar are stored in different files and
the data mining is in different step lengths.
2) Data consistency processing. The data must be
made clean and consistent in order to improve the
accuracy of data mining. In the paper, the 3σrule is
used to distinguish the abnormal errors.
3.2 Error Data Mining
According to the above analysis, in the radar
detection error mining, the truth distance and truth
position are made as the input attributes, while the
distance errors and position errors are made as the
forecast attributes. The C4.5-based decision tree is
used to build an error model, and the reserved testing
method is used to evaluate the accuracy of decision
tree. The reserved testing method divides the entire
sampled data into the training data set and testing
data set which do not intersect. After the
pre-processing, the training data set contains 20
tracks and 5052 sampled data, and the testing data
set contains 1 track and 1092 sampled data. The
structure of sampled data is shown in Table 1, in
which Det_D and Det_B represent the distance and
position of target measured by radar respectively; D
and B represent the truth distance and truth position
of target; and ΔD and ΔB represent the distance error
and position error respectively. The unit for distance
is meter, and the unit for position is degree.
The modeling is done in SQL Server 2005. The
decision tree algorithm can be determined by
selecting parameters for the mining model. In this
paper, the entropy-based algorithm is used to
calculate and split the fractions, and the method of
bi-section is designated to split nodes. After
processing, the mining model has generated a
decision tree for distance error and one for position
error.
The pruning is to trim the decision tree according
to the minimum number of samples that must be
contained in each leaf node, and to evaluate the
trimmed tree with testing data set. When the
minimum number of samples contained in the leaf
node is equal to 140, the generated decision tree for
distance error present a good forecasting
performance. When the minimum number of
samples contained in the leaf node is equal to 280,
the generated decision tree for position error presents
a good forecasting performance.
The following is part of the decision tree model
for distance error:
B>=160.639
--B<162.453
-- -- D<93611.621:
ΔD=102. 212-5.585*(B-163.452) (439)
-- -- D>=93611.621:
ΔD=18.956+5.476*(B-166.170)-(D-98656.788)
(612)
-- B>=162.453
We can draw out a rule from the above. That is, if
B>=160.639, B<162.453 and D<93611.621, the
distance error model is expressed as ΔD=102.
212-5.585*(B-163.452), and the number of samples
contained is 439. Similarly, other rules can be drawn.
All these rules have covered the coverage of training
data set, and the aggregate of all these rules has
made up the radar detection error models for
distance and position.
ISME 2016 - Information Science and Management Engineering IV
296
ISME 2016 - International Conference on Information System and Management Engineering
296
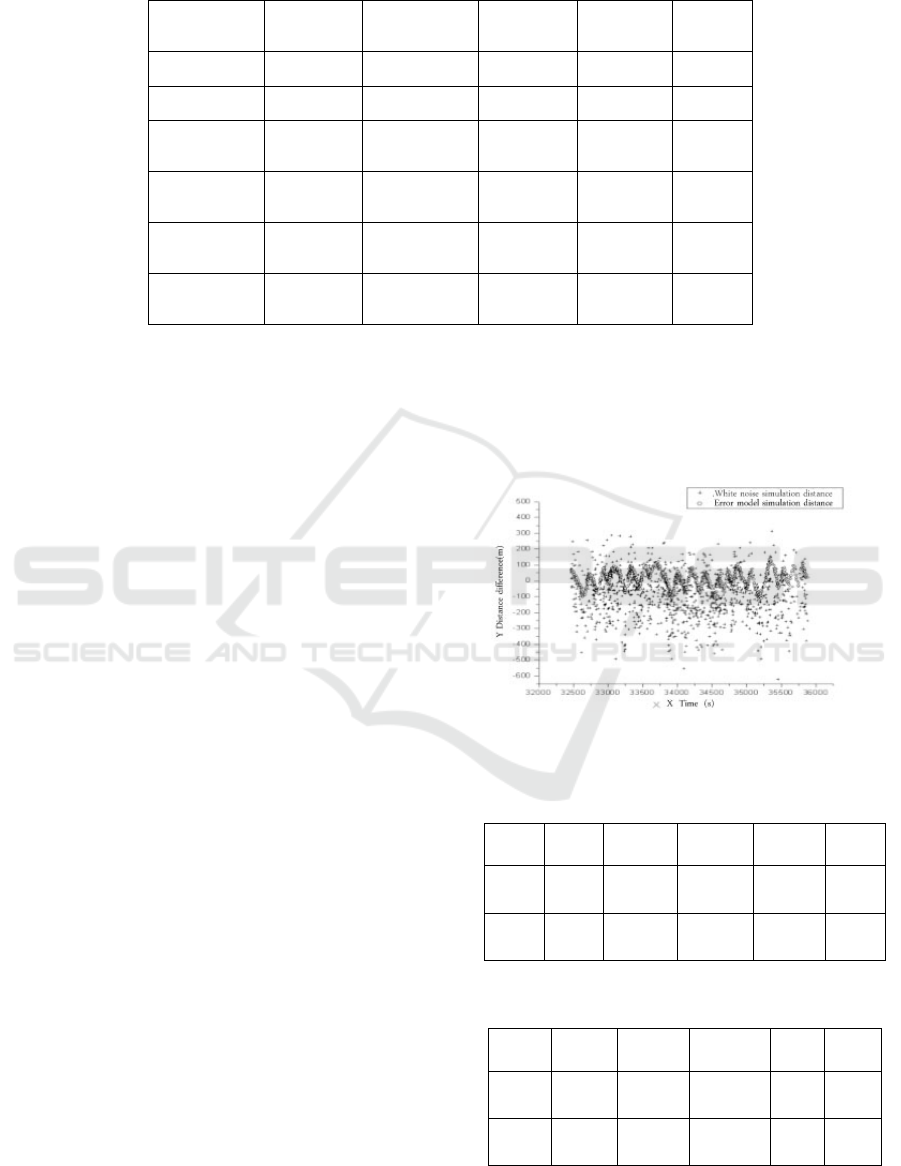
Table 1. Part of Sampled Data
Det_D Det_B D B
△D △B
…… …… …… …… …… ……
98704.87199 169.95026 98757.74688 169.70676 -52.87488 0.2435
98705.97614 169.92697 98735.94282 169.70448 -29.96668 0.22249
98708.16997 169.87285 98735.94282 169.70448 -27.77285 0.16837
98708.69452 169.84795 98735.94282 169.70448 -27.2483 0.14347
…… …… …… …… …… ……
4 VERIFICATION OF RESULT OF
RADAR SIMULATION
In order to verify the effect of the mined radar
detection error model, we have compared it with the
traditional radar error simulation, and have made use
of the test set data in the sample, with one track
containing 1092 track points. Both methods are to
superpose error on the target truth-value track data.
In one simulation method, the mined radar detection
error model (hereinafter referred to as error model
simulation) is used, with the simulated data detection
data equal to the sum of target truth-value track data
and model forecast error. While in the other method,
the traditional radar error simulation model
(hereinafter referred to as white-noise simulation),
with the simulated radar detection data equal to the
sum of target truth-value track data, system error and
Gaussian white noise, in which the the system error
and Gaussian white noise are obtained based on the
training data.
To compare the fidelity of the two simulation
methods, the author has made a comparison between
the measured data (distance and position) and the
results of the two simulation methods, with the
comparative results shown in Figure 1, Figure 2,
Table 2 and Table 3. In Figure 1 and Figure 2, “+”
represents the difference between the data measured
by radar and the result of white noise simulation, and
“O” represents the difference between the data
measured by radar and the result of error model
simulation. In Table 1 and Table 2, ΔD1 is the
difference between the data measured by radar and
the result of white noise simulation in distance,
while ΔB1 is that in position. From the two figures
and the two tables, it can be seen that the result of
error model simulation is more approximate to the
data measured by radar, showing that this model
achieves a higher fidelity.
Figure 1. Distance Difference
Table 2. Statistics on Distance Difference
Mean
Standard
deviatio
Min.
value
Max
.value
Points
ΔD
1
(m)
94.610 142.567 -622.407 -117.350 1092
ΔD
2
(m)
8.928 51.864 -117.350 136.330 1092
Table 3. Statistics on Position Difference
Mean
Standard
deviatio
Min.
value
Max
.value
Points
ΔB
1
(°)
0.083 0.333 -1.135 1.072 1092
ΔB
2
(°)
-0.045 0.066 -0.182 0.132 1092
Research and Application of Radar Detection Error Model based on Data Mining
297
Research and Application of Radar Detection Error Model based on Data Mining
297

Figure 2. Position Difference
5 CONCLUSIONS
The methods proposed in this paper can effectively
analyze, model and forecast the radar detection
errors, thus finding out a new thought for
radar
error
simulation. In the following researches, the
relationship between the factors such as radar
detection error, radar system, physical parameters,
environmental conditions and so on will be explored,
in order to acquire a radar detection error model with
higher fidelity.
REFERENCES
Jianqing Cheng, 2007.Development and Prospective of
Military Modeling and Simulation Technology.
Command Control & Simulation, (4): 1-8.
Han J, Kambr M, 2001.Data Mining: Concepts and
Techniques . Beijing Higher Education Press.
Jiawei Han,,2001.Data Mining: Concepts and Techniques
[M]. Beijing: China Machine Press.
Glover T W, Chang Dfaz, F R, Squire J P, 2005. Principal
VASIMR results and present objectives. Space
Technology and Applications International Forum.
An Chen, Ning Chen, 2006. Data Mining Technology and
Application . Beijing: Science Press.
Guojun Mao, Lijuan Duan, Shi Wang, 2007. Principle and
Algorithm of Data Mining. Beijing: Tsinghua
University Press .
Deli Zhu, 2007. SQL Server 2005 Total Solutions for Data
Mining and Business Intelligence [M]. Beijing:
Electronic Industry Press.
ISME 2016 - Information Science and Management Engineering IV
298
ISME 2016 - International Conference on Information System and Management Engineering
298
