
The Effect of Network Performance on High Energy Physics Computing
Jukka Kommeri
1,2
, Aleksi Vartiainen
1,2
, Seppo Heikkil
¨
a
3
and Tapio Niemi
3
1
Helsinki Institute of Physics, Helsinki, Finland
2
Aalto University, Espoo, Finland
3
Helsinki Institute of Physics, CERN, Geneva, Switzerland
{jukka.kommeri, aleksi.vartiainen}@aalto.fi, {seppo.heikkila, tapio.niemi}@cern.ch
Keywords:
OpenStack, Network, Latency, Energy efficiency, Scientific Computing.
Abstract:
High Energy Physics (HEP) data analysis consists of simulating and analysing events in particle physics.
In order to understand physics phenomena, one must collect and go through a very large quantity of data
generated by particle accelerators and software simulations. This data analysis can be done using the cloud
computing paradigm in distributed computing environment where data and computation can be located in
different, geographically distant, data centres. This adds complexity and overhead to networking. In this paper,
we study how the networking solution and its performance affects the efficiency and energy consumption of
HEP computing. Our results indicate that higher latency both prolongs the processing time and increases the
energy consumption.
1 INTRODUCTION
High Energy Physics (HEP) studies elementary parti-
cles by using large particle accelerators, such as the
Large Hadron Collider (LHC) at CERN, for produc-
ing millions of high-energy particle collision events.
In order to understand physics phenomena, one must
go through a very large quantity of measurement sam-
ples. A single high-energy physics analysis can pro-
cess millions of events (Ponce and Hersch, 2004).
This work can be easily parallelized because there are
no dependencies among these events. Particle physics
events are stored in database like containers, ROOT
files (Antcheva et al., 2009). The required computing
resources for CERN LHC data analysis are divided
among 11 tier-1 sites and 155 tier-2 sites of comput-
ing centers world-wide using the grid/cloud comput-
ing paradigms (Bird et al., 2014). The distributed na-
ture of HEP computing poses some extra overhead
when the data needs to be accessed from a site that is
geographically very distant. This often happens since
the grid infrastructure used at CERN, World Wide
LHC Computing Grid (WLCG), spans from Japan to
USA. Although, WLCG was designed before the era
of cloud computing, also different cloud solutions has
been studied and the OpenStack cloud suite has been
found suitable for HEP computing (Andrade et al.,
2012; O’Luanaigh, 2014).
On the high level, cloud computing is a collec-
tion of servers, or hypervisors, that run mixed sets of
virtual machines processing various workloads. The
hypervisors share their processing and networking re-
sources among a set of virtual machines. In the case
of HEP data analysis jobs, which fetch constantly data
from remote location, the network can become a bot-
tleneck and cause delays for the analysis. The delays
can have a big impact on overall performance.
ROOT files are most commonly accessed with the
XRootD protocol, that runs on top of TCP, (Behrmann
et al., 2010). The performance of XrootD is a well-
studied topic. These studies mainly focus on storage
performance (Gardner et al., 2014; Matsunaga et al.,
2010), data federation (Bauerdick et al., 2014), and
scalability (Dorigo et al., 2005; de Witt and Lahiff,
2014). Energy efficiency has not been considered,
nor the effect of network delay on the performance of
HEP computing. Therefore, in this paper we study the
effect of networking in cloud environment on the per-
formance and, especially, energy efficiency of HEP
computing. In HEP the data and computing is ge-
ographically distributed all over the globe. For this
reason the key problem examined in this paper is the
performance of HEP software accessing locally and
remotely located data sets. In particular, the goal is
to understand the effect of latency and throughput to
HEP job execution time and energy usage.
The remainder of this paper is structured as fol-
lows. First, in Section 2, we cover the related work.
227
Kommeri J., Vartiainen A., HeikkilÃd’ S. and Niemi T.
The Effect of Network Performance on High Energy Physics Computing.
DOI: 10.5220/0006224202270234
In Proceedings of the Sixth International Symposium on Business Modeling and Software Design (BMSD 2016), pages 227-234
ISBN: 978-989-758-190-8
Copyright
c
2016 by SCITEPRESS – Science and Technology Publications, Lda. All rights reserved

In Section 3 we describe our test software and the test
environment used in this study, which is followed by
the results in Section 4. Then we end with conclusion
in Section 5.
2 RELATED WORK
The importance of networking energy efficiency
keeps growing as the world is getting more and more
connected. Bolla et al. (Bolla et al., 2011) have stud-
ied what kind of research there has been in the net-
work domain to improve energy efficiency. Ideas are
very similar to those of the energy efficiency of com-
puting. Hardware energy efficiency needs to be im-
proved and the hardware needs better power scaling
abilities: there needs to be a way to turn off hard-
ware resources when they are not needed and in this
way to improve the utilization level of the hardware.
Kliazavich et al. (Kliazovich et al., 2010) have de-
veloped a cloud simulator, Greencloud, for measuring
the energy consumption of cloud data centers. It can,
e.g., evaluate different internal network layouts. The
authors also showed how cloud network can benefit
from load based management of virtual machines.
Load based management of virtualized cluster has
been studied a lot and many different algorithms with
various heuristics have been proposed. Piao et al.
(Piao and Yan, 2010) have studied this topic from net-
working aspect. They have developed an algorithm
that moves virtual machines in order to avoid conges-
tion in the network. In their simulations, the execu-
tion time of data intensive application was improved
by up to 25% when using their network traffic aware
algorithm. Kuo et al. (Kuo et al., 2014) have studied
how internal cloud latencies affect MapReduce (Dean
and Ghemawat, 2008) performance. They have de-
veloped a virtual machine placement algorithm that
attempts to minimize the network latency between
cloud instances and this way improve the performance
of Hadoop tasks.
In a shared environment like cloud, also the inter-
nal networking can become a bottleneck. Mauch et
al. (Mauch et al., 2013) introduce High Performance
Cloud Computing (HPC2) model. They have studied
how suitable Amazon cloud would be for HPC com-
putation and found the network to be limiting factor
for performance. The 10Gb network of Amazon was
found to cause more than ten times more latency than
Infiniband that is normally used in HPC clusters. Ex-
posito et al. (Expsito et al., 2013) have also stud-
ied how well different HPC loads perform in Ama-
zon cloud. Reano et al. (Reano et al., 2013) have
found similar limitations for remote GPU computing.
The Gigabit Ethernet can add a 100% overhead on
rCUDA
1
.
As the physics analysis jobs are well parallelizable
and do not need inter process communication, the per-
formance of internal communication is not so impor-
tant. More important is the access time to data, which
depends partly on cloud internal networks, but also on
how far the data is and how the cloud connects to it.
Haeussler et al. (Haeussler et al., 2015) have studied
how latency effects the performance of genome an-
notation data retrieval. In their case, the data can be
very far away and this distance can slow down the re-
trieval process significantly. Shea et al (Shea et al.,
2014) have studied the performance of TCP in cloud
environment. They have shown that the network per-
formance of virtual machine depends on the CPU load
of its hosting hypervisor, i.e., if there are other virtual
machines on the same physical host with high CPU
load, there is less CPU time for networking.
The same situation occurs when virtual machine
itself has a high CPU load. This study was made in
Amazon environment and with a separate Xen setup.
Bullot et al. (Bullot et al., 2003) have studied the
performance of different TCP variants. They have
compared different TCP versions over connections
that link continents. The distance affects the perfor-
mance of different TCP variations differently. Sci-
entific computing runs mainly on Linux machine and
CERN has its own variant of it, Scientific Linux at
CERN (SLC). SLC uses Cubic TCP, which is a de-
fault TCP variant in Linux and a more fair version of
BIC TCP (Ha et al., 2008).
As the review above shows, many aspects of net-
working of cloud clusters, data centers, and the In-
ternet have received a lot of research attention, still
the effect of latency on energy efficiency of different
workloads have not been much studied.
3 TEST ENVIRONMENT
There are different kinds of HEP workloads: sim-
ulation, reconstruction, analysis, etc. In this study,
we used as our workload a process that transforms
real physics event data into a more compact form that
can be eventually used by the physicist on a standard
PC hardware. The transformation process of a single
event has two phases. In the first phase, the events
are selected based on their suitability for the current
analysis. Then, in the second phase, the event data is
transformed and stored in a more space saving struc-
ture.
1
http://www.rcuda.net/
Sixth International Symposium on Business Modeling and Software Design
228

HEP computation uses special software packages.
In the case of CERN CMS experiment, CMS soft-
ware framework (CMSSW) (Fabozzi et al., 2008) is
used. CMSSW is distributed to computing nodes with
CERN Virtual Machine Filesystem, CVMFS (Meusel
et al., 2015). CVMFS is a centrally managed soft-
ware repository that contains several versions of var-
ious HEP software frameworks. It can be mounted
directly to computing nodes. The software is cached
locally when it is being used. In the case of CMS anal-
ysis, the job can cache about 1 GB of data or program
code.
In this study, we tested HEP workload in a cloud
environment. Since the location of the data and net-
working conditions have a big impact to the perfor-
mance of the computation, our goal is to measure
this effect of distance on both computation time and
energy consumption. In our tests, the OpenStack
2
cloud platform was used. OpenStack is a open-source
platform for cloud computing consisting of individual
projects, i.e. services, that are responsible for comput-
ing, networking and storage, among other services.
OpenStack services are designed to be deployed on
multiple nodes, with a scalable number of compute
nodes. Virtual machines running on OpenStack are
called instances.
Measurements were done using three different
cloud setups. In all the setups, we had a HEP client
that reads data from storage server and does the trans-
formation. In every test, the client was run in a cloud
instance and the data server on a separate instance
or on a separate server outside the cloud. The same
workload was used in all the tests and its run times
and energy consumption in different network condi-
tions were measured. Tests were repeated several
times to get reliable results.
3.1 Local Data
First tests were done using a single physical server
with suitable hardware for energy measurement. This
single server OpenStack cloud installation was setup
with DevStack
3
. In our DevStack installation, all of
the OpenStack components run on the same hard-
ware. The setup used the following hardware: Fu-
jitsu Esprimo Q910 computer with quad-core Intel(R)
Core(TM) i5-3470T CPU @ 2.90GHz, 8 GB of RAM
and 8 GB of swap. As an operating system, it had
Ubuntu 12.04.
Physics workload was run in an OpenStack in-
stance. OpenStack instances can have different
amounts of resources; number of virtual processors
2
https://www.openstack.org/software
3
http://docs.openstack.org/developer/devstack/
(VCPU), the amount of memory (RAM), and the size
root disk and swap disk. These different configura-
tions are called flavors
4
. Two types of flavors were
used in the test environment: when running only one
job the instance was assigned two virtual CPUs, 4 GB
of memory and two GB of swap, and when running
two jobs it was assigned one virtual CPU, 3 GB of
memory and 1 GB of swap.
As a storage server for ROOT files, we used a
ProLiant BL280c G6 blade computer with 16-core
Intel Xeon CPU E5640 @ 2.67GHz and 68 GB of
RAM. The server was in the same local area network
of computer science department of Aalto University
as the cloud setup and were initially connected with
100MbE, which was upgraded to 1GbE for compari-
son. The server was installed with Ubuntu 14.04 and
xrd server version 4.1.3.
We measured aspects such as processor (CPU),
memory (RAM), power, cached data and network
traffic statistics. Power measurements were done us-
ing Running Average Power Limit (RAPL) (H
¨
ahnel
et al., 2012). RAPL is an Intel technology that mea-
sures the power consumption in Sandy Bridge CPUs
and above. Network traffic has been recorded with
Tshark, which is the command line version of Wire-
shark
5
packet analyzer.
The workload was run in varying conditions, in-
cluding network delay, packet loss, packet duplica-
tion, packet corruption, limited network throughput,
parallel jobs, and different operating system cache
and CVMFS cache configurations. In this paper, we
use the term throughput to describe the actual net-
work transport capacity, i.e., bits per second. The
network limitations were simulated using the class-
less queuing disciplines (qdisc) tool, except for lim-
ited throughput simulated with Wondershaper
6
. The
OS cache was cleared by freeing pagecache, dentries
and inodes, and CVMFS cache with CVMFS tool
cvmfs_config wipecache.
In addition to previously described single node
cloud system, we installed a separate cloud, which
was able to run more virtual machines, but lack the
ability to measure energy consumption. We used the
same blade hardware and operating system as previ-
ously for storage server. In these tests, we used three
blades, which were installed using Puppetlabs Open-
Stack module
7
. The OpenStack controller node, net-
working node and compute node were installed on
their own hardware. All the nodes were connected
4
http://docs.openstack.org/openstack-ops/content/
flavors.html
5
https://www.wireshark.org/
6
http://www.lartc.org/wondershaper/
7
https://github.com/puppetlabs/puppetlabs-openstack
The Effect of Network Performance on High Energy Physics Computing
229

to the same gigabit network switch. Data was served
from the same node as where the controller was in-
stalled, but not within OpenStack. Physics analysis
was run in an OpenStack instance. Tests with this
cloud setup were done using varying amounts of vir-
tual machines. In similar way as in single node tests,
latency was simulated using qdisc.
3.2 Remote Data
Two OpenStack (release 2015.1.2) installations were
used in this study. One was located in CERN (Meyrin,
Switzerland) and another in the Aalto University (Es-
poo, Finland). Both of the deployments used three
physical machines. The physical machines used in
CERN were Dell PowerEdge R210 rack servers and
in Aalto HP blade servers in HP BladeSystem c7000
Enclosure. The roles of these three machines were
computing, networking and other services. Power
consumption was measured only over the physical
machine running computing service. Both of the
OpenStack instances were configured with routable
IP addresses in order to be accessible from outside.
The OpenStack installation in CERN was used to
run three identical computing jobs in parallel. Each
job was run in a separate Virtual Machine (VM).
The jobs accessed 1.4GB physics data file hosted in
XRootD servers. Two of these XRootD servers were
hosted inside the Aalto and CERN OpenStack instal-
lations. Two other XRootD servers were deployed to
existing OpenStack VMs: one in the CERN IT de-
partment and one to Kajaani in Finland.
In this study duration of HEP job processing and
energy usage were collected. The duration was mea-
sured from the start of job processing until first VM
finished the processing. Energy usage was collected
during this same period of time.
4 RESULTS
We used three different testbeds to get diverse mea-
surements. The workload was the same in every
testbed. Depending on the setups, energy was mea-
sured either with an energy meter or by calculating
from processor energy counters.
4.1 Local Data
Running the workload is both CPU and network in-
tense. Figure 1 shows the relation between power
consumption and network traffic, both appearing in
synchronous cycles. The base power consumption of
the hypervisor is typically less than five watts. Results
have a 30-second period of time in both ends when
the virtual machine is running idle, i.e., no workload.
This demonstrates the base power consumption and
other base statistics on the hypervisor and the virtual
machines. Remote resources from the XRootD server
are downloaded in distinct parts. Most of the time
there is no traffic between the server and the hyper-
visor. Closer look at the network throughput peaks
show that there is short but constant peak that uses all
the available bandwidth.
Network delays are typical to wide area networks
(WAN) and have a clear impact on the workload run-
time. As Figure 2 shows, an increase of 75 millisec-
onds in network delay, causes the run time to increase
by over ten seconds. In addition, the power consump-
tion increases by 34 percent. The effect is less evident
when the same test is repeated in a network with more
bandwidth. In Figure 3, we have the results of the
same measurements in gigabit Ethernet. Run times
are shorter with 1GbE, but energy consumption de-
pends on latency. The effect of bandwidth is sum-
marized in Table 1. In a gigabit LAN, the run times
decrease roughly by ten percent when compared to
that of a 100 Mbps network. Latency does not seem
to have a big impact on the energy consumption when
using 1GbE network, but an impact on 100MbE net-
work.
Table 1: Comparison of execution times in different net-
works with no added delay.
Parallelism Execution time (s) ∆
100MB/s 1 GB/s
1 VM 281 255 -9 %
2 jobs, 1
VM
363 327 -10 %
2 jobs, 2
VMs
315 278 -12 %
The workload downloads and stores roughly 400
MB of data in CERN VM File System (CVMFS) local
cache. If the cache is empty, this data is downloaded
from CERN servers at the beginning of executing the
workload. Otherwise no data exceeding ten kB in to-
tal is downloaded from CERN. As the total size of
required tools is 400 MB, setting the CVMFS cache
limit lower than that, affects the processing time and
network traffic. As Table 2 shows, no data needs to be
downloaded if the cache limit is high enough and the
data has been previously cached. On the contrary, the
workload cannot be executed at all if the cache limit
is too low.
In Table 3, we have a summary of parallel work-
load tests. It shows that the latency does not in-
crease significantly even though ten virtual machines
are sharing a single physical interface. Flows have
different latencies depending on the direction, but this
Sixth International Symposium on Business Modeling and Software Design
230
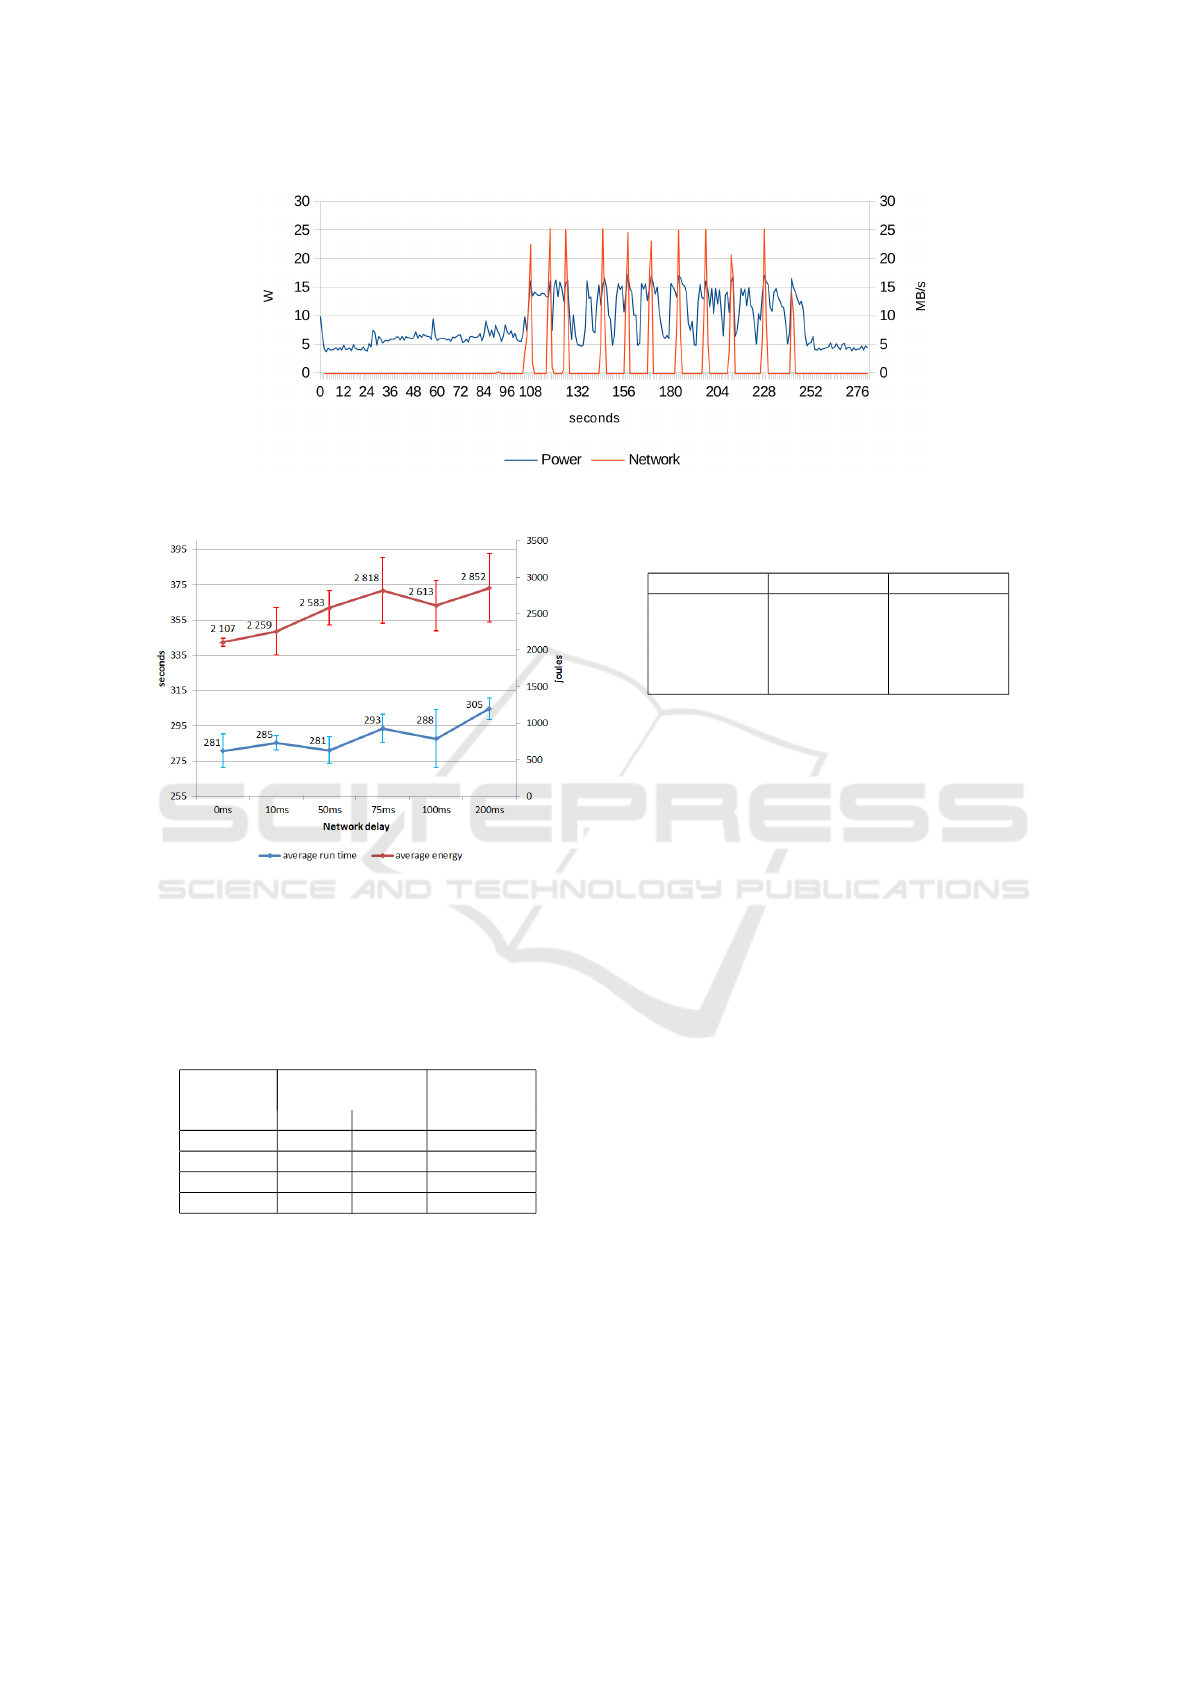
Figure 1: Relation between power consumption and network traffic on the hypervisor.
Figure 2: Comparison of workload run times and to-
tal energy consumptions with different network delays in
100Mb/s Ethernet.
Table 2: Comparison of execution times and network traffic
from CERN. When the cache limit is sufficiently less than
300 MB, the workload cannot be executed.
* First run after CVMFS cache clear
** The following runs (average)
Cache
limit
Data from
CERN (MB)
Execution
time (s)
* ** **
200 MB - - -
300 MB 422 300 249
500 MB 315 0 166
5000 MB 320 0 165
is similar with all workloads. Some change in the
maximum values, but means and medians are about
the same.
We tried to stress the shared interface even more
by adding five additional virtual machines generat-
ing HTTP traffic by downloading large images from
a university server. The results of this addition were
similar to the results of 10VM workload.
Similarly to previous single server measurements,
Table 3: Round trip times between XRootD server and
OpenStack instance in milliseconds.
1VM 10VM
min 0.11 0.03
max 238.97 294.71
median 4.38 4.46
mean 7.67 10.14
stdev 25.32 32.08
we tested how added latency affects the execution
time when running multiple virtual machines in par-
allel. Figure 4 shows how execution times increase
when we add more latency. This measurement was
done with 1, 5 and 10 virtual machines. The ef-
fect of added latency was greater with 1VM where
100ms caused 6.9% increase to execution time as with
10VMs it is 2.3%.
From the same 10VM tests we got the through-
put values, that are shown in Figure 5. These results
show a relation between latency and throughput as the
maximum throughput decreased 41% when 100ms la-
tency was added.
4.2 Remote Data
Figure 6 and Figure 7 show job run times and energy
usage, respectively, when data is hosted with XRootD
server in different physical locations. The energy us-
age is directly related to the processing time. Only the
OpenStack energy usage is slightly higher because the
measurement includes also the XRootD server host-
ing. Thus, it would be possible to estimate the energy
usage by measuring only the processing time.
There is at least two possible causes for the differ-
ences between sites: the network latency and through-
put. The network latencies to Aalto and Kajaani are
46.1±0.3ms and 49.6±0.2ms, respectively, while in-
side CERN the latencies are less than one millisec-
ond. The network throughput to Aalto and Kajaani
are 23.2±2.7 MB/s and 20.0±1.6 MB/s, respectively,
while inside CERN 58.3±4.9 MB/s.
The Effect of Network Performance on High Energy Physics Computing
231
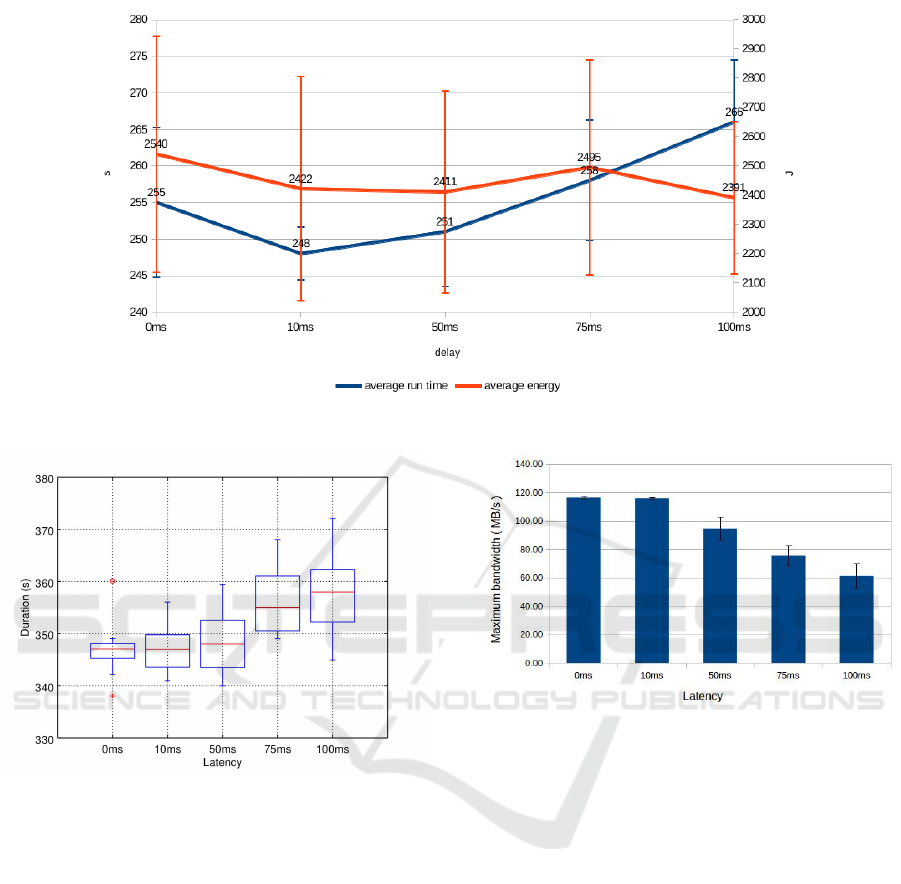
Figure 3: Comparison of workload run times and total energy consumptions with different network delays in 1Gb/s Ethernet.
Figure 4: Job execution times with ten OpenStack instances
in parallel and with added latency.
The effect of network throughput and latency can
be examined by comparing local and remote sites with
a 20MB/s fixed throughput that is achievable with
both sites. Figure 8 shows that there is around 12.5
percent difference between CERN and throughput
limited Kajaani site. Throughput limitation removes
70 percent of this difference so effect of latency seems
to explain around 30 percent of the difference. A de-
tailed analysis of the network traffic showed that only
0.01% TCP packets were retransmitted and also the
TCP window size increased quickly to around three
MB. Thus network problems do not explain the ob-
served differencies. With the current HEP software
stack the best option is to prefer nearby data sources
with low latency.
Figure 5: Maximum throughput with ten OpenStack in-
stances in parallel and with added latency.
5 CONCLUSIONS AND FUTURE
WORK
High energy physics computing at CERN uses a large
computing grid/cloud distributed around the world.
This naturally poses long distances between the sites
and slows down the network connections among
them. To alleviate this, we studied how networking
performance affects on computing performance and
energy efficiency on high energy physics computing
in an OpenStack cloud testbed. We used both simu-
lated network latencies in laboratory network and sev-
eral geographically distant sites connected by the In-
ternet to measure how different latencies change com-
puting performance when processing HEP workload.
Our results indicate that the network latency, ei-
ther caused by a simulator or physical distances be-
tween the sites, has a negative impact on the com-
Sixth International Symposium on Business Modeling and Software Design
232
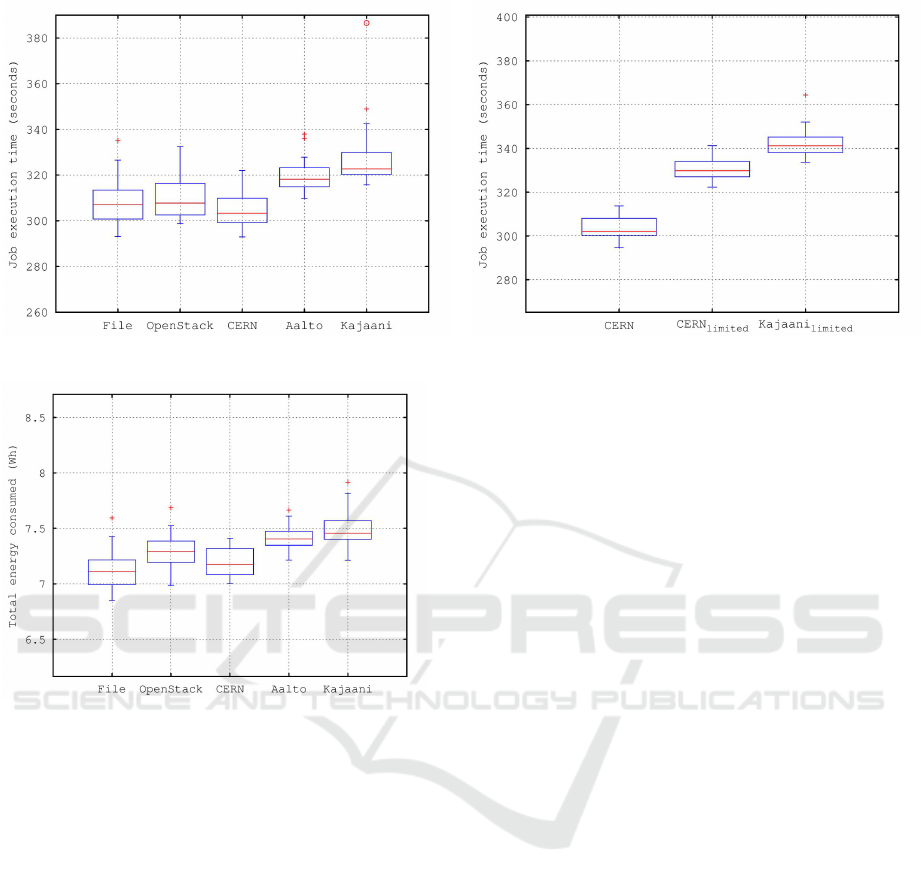
Figure 6: Job execution times of OpenStack VMs.
Figure 7: Energy usage of OpenStack VMs.
puting performance. High latency both increases run
times and the total energy consumption. Addition-
ally, we also noticed that the contribution of latency,
to the execution time and energy consumption of a
computation job, increases when bandwidth is small.
Parallelism, multiple cloud instances sharing the lim-
ited network resource, also adds more latency and in-
creases job run times.
The obtained results reflect the current software
environment used for HEP job processing. New data
transfer protocols or advanced caching mechanism
could diminish the observed differencies. Instead, the
used network infrastructure and computing hardware
is unlikely to change significantly in the near future.
Our future work includes studying methods how
the effect of latency can be minimized using e.g.
smarter workload scheduling, data preloading, or op-
timized network protocols.
Figure 8: Job execution times with throughput limits.
ACKNOWLEDGMENTS
This paper has received funding from the European
Union’s Horizon 2020 research and innovation pro-
gram 2014-2018 under grant agreement No. 644866.
DISCLAIMER
This paper reflects only the authors’ views and the
European Commission is not responsible for any use
that may be made of the information it contains.
REFERENCES
Andrade, P., Bell, T., van Eldik, J., McCance, G., Panzer-
Steindel, B., dos Santos, M. C., Traylen, S., , and
Schwickerath, U. (2012). Review of cern data centre
infrastructure. Journal of Physics: Conference Series,
396(4).
Antcheva, I., Ballintijn, M., Bellenot, B., and Biskup, M.
(2009). ROOT - A C++ framework for petabyte data
storage, statistical analysis and visualization. Com-
puter Physics Communications, 180(12):2499–2512.
Bauerdick, L. A. T., Bloom, K., Bockelman, B., Bradley,
D. C., Dasu, S., Dost, J. M., Sfiligoi, I., Tadel, A.,
Tadel, M., Wuerthwein, F., Yagil, A., and the Cms col-
laboration (2014). Xrootd, disk-based, caching proxy
for optimization of data access, data placement and
data replication. Journal of Physics: Conference Se-
ries, 513(4).
Behrmann, G., Ozerov, D., and Zanger, T. (2010). Xrootd
in dcache - design and experiences. In International
Conference on Computing in High Energy and Nu-
clear Physics (CHEP).
Bird, I., Buncic, P., Carminati, F., Cattaneo, M., Clarke, P.,
Fisk, I., Girone, M., Harvey, J., Kersevan, B., Mato,
The Effect of Network Performance on High Energy Physics Computing
233

P., Mount, R., and Panzer-Steindel, B. (2014). Up-
date of the computing models of the wlcg and the lhc
experiments. Technical report, CERN.
Bolla, R., Bruschi, R., Davoli, F., and Cucchietti, F. (2011).
Energy efficiency in the future internet: A survey of
existing approaches and trends in energy-aware fixed
network infrastructures. Communications Surveys Tu-
torials, IEEE, 13(2):223–244.
Bullot, H., Les Cottrell, R., and Hughes-Jones, R. (2003).
Evaluation of advanced tcp stacks on fast long-
distance production networks. Journal of Grid Com-
puting, 1(4):345–359.
de Witt, S. and Lahiff, A. (2014). Quantifying xrootd scala-
bility and overheads. Journal of Physics: Conference
Series, 513(3).
Dean, J. and Ghemawat, S. (2008). Mapreduce: Simpli-
fied data processing on large clusters. Commun. ACM,
51(1):107–113.
Dorigo, A., Elmer, P., Furano, F., and Hanushevsky, A.
(2005). Xrootd-a highly scalable architecture for data
access. WSEAS Transactions on Computers, 1(4.3).
Expsito, R. R., Taboada, G. L., Ramos, S., Tourio, J., and
Doallo, R. (2013). Performance analysis of HPC ap-
plications in the cloud. Future Generation Computer
Systems, 29(1):218 – 229. Including Special section:
AIRCC-NetCoM 2009 and Special section: Clouds
and Service-Oriented Architectures.
Fabozzi, F., Jones, C., Hegner, B., and Lista, L. (2008).
Physics analysis tools for the cms experiment at lhc.
Nuclear Science, IEEE Transactions on, 55:3539–
3543.
Gardner, R., Campana, S., Duckeck, G., Elmsheuser, J.,
Hanushevsky, A., H
¨
onig, F. G., Iven, J., Legger,
F., Vukotic, I., Yang, W., and the Atlas Collabora-
tion (2014). Data federation strategies for atlas us-
ing xrootd. Journal of Physics: Conference Series,
513(4):042049.
Ha, S., Rhee, I., and Xu, L. (2008). Cubic: A new tcp-
friendly high-speed tcp variant. SIGOPS Oper. Syst.
Rev., 42(5):64–74.
Haeussler, M., Raney, B. J., Hinrichs, A. S., Clawson, H.,
Zweig, A. S., Karolchik, D., Casper, J., Speir, M. L.,
Haussler, D., and Kent, W. J. (2015). Navigating pro-
tected genomics data with ucsc genome browser in a
box. Bioinformatics, 31(5):764–766.
H
¨
ahnel, M., D
¨
obel, B., V
¨
olp, M., and H
¨
artig, H. (2012).
Measuring energy consumption for short code paths
using rapl. ACM SIGMETRICS Performance Evalua-
tion Review, 40(3):13–17.
Kliazovich, D., Bouvry, P., and Khan, S. U. (2010). Green-
cloud: a packet-level simulator of energy-aware cloud
computing data centers. The Journal of Supercomput-
ing, 62(3):1263–1283.
Kuo, J.-J., Yang, H.-H., and Tsai, M.-J. (2014). Optimal ap-
proximation algorithm of virtual machine placement
for data latency minimization in cloud systems. In IN-
FOCOM, 2014 Proceedings IEEE, pages 1303–1311.
Matsunaga, H., Isobe, T., Mashimo, T., Sakamoto, H., and
Ueda, I. (2010). Managed Grids and Cloud Systems in
the Asia-Pacific Research Community, chapter Perfor-
mance of a disk storage system at a Tier-2 site, pages
85–97. Springer US, Boston, MA.
Mauch, V., Kunze, M., and Hillenbrand, M. (2013). High
performance cloud computing. Future Generation
Computer Systems, 29(6):1408 – 1416.
Meusel, R., Blomer, J., Buncic, P., Ganis, G., and Heikkil
¨
a,
S. S. (2015). Recent developments in the cernvm-file
system server backend. Journal of Physics: Confer-
ence Series, 608(1):012031.
O’Luanaigh, C. (2014). Openstack boosts tier 0 for lhc run
2. Technical report, CERN.
Piao, J. T. and Yan, J. (2010). A network-aware vir-
tual machine placement and migration approach in
cloud computing. In Grid and Cooperative Com-
puting (GCC), 2010 9th International Conference on,
pages 87–92.
Ponce, S. and Hersch, R. D. (2004). Parallelization and
scheduling of data intensive particle physics analysis
jobs on clusters of pcs. In 18th International Par-
allel and Distributed Processing Symposium (IPDPS
2004), Santa Fe, New Mexico, USA.
Reano, C., Mayo, R., Quintana-Orti, E., Silla, F., Duato,
J., and Pena, A. (2013). Influence of infiniband fdr
on the performance of remote gpu virtualization. In
IEEE International Conference on Cluster Computing
(CLUSTER), pages 1–8.
Shea, R., Wang, F., Wang, H., and Liu, J. (2014). A deep
investigation into network performance in virtual ma-
chine based cloud environments. In Proceedings of
IEEE INFOCOM, pages 1285–1293.
Sixth International Symposium on Business Modeling and Software Design
234
