
Data Integration and Visualization for Knowledge Mapping in
Strasbourg University
Amira Essaid
1
, Quynh Nguyen Thi
2
and Cecilia Zanni-Merk
1
1
INSA de Strasbourg, ICube laboratory, SDC team, Illkirch, France
2
Strasbourg University, Strasbourg, France
Keywords:
Ontology, Data Integration, Data Visualization, Intelligibility.
Abstract:
The work described in this paper is part of the IDEX (excellence initiative) project “Complex Identities”
launched by Strasbourg University in 2015. The main goal is to map available knowledge in Strasbourg uni-
versity in order to provide a comprehensive and structured view of its different components. Our approach
consists, first, in building an ontology able to represent available knowledge in the university, making it un-
derstandable by users. Then, we are interested in visualizing the ontology to help users explore easily the
represented knowledge.
1 INTRODUCTION
Strasbourg University
1
is the second largest university
in France. It was founded on 1st January 2009 after
the fusion of the three former universities in the city:
Louis Pasteur, Marc Bloch and Robert Schuman. It
has more than 46000 students, almost 2800 lecturers
and lecturers-researchers, more than 2000 library, en-
gineering, administration, technical and health staff,
37 education and research departments (UFR), facul-
ties, schools and institutes, 6 libraries and 79 research
units. European by nature and international by design,
the University’s fundamental training and research
goals include forging partnerships with universities
on a European and international scale. It is a mem-
ber of several university networks in Europe such as
the Upper Rhine University (EUCOR)
2
, the League
of European Research Universities (LERU)
3
. . . . The
University’s strengths and assets stem from its active
involvement in virtually every discipline comprising
the current body of knowledge. This interdisciplinar-
ity, the constantly increasing number of students and
professors as well as the European exchanges make
Strasbourg University a complex institution.
Being part of the university, is being able to get ac-
cess to the university resources and knowledge. This
1
http://www.unistra.fr/index.php?id=accueil
2
http://www.eucor-uni.org/en/2016/01/18/
upper-rhine-cluster-sustainability-research
3
http://www.leru.org/index.php/public/home/
knowledge must be understandable for everyone. But
within the university, we are confronted daily to a
large number of logos and meaningless acronyms as
well as to structures that have each one their own data
repositories making the understanding of knowledge
difficult. In addition to that, this data is stored in dif-
ferent spreadsheets, databases or other media where
each document adopts its own data representation.
Although this heterogeneity and this diversity
make the university a rich institution, they fail to facil-
itate the access to the knowledge on the one hand and
to make the university intelligible and understandable
in its signs, concepts and structures on the other.
For that reason, it is mandatory to find a solution
where a unified vocabulary can be adopted to make
the different resources of the university understand-
able.
In order to ensure the readability and the intelligi-
bility of Strasbourg University, the IDEX (excellence
initiative) project “Complex identities” was launched
in January 2015. The main goal of the project is
to enhance the readability of Strasbourg university,
by proposing a unified representation of the available
knowledge.
This is a large scale project, for that reason it
has been scheduled in several phases. We intervened
during the second phase of the project to model the
knowledge map of the university. One of the outputs
of the first phase is a “graphic-lexicon” which defines
and identifies the different structures of the university.
After studying this “graphic-lexicon”, we noticed that
Essaid, A., Thi, Q. and Zanni-Merk, C.
Data Integration and Visualization for Knowledge Mapping in Strasbourg University.
DOI: 10.5220/0006069301630170
In Proceedings of the 8th International Joint Conference on Knowledge Discovery, Knowledge Engineering and Knowledge Management (IC3K 2016) - Volume 2: KEOD, pages 163-170
ISBN: 978-989-758-203-5
Copyright
c
2016 by SCITEPRESS – Science and Technology Publications, Lda. All rights reserved
163

this glossary does not establish links between the var-
ious structures of the university, because it just keeps
a flat structure, not even hierarchical among compo-
nents. Therefore, we built an ontology to define all the
concepts associated to structures of the university as
well as all the relationships between these concepts.
Specific visualization tools were developed to help
surf over the individuals of the ontology, guided by
the ontology structure.
This article is organized as follows: In section 2,
we present the ontology we constructed. This on-
tology addressed the shortcomings discovered in the
“graphic-lexicon”. Section 3 is devoted to the visu-
alization of our ontology. In section 4 we give the
main tools that we used for implementation. Finally,
in Section 5 we conclude and give some perspectives
of future work.
2 ONTOLOGIES FOR DATA
INTEGRATION
As stated in the introduction, in the first phase of the
project, a “graphic-lexicon” was developed. It is like
a glossary where the concepts related to Strasbourg
university were identified and defined. This glossary
represents a reference for the users and guarantees a
better understanding of the university. It has been de-
veloped using the information system of the univer-
sity as a basis. Figure 1 shows a sample of the estab-
lished “graphic-lexicon”.
We have to note that as this project concerns a
french university the “graphic-lexicon” as well as the
screen shots of the visualization of the ontology are
in french. In section 2, we illustrate the constructed
ontology, the classes and relations are in english.
Although this glossary presents comprehensive in-
formation and lists all the structures composing the
university, such as the campuses, buildings, graduate
schools, university museums . . . , it fails to underline
the relations between the different structures and does
not emphasize the hierarchy or composition links that
can exist between two components. For example, the
relationship “one campus consists of buildings” does
not appear in the “graphic-lexicon”.
To overcome this problem, we propose to build an
ontology for describing Strasbourg University. Ac-
cording to the literature, an ontology is “an explicit
specification of a conceptualization” (Gruber, 1993)
or “a shared understanding of some domain of inter-
est” (Uschold and Gruninger, 1996).
The advantage of using ontologies in this project
is twofold: on the one hand, it will permit to have an
integrated vocabulary, understandable and shared by
all users; on the other hand, strict logical formaliza-
tion associated with ontologies will permit to detect
inconsistencies, if any.
In addition to describing the different concepts re-
lated to Strasbourg university, this ontology will al-
low the specification of the existing links that exist
between the different structures and will ease the nav-
igation over the individuals, in order to find a certain
required information.
When constructing the ontology, we faced some
problems. In fact, we noticed that the “graphic-
lexicon” is incomplete; some information is missing
or some definitions are not given. Engineering pro-
cedures were implemented to recover the missing in-
formation (exhaustive research in the website of the
University, interviews with the officials in charge of
the university information system, or queries to the
databases to which we had access). The methodology
described in (Noy and McGuinness, 2001) has been
used for the development of the ontology.
During the design phase, we opted to distinguish
between two parts. The first concerns the campus life.
It models the different campuses and the facilities of-
fered by the university (libraries, students’ associa-
tions, . . . ). The second part concerns education and
research within the university. In fact, our ontology
models:
• the various study units (faculties, institutes, . . . )
as well as the research units (laboratories, . . . ).
• the degree programmes and courses offered for all
educational levels.
• all the aspects regarding doctoral training, and in
particular, the PhD theses that were defended with
the associated information (committees, labora-
tory, supervisors, . . . ).
• the different university services
As our ontology is of large number of concepts
and properties, we present for each part (campus
life, degrees awarded . . . ) its corresponding excerpt.
For this representation, we used OWLGrEd (Barzdins
et al., 2010) which extends UML class diagram nota-
tion with additional constructs for representing OWL
features. The yellow rectangles are used in this ex-
cerpt as UML classes. The hierarchical relation is
represented by thick lines. The datatype property is
represented as a label inside the class box and the ob-
ject property as an association. The tool OWLGrEd
helps to show very well the conceptual structure of
the ontology. Figure 2 presents an excerpt of our on-
tology. In this excerpt, we show only the concepts
of the highest level of Strasbourg University such as
campuses, buildings, branches, collegiums, . . . .
KEOD 2016 - 8th International Conference on Knowledge Engineering and Ontology Development
164
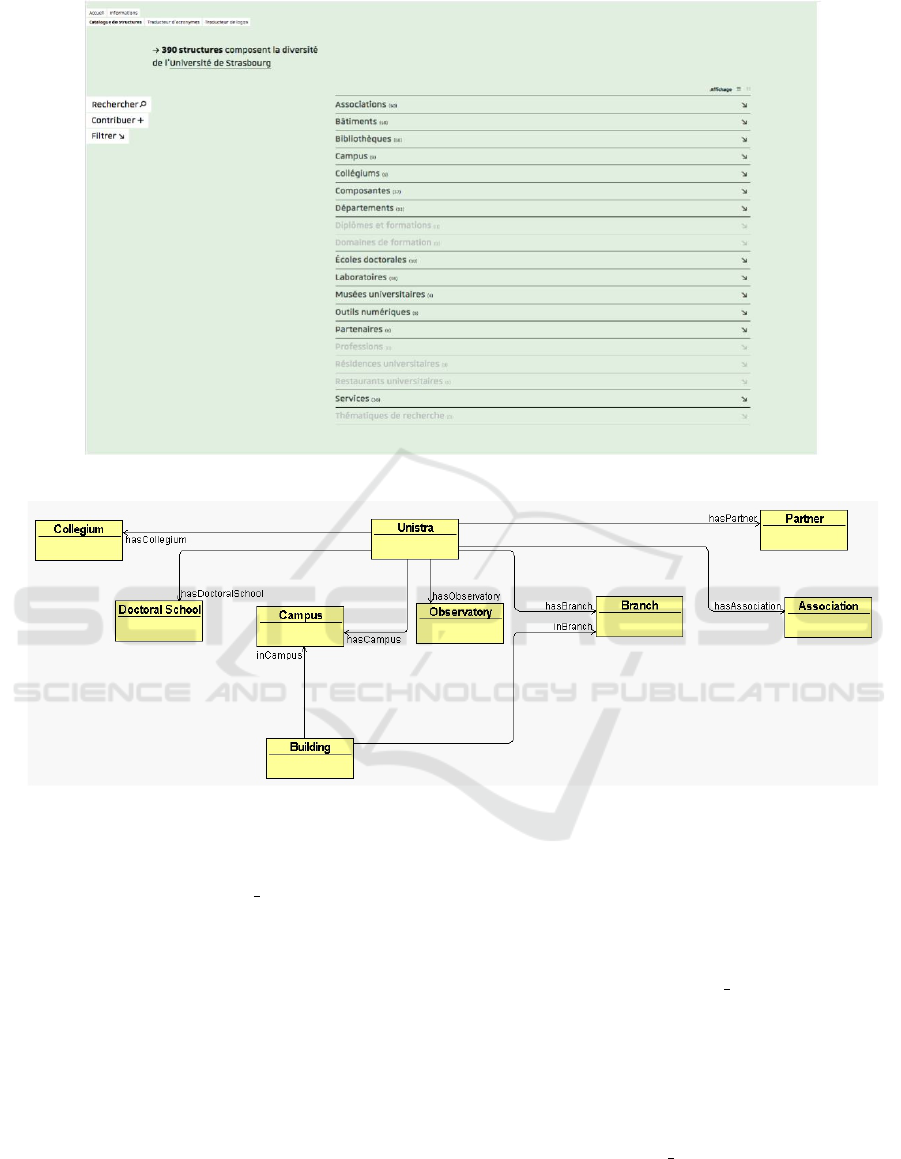
Figure 1: A graphic-lexicon for Strasbourg University.
Figure 2: An excerpt of the ontology of Strasbourg University.
Unistra is the class representing Strasbourg Uni-
versity. Unistra is composed of many structures
(campus, collegium, Doctoral school, Association,
Branch, . . . ). In this excerpt, we have many associ-
ations which describe the object properties. For ex-
ample, the association hasCampus relates Unistra to
Campus.
Ob jectProperty : < hasCampus >
Class : < Unistra >
Class : < Campus >
The current version of the ontology has 110 con-
cepts, 89 subsumption relationships, 37 composition
or association relationships and more than 3000 indi-
viduals. Next subsections present the most important
sub-ontologies in detail.
2.1 The Campus Life
The figure 3 represents a subontology related to the
campus life in Strasbourg University where these
campuses are composed of building and each build-
ing is composed of parts that can be a department, a
library, a museum or a research team.
In the following, we give a description of the hier-
archic relations in OWL.
Department v Part
Library v Part
Museum v Part
Research Team v Part
hasPart is an object property between the two classes
Data Integration and Visualization for Knowledge Mapping in Strasbourg University
165
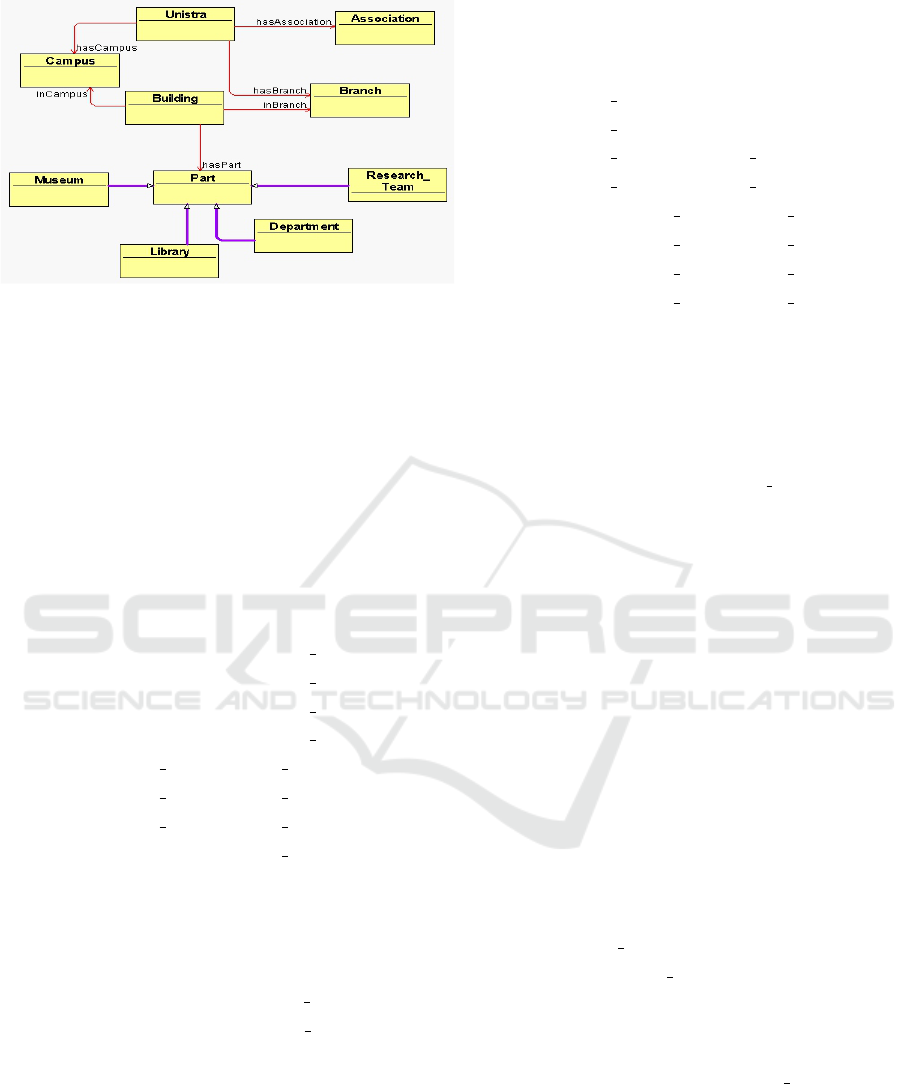
Figure 3: An excerpt representing the campus life in Stras-
bourg University.
Building and Part. It is defined as:
Ob jectProperty : < hasPart >
Class : < Building >
Class : < Part >
2.2 Study and Research Units
In this subsection, we present the research and study
units of Strasbourg University as represented in fig-
ure 4. There are different types of research and study
units which are described as follows.
UMR v Research Units
USR v Research Units
UPR v Research Units
EA v Research Units
Faculty Team v Study Units
IUT Team v Study U nits
Institute Team v Study Units
School v Study Units
Each research unit is attached to a doctoral school
and is related to a collegium. These two associations
are described as follows:
Ob jectProperty : < attachedTo >
Class : < Research Units >
Class : < Doctoral School >
2.3 The Degrees Awarded
In this subsection, we present the sub-ontology re-
lated to the degree programmes and courses offered
for all educational levels. See figure 5 for an illustra-
tion.
Strasbourg University offers two kinds of stud-
ies: studies leading to a diploma and studies,like the
preparation for a certificate or a competition, not lead-
ing to a diploma. In the following we present in OWL
some hierarchic relation as well as some associations.
with Diploma v Study
without Diploma v Study
University Diploma v with Diploma
National Diploma v with Diploma
cycle 0 v National Diploma
cycle 1 v National Diploma
cycle 2 v National Diploma
cycle 3 v National Diploma
Ob jectProperty : < o f f ers >
Class : < Unistra >
Class : < Study >
Ob jectProperty : < ensures >
Class : < Study Units >
Class : < Study >
2.4 The Theses and Their Environment
In figure 6, we present the aspects regarding PhD the-
ses, and in particular, those that were defended with
the associated information (supervisor, PhD student,
. . . ) There are three kinds of lecturers: Research-
lecturer, non research lecturer and a part time lecturer.
Only the research lecturer has the possibility to su-
pervise a thesis. At Strasbourg university, there are
two types of theses: PhD thesis and a thesis defended
in the health domain (medicine, pharmacy, . . . ). We
represent only the PhD students who defend a thesis.
This thesis is done in a research unit and must be at-
tached to a doctoral school. In the following, we give
a description of the sub-ontology in OWL.
Researcher v Lecturer
Non Researcher v Lecturer
Part Time v Lecturer
Ob jectProperty : < attachedTo >
Class : < Student >
Class : < Research Unit >
3 ONTOLOGY VISUALIZATION
Providing users with visual representations and intu-
itive user interfaces can significantly aid the under-
standing of the knowledge represented by ontologies.
KEOD 2016 - 8th International Conference on Knowledge Engineering and Ontology Development
166
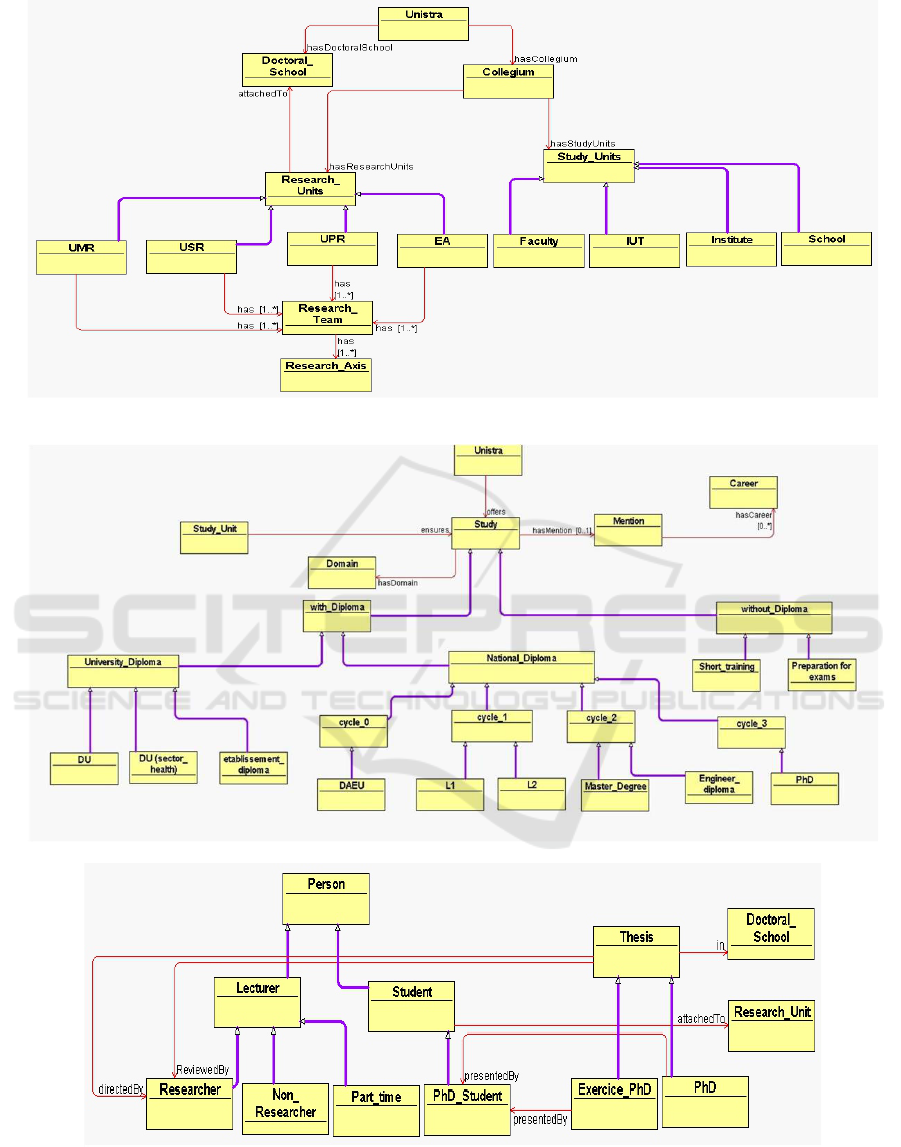
Figure 4: An excerpt representing the study and research units in Strasbourg University.
Figure 5: Degrees in Strasbourg University.
Figure 6: Theses in Strasbourg University.
This is exactly the case of the our constructed ontol-
ogy.
Ontology visualization is not a new topic and a
number of approaches have become available in re-
Data Integration and Visualization for Knowledge Mapping in Strasbourg University
167

cent years particularly in the field of ontology model-
ing. However, few of them provide a clear graphical
user interface with navigational aids or comprehen-
sive visualization techniques. For an exhaustive state
of the art, the reader may refer to (Dud
´
as et al., 2014;
Katifori et al., 2007; Lanzenberger et al., 2009).
For our specific needs (an easy tool for non ex-
perts to navigate over the individuals of the ontology)
we have chosen to visualize ontologies with VOWL
(Lohmann et al., 2014b) and to use especially We-
bVOWL which is a web implementation of VOWL
(Lohmann et al., 2015).
VOWL, the Visual Notation for OWL ontolo-
gies, is a visual language for representing ontolo-
gies. Based on graphical primitives and color scheme,
VOWL is able to visualize classes, properties and
datatypes. Classes are represented by circles where
the size of each circle depends on the number of the
individuals of the represented class. Lines are used
to represent properties. Property labels and datatypes
are shown in rectangles. To demonstrate its appli-
cability, VOWL was implemented in two different
tools: Prot
´
eg
´
eVOWL (Lohmann et al., 2014a) and We-
bVOWL. The former is a VOWL plugin for the Prot
´
eg
´
e
editor while the latter is a standalone web application.
As part of this project, we used WebVOWL as our aim
is to propose an application for university users.
Once the software is launched, only a circle rep-
resenting Strasbourg University is displayed as shown
in figure 7. By a simple click on this circle, we can see
the different structures composing Strasbourg Univer-
sity such as (campuses, collegiums . . . ) as described
in figure 8. A click on one of these structures allows
the user to have more details about the different com-
ponents of the structure itself as well as the individu-
als if there are any. The individuals are displayed on
the right side bar. Figures 9 and 10 show the compo-
nents of campuses and theses respectively.
In addition to visualizing all the classes and prop-
erties of our ontology, we are interested in visualizing
individuals through creating a graph able to highlight
different pieces of information related to a specific
individual. In figure 11, we display the information
related to a specific thesis (the different committee
members, the PhD student . . . )
4 IMPLEMENTATION
As university data is stored in different spreadsheets
and databases, a thorough study was handled to depict
the different classes, properties as well as datatypes.
We used Prot
´
eg
´
e 5.0.0
4
, as the most popular and
widely used tool for ontology development. It is a
free open-source tool developed by Standford univer-
sity. It gains popularity because it offers to users a set
of packages for editing and visualizing ontologies.
As already mentioned, we used WebVOWL (ver-
sions 0.5.2) for visualization. As it is a standalone
application, the OWL ontology is converted into a
VOWL-JSON file proper to WebVOWL. At the time
being, WebVOWL is able to visualize classes, prop-
erties and datatypes. To visualize individuals, we
created a second VOWL-JSON file containing all the
information related to individuals. In order to get
the expected result visualization, we made some im-
provements on WebVOWL. These improvements will
be subject of a further paper.
5 CONCLUSION
The IDEX (excellence initiative) project “Complex
Identities” is a large scale project. Its main goal is
to ensure the intelligibility of the university through
providing a comprehensive and structured view of its
different components. In this paper, we presented our
solution of creating a knowledge mapping based on
ontologies. We described in detail this ontology and
how it has been constructed. To visualize the ontol-
ogy we used the WebVOWL tool which helps users to
explore easily the represented knowledge. Although
we have not been able to get access to all the existing
databases, we think that given the constructed ontol-
ogy and the visualization results we have been able to
achieve the objectives of this project. However, an ex-
haustive experimentation protocol is being setup dur-
ing the new academic year 2016-2017, for validation
of the correctness of the enriched ontology and evalu-
ation of the ergonomics of the proposed visualisation
tools.
As this is a large scale project, many other re-
search works will be launched in the future. On the
one hand, we will focus on reasoning tasks across the
ontology to respond to users’ queries. Discovering
new information through the navigation across the on-
tology is another research axis.
ACKNOWLEDGEMENTS
This work was supported by Strasbourg University.
It is carried out in collaboration with the Faculty of
Fine Arts and the Communication service. Special
4
http://protege.stanford.edu/
KEOD 2016 - 8th International Conference on Knowledge Engineering and Ontology Development
168
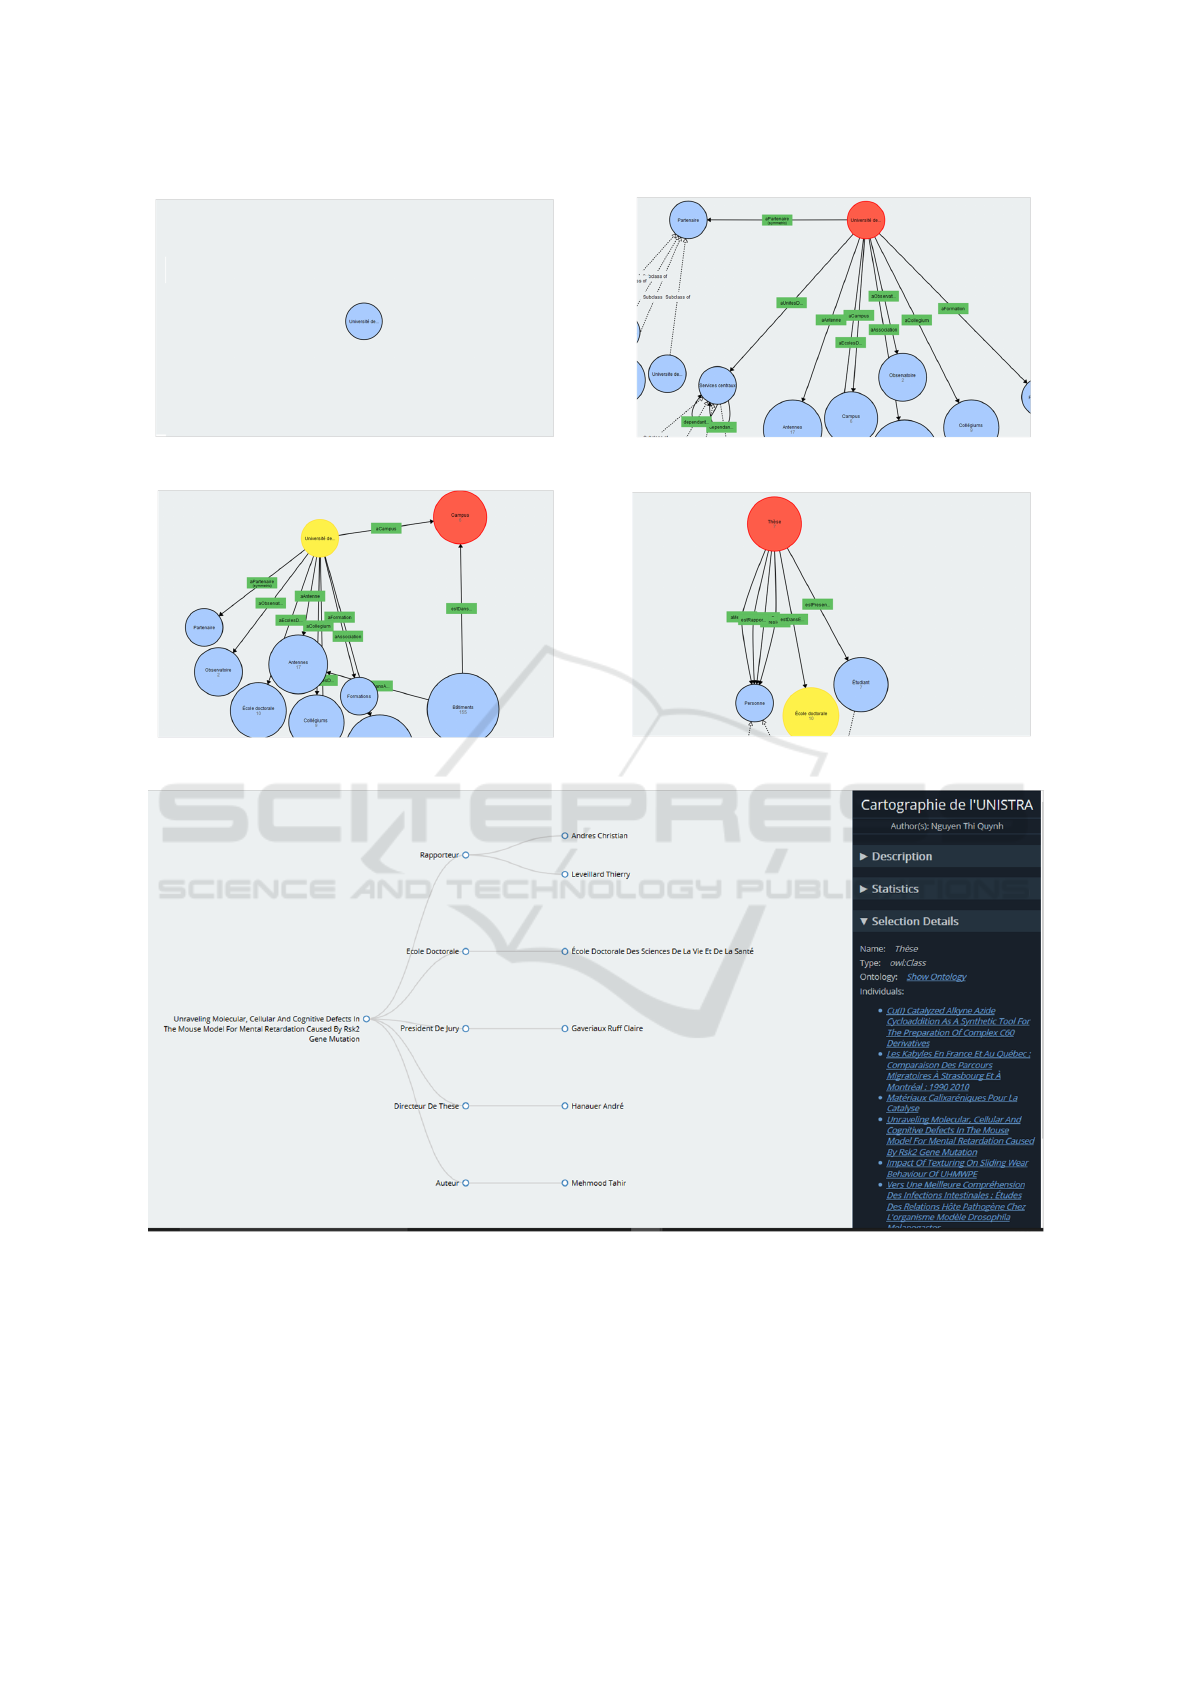
Figure 7: First knowledge map interface.
Figure 8: Main structures of Strasbourg University.
Figure 9: Campus life in Strasbourg University.
Figure 10: Aspects regarding doctoral training.
Figure 11: A thesis information.
thanks go to Pierre Litzler, Najman Faustine, Laurie
Chapotte and Olivier Kohtz.
REFERENCES
Barzdins, J., Barzdins, G., Cerans, K., Liepins, R., and
Sprogis, A. (2010). Owlgred: a UML style graphi-
cal notation and editor for OWL 2. In Proceedings of
the 7th International Workshop on OWL: Experiences
Data Integration and Visualization for Knowledge Mapping in Strasbourg University
169

and Directions (OWLED).
Dud
´
as, M., Zamazal, O., and Sv
´
atek, V. (2014). Roadmap-
ping and navigating in the ontology visualization
landscape. In 19th International Conference in
Knowledge Engineering and Knowledge Management
(EKAW’2014), pages 137–152.
Gruber, T. (1993). A translation approach to portable ontol-
ogy specifications. Knowledge Acquisition, 5(2):199
– 220.
Katifori, A., Halatsis, C., Lepouras, G., Vassilakis, C.,
and Giannopoulou, E. (2007). Ontology visualization
methods - a survey. ACM Computer Surveys, 39(4).
Lanzenberger, M., Sampson, J., and Rester, M. (2009). Vi-
sualization in ontology tools. In Barolli, L., Xhafa,
F., and Hsu, H., editors, International Conference on
Complex, Intelligent and Software Intensive Systems,
(CISIS’09), pages 705–711. IEEE Computer Society.
Lohmann, S., Link, V., Marbach, E., and Negru, S. (2015).
Webvowl: Web-based visualization of ontologies. In
Knowledge Engineering and Knowledge Management
- EKAW 2015, pages 154–158.
Lohmann, S., Negru, S., and Bold, D. (2014a). The
prot
´
eg
´
evowl plugin: Ontology visualization for ev-
eryone. In The Semantic Web: ESWC 2014 Satellite
Events, pages 395–400.
Lohmann, S., Negru, S., Haag, F., and Ertl, T. (2014b).
VOWL 2: User-oriented visualization of ontologies.
In 19th International Conference in Knowledge En-
gineering and Knowledge Management, EKAW 2014,
pages 266–281.
Noy, N. F. and McGuinness, D. L. (2001). Ontology devel-
opment 101: A guide to creating your first ontology.
Technical report.
Uschold, M. and Gruninger, M. (1996). Ontologies: Princi-
ples, methods and applications. Knowledge Engineer-
ing Review, 11(2).
KEOD 2016 - 8th International Conference on Knowledge Engineering and Ontology Development
170
