
A Linear-dependence-based Approach to Design
Proactive Credit Scoring Models
Roberto Saia and Salvatore Carta
Dipartimento di Matematica e Informatica, Universit
`
a di Cagliari, Cagliari, Italy
Keywords:
Business Intelligence, Credit Scoring, Fraud Detection, Data Mining, Metrics.
Abstract:
The main aim of a credit scoring model is the classification of the loan customers into two classes, reliable and
unreliable customers, on the basis of their potential capability to keep up with their repayments. Nowadays,
credit scoring models are increasingly in demand, due to the consumer credit growth. Such models are usually
designed on the basis of the past loan applications and used to evaluate the new ones. Their definition repre-
sents a hard challenge for different reasons, the most important of which is the imbalanced class distribution
of data (i.e., the number of default cases is much smaller than that of the non-default cases), and this reduces
the effectiveness of the most widely used approaches (e.g., neural network, random forests, and so on). The
Linear Dependence Based (LDB) approach proposed in this paper offers a twofold advantage: it evaluates a
new loan application on the basis of the linear dependence of its vector representation in the context of a ma-
trix composed by the vector representation of the non-default applications history, thus by using only a class
of data, overcoming the imbalanced class distribution issue; furthermore, it does not exploit the defaulting
loans, allowing us to operate in a proactive manner, by addressing also the cold-start problem. We validate our
approach on two real-world datasets characterized by a strong unbalanced distribution of data, by comparing
its performance with that of one of the best state-of-the-art approach: random forests.
1 INTRODUCTION
The actions related to a lending process typically in-
volve two entities: the institution that provides the
loan, and the customer that benefits from it. Such
process starts from a loan application and it ends with
the repayment (or not repayment) of the loan. If, on
the one hand, the retail lending represents one of the
most profitable source for the financial operators, on
the other hand, the increase of the loans is directly re-
lated to the increase of the number of defaulted cases,
i.e., fully or partially not repaid loans.
Briefly, the credit scoring is used to classify the
loan customers into two classes, accepted or rejected,
on the basis of the available information. It is there-
fore an important tool for the financial operators,
since it allows them to reduce the financial losses,
as stated in (Henley et al., 1997). More formally,
credit scoring can be defined as a statistical technique
aimed to predict the probability that a loan applica-
tion (from now on named as instance) leads toward a
default (Mester et al., 1997), thus it is used to decide
if a loan should be granted to a customer (Morrison,
2004).
The analysis performed by the credit scoring is
also useful to evaluate the credit risk (i.e., probabil-
ity of loss from a customer's default), because it takes
into account all the factors that contribute to determi-
nate it (Fensterstock, 2005). It presents some other
advantages, such as the reduction of the credit analy-
sis cost, a quick response time in the credit decisions,
and the possibility to perform a punctual monitoring
of the credit activities (Brill, 1998).
indent Such as it occurs in other similar contexts, e.g.,
fraud detection (Pozzolo et al., 2014), the develop-
ment of effective approaches for credit scoring comes
up against a big problem: the unbalanced distribu-
tion of data. It happens because the number of neg-
ative cases (i.e., default instances) is typically much
smaller than the positive ones (i.e., non-default in-
stances), configuring a highly unbalanced distribution
of data (Batista et al., 2004) that reduces the effec-
tiveness of the machine learning strategies (Japkow-
icz and Stephen, 2002).
The vision behind this paper is to represent the in-
stances as a vector space, and to define a metric able
to evaluate, in this space, the correlation between a
new instance and the other previous non-default ones,
Saia, R. and Carta, S.
A Linear-dependence-based Approach to Design Proactive Credit Scoring Models.
DOI: 10.5220/0006066701110120
In Proceedings of the 8th International Joint Conference on Knowledge Discovery, Knowledge Engineering and Knowledge Management (IC3K 2016) - Volume 1: KDIR, pages 111-120
ISBN: 978-989-758-203-5
Copyright
c
2016 by SCITEPRESS – Science and Technology Publications, Lda. All rights reserved
111

in order to evaluate its level of reliability.
This metric is based on the concept of linear de-
pendence between vectors, considering that a set of
vectors is linearly independent if no vector in it can
be defined as a linear combination
1
of the other ones,
we believe that if the vector representation of a new
instance is linearly dependent to the vector represen-
tations of the previous non-default ones, we can con-
sider it as reliable.
We perform this process by calculating the deter-
minant of the matrix composed by the vector repre-
sentation of the past non-default instances and that of
a new instance to evaluate, by placing its vector rep-
resentation as the last row of the matrix. Whereas the
determinant does not exist for the non-square matri-
ces, we introduce a criterion that allows us to extend
this calculation even to these cases.
Given that in most of the cases reported in the
literature (Lessmann et al., 2015; Brown and Mues,
2012; Bhattacharyya et al., 2011) the Random Forests
approach outperforms the other ones in this context,
we will compare the proposed approach only to this
one.
The main contributions of this paper to the state
of the art are the following:
(i) formalization of the Average of Sub-matrices
Determinants (ASD) criterion used to evaluate
the linear dependence of the vector representa-
tion of an instance in a vector space, also when
it configures a non-square matrix that not allows
us to calculate its determinant;
(ii) calculation of the Reliability Band β, which
gives us information about the linear depen-
dence variations in an ASD process that only in-
volves non-default instances;
(iii) definition of the Linear Dependence Based
(LDB) approach of evaluation of new instances,
performed by exploiting the β information to
classify them as accepted or rejected;
(iv) demonstration of how the LDB approach is
able to achieve very similar (or better) results
in terms of performance, when compared to
a state-of-the-art approach such as Random
Forest, by working in a proactive manner (i.e.,
without using default cases), overcoming the
cold-start and the imbalanced class distribution
problems.
This paper is organized as follows: Section 2 dis-
cusses the background and related work; Section 3
1
When one of the vectors is a scalar multiple of the
other.
provides a formal notation and defines the problem
faced in this paper; Section 4 describes the implemen-
tation of our credit scoring system; Section 5 provides
details on the experimental environment, the adopted
datasets and metrics, as well as on the used strat-
egy and the experimental results; Some concluding
remarks and future work are given in Section 6.
2 BACKGROUND AND RELATED
WORK
A large number of credit scoring classification tech-
niques has been proposed in literature (Doumpos and
Zopounidis, 2014), as well as many studies aimed
to compare their performance on the basis of several
datasets, such as in (Lessmann et al., 2015), where
a large scale benchmark of 41 classification meth-
ods has been performed, across eight credit scoring
datasets.
The problem of choosing the most suitable ap-
proach of classification, and tuning its parameters in
the best way, has been faced in (Ali and Smith, 2006),
which also reports some interesting considerations
about the canonical metrics of performance used in
this context (Hand, 2009).
2.1 Credit Scoring Models
Most of the statistical and data mining techniques
at the state of the art can be used in order to build
credit scoring models (Chen and Liu, 2004; Alborzi
and Khanbabaei, 2016), e.g., linear discriminant mod-
els (Reichert et al., 1983), logistic regression mod-
els (Henley, 1994), neural network models (Desai
et al., 1996; Blanco-Oliver et al., 2013), genetic pro-
gramming models (Ong et al., 2005; Chi and Hsu,
2012), k-nearest neighbor models (Henley and Hand,
1996) and decision tree models (Davis et al., 1992;
Wang et al., 2012).
These techniques can also be combined (Wang
et al., 2011) to create hybrid approaches of credit
scoring, as that proposed in (Lee and Chen, 2005),
based on a two-stage hybrid modeling procedure with
artificial neural networks and multivariate adaptive re-
gression splines, or that presented in (Hsieh, 2005),
based on neural networks and clustering methods.
2.2 Imbalanced Class Distribution
A complicating factor in the credit scoring process
is the imbalanced class distribution of data (He and
Garcia, 2009), caused by the fact that the default
classes (default instances) are much smaller than the
KDIR 2016 - 8th International Conference on Knowledge Discovery and Information Retrieval
112

other ones (non-default instances). Such distribution
of data reduces the performance of the classification
techniques, as reported in the study made in (Brown
and Mues, 2012).
Another study about the introduction of misclas-
sification costs during the processes of scorecard con-
struction and classification was performed in (Vin-
ciotti and Hand, 2003), where the authors have also
discussed the possibility of preprocessing the dataset
of training, by performing an over-sampling or an
under-sampling of the classes. The application of
the over-sampling and under-sampling processes has
been studied in depth in (Marqu
´
es et al., 2013; Crone
and Finlay, 2012).
In this paper we do not perform any class balanc-
ing, since our intention is to evaluate the proposed
approach in the context of an unaltered real-world
dataset.
2.3 Cold Start
The cold start problem (Zhu et al., 2008; Donmez
et al., 2007) arises when there are not enough infor-
mation to train a reliable model about a domain (Lika
et al., 2014; Son, 2016; Fern
´
andez-Tob
´
ıas et al.,
2016).
In the credit scoring context, this happens when
there are not many instances related to the credit-
worthy and non-credit-worthy customers (Attenberg
and Provost, 2010; Thanuja et al., 2011).
Considering that, during the model definition, the
proposed approach does not exploit the data about
the defaulting loans, it is able to reduce/overcome the
aforementioned issue.
2.4 Random Forests
Random Forests represent an ensemble learning
method for classification and regression that is based
on the construction of a number of randomized deci-
sion trees during the training phase and it infers con-
clusions by averaging the results. Since its formal-
ization (Breiman, 2001), it represents one of the most
common techniques for data analysis, because it of-
fers better performance in comparison with the other
state-of-the-art techniques.
It allows us to face a wide range of prediction
problems, without performing any complex configu-
ration, since it only requires the tuning of two param-
eters: the number of trees and the number of attributes
used to grow each tree.
2.5 Matrices, Linearity, and Vector
Spaces
The concepts of matrix determinant, linearity, and
vector spaces, cover a primary role in this paper, since
we use them to formalize and prove the correctness of
the proposed similarity metric based on the linear de-
pendence between vectors.
The matrix determinant (det) is a mathematical
function that assigns a number to every square ma-
trix, so its domain is the set of square matrices, and
its range is the set of numbers; more formally, we can
write that det : ℜ
n
× ... × ℜ
n
→ ℜ.
Regardless of the method used to calculate the de-
terminant of a square matrix N × N (e.g., by the Leib-
niz formula shown in Equation 1, where sgn is the
sign function of permutations σ in the permutation
group S
N
, which returns +1 and -1, respectively for
even and odd permutations), its value is related to the
relation of linear dependence between the vectors that
compose the matrix.
det
m
1,1
m
1,2
... m
1,N
m
2,1
m
2,2
... m
2,N
.
.
.
.
.
.
.
.
.
.
.
.
m
N,1
m
N,2
... m
N,N
=
∑
σ∈S
N
sgn(σ)
N
∏
i=1
m
i,σ
i
(1)
The dependence of the N vectors can be verified
by calculating the determinant of the N × N matrix
built by placing, one after the other, the n-tuples that
express the vectors in a certain base. The vectors
are independent when the determinant of the matrix
is different from zero.
A vector space (or linear space) is a mathemati-
cal structure composed by a collection of vectors that
may be added together and multiplied (or, more cor-
rectly, scaled) by numbers called scalars. In other
words, a vector space V is a set that is closed under fi-
nite vector addition and scalar multiplication. A vec-
tor sub-space (or linear sub-space) is a vector space
that represents a subset of some other vector space of
higher dimension.
3 NOTATION AND PROBLEM
DEFINITION
This section introduces the notation adopted and de-
fines the problem faced by our approach.
3.1 Notation
Given a set of classified instances T = {t
1
,t
2
,. .. ,t
N
},
and a set of fields F = { f
1
, f
2
,. .. , f
X
} that compose
A Linear-dependence-based Approach to Design Proactive Credit Scoring Models
113

each t, we denote as T
+
⊆ T the subset of non-default
instances, and as T
−
⊆ T the subset of default ones.
We also denote as
ˆ
T = {
ˆ
t
1
,
ˆ
t
2
,. .. ,
ˆ
t
M
} a set of un-
classified instances, and as E = {e
1
,e
2
,. .. , e
M
} these
instances after the classification process, thus |
ˆ
T | =
|E|.
Each instance can belong to one class c ∈C, where
C = {accepted,re jected}.
3.2 Problem Definition
On the basis of the linear dependence, measured by
calculating the determinant of the matrices composed
by the vector representation of the non-default in-
stances in T
+
and that of the unclassified instances in
ˆ
T , we classify each instance
ˆ
t ∈
ˆ
T as accepted or re-
jected, by exploiting a Band of Reliability β, defined
on the basis of the proposed LDB approach.
Given a function eval(
ˆ
t,β) used to evaluate the
classification performed by exploiting the β informa-
tion, which returns a boolean value σ (0=wrong clas-
sification, 1=correct classification), our objective can
be formalized as the maximization of the results sum,
as shown in Equation 2.
max
0≤σ≤|
ˆ
T |
σ =
|
ˆ
T |
∑
m=1
eval(
ˆ
t
m
,β) (2)
4 OUR APPROACH
The implementation of our strategy is carried out
through the following steps:
1. Data Normalization: normalization of the F val-
ues in a range [0, 1], to make homogeneous the
range of involved values, regardless to the consid-
ered field or dataset, without losing information;
2. ASD Definition: definition of the Average of Sub-
matrices Determinants (ASD) criterion, used to
evaluate the linear dependence in a square and
non-square matrix of vectors;
3. Reliability Band Calculation: calculation of the
Reliability Band β, on the basis of the ASD crite-
rion, an information used to evaluate the level of
reliability of the new instances;
4. Instances Classification: formalization of the
Linear Dependence Based (LDB) process needed
to classify (as accepted or rejected) a set of
unevaluated instances, by exploiting the ASD
criterion and the β information.
Data
Normalization
ASD
Process
β
Calculation
ˆ
T
Classification
Variations
Calculation
T
+
ˆ
T
E
(T
+
,
ˆ
T )
(T
+
,T
+
)
(T
+
,T
+
)
β
(T
+
,
ˆ
T )
∆
Figure 1: LDB - High-level Architecture.
In the following, we provide a detailed descrip-
tion of each of these steps, since we have introduced
the high-level architecture of the proposed LDB ap-
proach. It is presented in Figure 1, where T
+
,
ˆ
T ,
and E, denote, respectively, the set of non-default in-
stances, the set of instances to evaluate, and the set
of classified instances at the end of the process (i.e.,
those in
ˆ
T ).
4.1 Data Normalization
As first step, we normalize all values F in the datasets
T and
ˆ
T in a range [0, 1]. It allows us to make homo-
geneous the range of involved values, regardless to
the considered field or dataset. Such operation could
be also useful in order to avoid potential problems
during the determinant calculation, e.g., overflow, in
case of very large matrices, by using certain software
tools (Moler, 2004).
The process of normalization of a generic value
f
x
∈ F related to an instance t ∈ T is reported in Equa-
tion 3 (the same goes for the set
ˆ
T ).
f
x
=
1
∑
∀ f
x
∈T
f
x
· f
x
(3)
4.2 ASD Definition
Given that there is not a mathematical definition of de-
terminant of a non-square matrix, here we introduce
the Average of Sub-matrices Determinants criterion
(ASD), which allows us to extract this information in
all cases (square and non-square matrices).
It calculates the average of the determinants of
all square sub-matrices obtained by dividing the non-
KDIR 2016 - 8th International Conference on Knowledge Discovery and Information Retrieval
114

default instance history matrix of size |T
+
| × |F| in α
square sub-matrices, whose number depends on the
rule shown in Equation 4.
The additional element added to the set T
+
will
be used to evaluate an instance in the context of the
vector space of the other instances that composed the
matrix.
α =
j
|F|
(|T
+
| + 1)
k
, i f |F| ≥ (|T
+
| + 1)
j
|T
+
| + 1
|F|
k
, otherwise
(4)
In more detail, we calculate the determinant of
each sub-matrix defined by moving (without over-
laps) on the matrix |F| × (|T
+
| + 1) by using a step
|T
+
| + 1 (i.e., along the rows), or by moving on the
matrix by using a step |F| (i.e., along the columns).
The ASD value is given by the average of all sub-
matrices determinant.
By way of example, if the values are |T
+
| = 1 and
|F| = 6, we have α =
j
6
1 + 1
k
= 3 sub-matrices of
size 2 × 2, and the ASD value is calculated as shown
in the Equation 5.
ASD
a b c d e f
g h i l m n
=
det
a b
g h
+det
c d
i l
+det
e f
m n
3
(5)
From now on, we use the notation ASD(X,Y ) to
denote the Average of Sub-matrices Determinants cal-
culated by using as the last row of the sub-matrices the
vector (or vectors) in the set Y , and for the other rows
the vectors in the set X.
Practically, the ASD value gives us information
about the linear dependence between vector seg-
ments that characterize the same subset of features,
as demonstrated in Theorem 4.2.
Theorem. Given the vector space of the features that
characterize the vector representation of transactions
in a domain, we can express it as sum of two or more
sub-spaces that characterize subsets of features.
Proof. A vector space can be defined as a combi-
nation of sub-spaces by using a decomposition ap-
proach, e.g., given a space ℜ
3
= x-axis+y-axis+
z-axis, we can write any ~w ∈ ℜ
3
as a linear combi-
nation c
1
~v
1
+c
2
~v
2
+c
3
~v
3
(where ~v is a member of the
axis, and c ∈ ℜ), as shown in Equation 6.
w
1
w
2
w
3
= 1·
w
1
0
0
+1·
0
w
2
0
+1·
0
0
w
3
(6)
On the basis of the consideration that ℜ
3
=
x-axis+y-axis+z-axis, we can prove the consistency
2
···
1
|∆|
b
L
min
avg
max
b
H
↑
β
↓
ASD Variations
Figure 2: Reliability Band.
of the proposed ASD approach, since it gives us the
mean value of the determinants calculated on a series
of square sub-matrices composed by segments of vec-
tors that belong to the same vector sub-space of the
items features space.
It simply means that, by the ASD information, we
are able to evaluate subsets of features (in terms of lin-
ear dependence between their vector representations),
and the calculation of the mean value of these results
gives us a single value that reports the relations of
similarity in the entire space of the features, as pre-
viously demonstrated.
It should also be observed that the previous con-
siderations remain valid in both cases considered by
the Equation 4, because the determinant of the trans-
pose of any square matrix is the same determinant of
the original matrix.
4.3 Reliability Band Calculation
Denoting as d(t) the ASD value obtained by using as
rows of the sub-matrices (except the last row) the non-
default instances in T
+
, and as last row a vector t ∈ T
+
,
in Equation 7 we define the set ∆ of ASD variations.
∆ = {d(t
2
)−d(t
1
),d(t
3
)−d(t
2
),... , d(t
N
)−d(t
N−1
)} (7)
The Reliability Band, denoted as β, is defined by
using the average (avg), the minimum (min) and the
maximum (max) value of ∆, as shown in Equation 8.
β = [b
L
,b
H
] = [
avg+min
2
,
avg+max
2
] (8)
It gives us information about the linear depen-
dence variations, when the ASD process involves only
non-default cases. We use it during the evaluation
process, by classifying the cases that generate ASD
variations outside the β band (the dotted area shown
in Figure 2) as potential default cases, according to
the process explained in the following Section 4.4.
A Linear-dependence-based Approach to Design Proactive Credit Scoring Models
115

4.4 Instances Classification
This section starts by formalizing the algorithm used
to perform the Linear Dependence Based (LDB) pro-
cess of classification of an evaluated set of instances
and it ends with the analysis of its asymptotic time
complexity.
4.4.1 Algorithm
The Algorithm 1 takes as input a set T
+
of non-default
instances occurred in the past and a set
ˆ
T of unevalua-
ted instances, returning as output a set E containing
all instances in
ˆ
T , classified as accepted or rejected
on the basis of the ASD process and the β band (i.e.,
by using the b
L
and b
H
values).
Algorithm 1: LDB Instances classi f ication.
Input: T
+
=Set of non-default instances,
ˆ
T =Set of instances to evaluate
Output: E=Set of classified instances
1: procedure INSTANCESCLASSIFICATION(T
+
,
ˆ
T )
2: ASD=getASD(T
+
,T
+
)
3: β=getReliabilityBand(ASD)
4: for each
ˆ
t in
ˆ
T do
5: δ=getASD(T
+
,
ˆ
t
m
) - getASD(T
+
,
ˆ
t
m−1
)
6: if δ ≥ β(b
L
) AND δ ≤ β(b
H
) then
7: E ← (
ˆ
t,accepted)
8: else
9: E ← (
ˆ
t,re jected)
10: end if
11: end for
12: return E
13: end procedure
In step 2 we calculate the ASD value by using
the non-default instances in T
+
as rows of the sub-
matrices (except the last row), and all vectors of the
same set as last row (one at a time), as described in
Section 4.2.
The Reliability Band β (Section 4.3) is calculated
in step 3.
The steps from 4 to 11, process the instances
ˆ
t ∈
ˆ
T ,
by using them to fill the last row of each sub-matrix in
the ASD process, calculating, in the step 5, the varia-
tion δ between two instances, following the criterion
described in Equation 7.
On the basis of the variation δ and the β band,
each instance is classified as accepted or rejected in
the steps from 6 to 10, and the result is placed in the
set E, which is returned at the end of the process (step
12).
Considering that the calculation of the linear de-
pendence variations (step 5) needs at least two in-
stances, when we evaluate the first instance of the set
ˆ
T (or when there is only an instance in this set), we
add an additional instance composed by using the av-
erage of each f ∈ F of the set T
+
, as first instance of
the set
ˆ
T .
For algorithm readability reasons, we omitted this
step, as well as that of the preliminary normalization
of the sets T and
ˆ
T .
4.4.2 Asymptotic Time Complexity Analysis
In view of a possible implementation of the LDB ap-
proach in a real-time scoring system (Quah and Srig-
anesh, 2008), where the response-time factor could
represent an important element, here we define the
theoretical complexity analysis of the Algorithm 1.
We denote as N = α the dimension of the input,
since it is related to the number of sub-matrices
involved in the ASD process, as shown in Equation 4.
Considering that:
(i) the complexity (Big O notation) of the step 2 is
O(N
2
), since it performs the ASD process by us-
ing N instances for N times, i.e., ASD(T
+
,T
+
);
(ii) the complexity of the step 3 is O(1), because it
obtains all needed information at the end of the
previous step 2;
(iii) the complexity of the cycle in the steps 4-11 is
the same of the step 2, because it performs the
same operation by using the items in the set
ˆ
T
instead of the ones of the set T
+
.
On the basis of the previous considerations, it is
clear that the asymptotic time complexity of the algo-
rithm is O(N
2
).
However, it should be noted that the computa-
tional time can be reduced by distributing the process
over different machines, by employing large scale
distributed computing models like MapReduce (Dean
and Ghemawat, 2008).
5 EXPERIMENTS
This section describes the experimental environment,
the used datasets and metrics, the adopted strategy,
and the results of the performed experiments.
5.1 Experimental Setup
The proposed approach was developed in Java, while
the implementation of the state-of-the-art approach,
used to evaluate its performance, was made in R
2
, by
using the randomForest and ROCR packages.
2
https://www.r-project.org/
KDIR 2016 - 8th International Conference on Knowledge Discovery and Information Retrieval
116

Table 1: Datasets.
Dataset Total Cases Non-default Default Attributes Classes
Name |T | |T
+
| |T
−
| |F| |C|
DC 30,000 23,364 6,636 23 2
GC 1,000 700 300 21 2
The experiments have been performed by using
two real-world datasets characterized by a strong un-
balanced distribution of data, i.e., Default of Credit
Card Clients dataset and German Credit datasets,
both available at the UCI Repository of Machine
Learning Databases
3
.
5.2 Datasets
The two real-world datasets used during the experi-
ments have been chosen for two reasons: first, they
represent two benchmarks in this context; second,
they present a strong unbalanced distribution of data.
The datasets are released with all the attributes
modified to protect the confidentiality of the data, and
we use a version suitable for algorithms that, as the
one proposed, can not operate with categorical vari-
ables (i.e., a version with all numeric attributes).
It should be noted that, in case of other datasets
that contain categorical variables, their conversion in
numerical ones is usually a simple task.
5.2.1 Default of Credit Card Clients
The Default of Credit Card Clients dataset (DC) con-
tains 30,000 instances: 23,364 of them are credit-
worthy customers (77.88%) and 6,636 are non-credit-
worthy (22.12%) customers. Each instance contains
23 attributes and a binary class variable (accepted or
rejected).
5.2.2 German Credit
The German Credit (GC) dataset contains 1,000 in-
stances: 700 of them are credit-worthy customers
(70.00%) and 300 are non-credit-worthy (30.00%)
customers. Each instance contains 21 attributes and
a binary class variable (accepted or rejected).
5.3 Metrics
This section presents the metrics used in the experi-
ments.
5.3.1 Accuracy
The Accuracy metric reports the number of instances
correctly classified (i.e., true positives plus true nega-
3
ftp://ftp.ics.uci.edu/pub/machine-learning-databases/
tives), compared to the total number of them. It gives
an overview about the classification performance.
Formally, given a set of instances
ˆ
T to be classi-
fied, it is calculated as shown in Equation 9, where
|
ˆ
T | stands for the total number of instances, and
ˆ
T
(+)
stands for the number of those correctly classified.
Accuracy(
ˆ
T ) =
ˆ
T
(+)
|
ˆ
T |
(9)
5.3.2 F-measure
The F-measure (Powers, 2011) is the weighted aver-
age of the precision and recall metrics . It is a largely
used metric in the statistical analysis of binary classi-
fication and gives us a value in a range [0, 1], where 0
represents the worst value and 1 the best one.
Formally, given two sets X and Y , where X de-
notes the set of performed classifications of instances,
and Y the set that contains the actual classifications of
them, this metric is defined as shown in Equation 10.
F-measure(X,Y ) = 2·
(precision(X,Y )·recall(X ,Y ))
(precision(X,Y )+recall(X ,Y ))
with
precision(X,Y ) =
|Y ∩X |
|X|
, recall(X ,Y ) =
|Y ∩X |
|Y |
(10)
5.3.3 AUC
The Area Under the Receiver Operating Character-
istic curve (AUC) is a performance measure (Faraggi
and Reiser, 2002; Powers, 2011) used to evaluate a
predictive model of credit scoring. Its result is in a
range [0,1], where 1 indicates the best performance.
Given the subset T
+
of non-default instances in the
set T and the subset T
−
of default ones, all possible
comparisons Θ of the scores of each instance t are
reported in the Equation 11, and the AUC metric, by
averaging over these comparisons, can be written as
in Equation 12.
Θ(t
+
,t
−
) =
1, i f t
+
> t
−
0.5, i f t
+
= t
−
0, i f t
+
< t
−
(11)
AUC =
1
T
+
·T
−
|T
+
|
∑
1
|T
−
|
∑
1
Θ(t
+
,t
−
) (12)
5.4 Strategy
In order to minimize the impact of data depen-
dency and improve the reliability of the obtained re-
sults (Salzberg, 1997), the experiments have been per-
formed by following the k-fold cross-validation crite-
rion, with k=10: each dataset is randomly shuffled
and then divided in k subsets; each subset k is used as
A Linear-dependence-based Approach to Design Proactive Credit Scoring Models
117
test set, while the other k-1 subsets are used as training
set; at the end of the process, we consider the average
of results. The datasets' characteristics are summa-
rized in Table 1.
For reasons of reproducibility of the RF experi-
ments, we fix the seed of the random number genera-
tor by calling the R function set.seed().
About the tuning of the RF parameters, they have
been defined in experimental way, by researching
those that maximize the classification performance.
5.5 Experimental Results
The results reported in this section represent the aver-
age of the results of all experiments, according to the
adopted k-fold cross-validation criterion, exposed in
the previous Section 5.4.
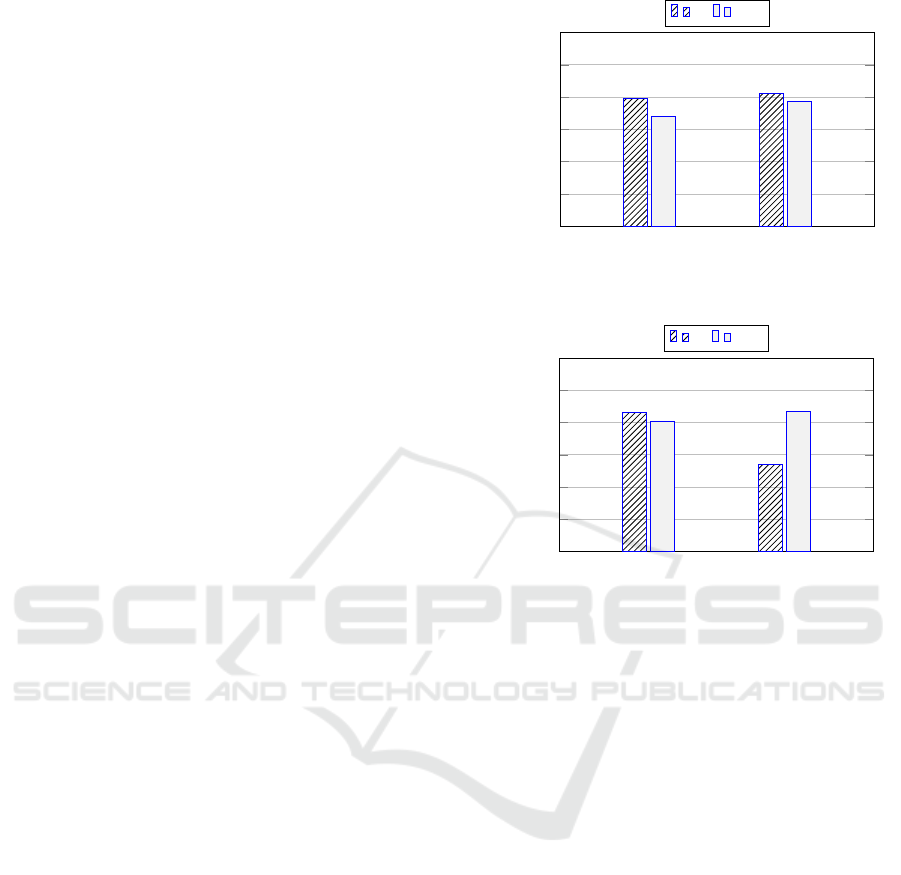
As we can observe in Figure 3 and Figure 4, the
performance of our LDB approach is very close to
those of RF in terms of Accuracy, as well as in terms
of F-measure, where we also obtain better results
(w.r.t. RF), by using the DC dataset.
The first and most important consideration when
examining the results is related to the fact that we get
these results by operating proactively, i.e., without us-
ing default instances during the training process, as it
occurs in RF.
A subsequent consideration arises from the obser-
vation of the F-measure results in Figure 4, which
show that the effectiveness of the LDB increases with
the number of non-default instances used during the
training process (as we can observe with the DC
dataset), differently from RF, where this does not
happen (although it exploits default and non-default
instances during the training process).
It should also be observed that, as shown in Fig-
ure 5 and Figure 6, the performance of our approach
remains quite stable with all subsets of data (i.e., the
k subsets used during the k-fold cross-validation).
The performance of the proposed approach are
very interesting also in terms of the AUC metric, as
shown in Figure 7. It is a metric that evaluates the
predictive power of a classification approach, and its
results show that the LDB performance are similar to
those of RF, considering that we did not train our
model with both classes of instances.
In summary, all results show what we previously
stated, i.e., our approach is able to operate in a proac-
tive manner, by detecting default instances that have
been never used to train it. It allows us to use it as
a stand-alone approach, or as part of a non-proactive
approach, to overcome the cold-start problem.
It should be added that the independent-samples
two-tailed Student's t-tests highlighted that there is a
(GC) (DC)
0.20
0.40
0.60
0.80
1.00
Datasets
Accuracy
RF LDB
Figure 3: General Per f ormance : Accuracy.
(GC) (DC)
0.20
0.40
0.60
0.80
1.00
Datasets
F-measure
RF LDB
Figure 4: General Per f ormance : F-measure.
statistical difference between the results (p < 0.05).
6 CONCLUSIONS AND FUTURE
WORK
The credit scoring techniques are used in most forms
of consumer lending, e.g., credit cards, insurance
policies, personal loans, and so on. Financial opera-
tors use the customers' credit scores to evaluate the
potential risks of lending, attempting to reduce the
losses due to default.
This paper proposes a novel approach of credit
scoring that exploits a Linear Dependence Based
(LDB) criterion to classify a new instance as accepted
or rejected. Considering that it does not need to be
trained with the default instances occurred in the past,
it allows us to operate in a proactive manner, over-
coming at the same time the cold-start and the data
imbalance problems that affect the canonical machine
learning approaches.
The experimental results presented in Section 5.5
show two important aspects related to our approach:
on the one hand, it performs very similarly to one of
the most performing approaches at the state of the art
KDIR 2016 - 8th International Conference on Knowledge Discovery and Information Retrieval
118

1 2 3 4
5 6
7 8 9 10
0.2
0.4
0.6
0.8
1
k- f olds
Value
Accuracy F-measure
Figure 5: Per f ormance by k- f olds : GC Dataset.
1 2 3 4
5 6
7 8 9 10
0.2
0.4
0.6
0.8
1
k- f olds
Value
Accuracy F-measure
Figure 6: Per f ormance by k- f olds : DC Dataset.
(GC) (DC)
0.20
0.40
0.60
0.80
1.00
Datasets
AUC
RF LDB
Figure 7: AUC Per f ormance.
(i.e., RF), by operating proactively; on the other hand,
it is able to outperform RF, when in the training pro-
cess a large number of non-default instances are in-
volved, differently from RF, where the performance
does not improve further.
A possible follow up of this paper could be a new
series of experiments aimed at improving the non-
proactive state-of-the-art approaches, by introducing,
in the evaluation process, the information related to
the default cases, as well as the development and
evaluation of the proposed approach in heterogeneous
scenarios, which involve different type of financial
data, e.g., those generated in an E-commerce environ-
ment.
Finally, as part of a future research, we would also
like to compare our approach to those in literature,
issued after the writing of this paper.
ACKNOWLEDGEMENTS
This work is partially funded by Regione Sardegna
under project NOMAD (Next generation Open Mo-
bile Apps Development), through PIA - Pacchetti
Integrati di Agevolazione “Industria Artigianato e
Servizi” (annualit
`
a 2013).
REFERENCES
Alborzi, M. and Khanbabaei, M. (2016). Using data min-
ing and neural networks techniques to propose a new
hybrid customer behaviour analysis and credit scoring
model in banking services based on a developed RFM
analysis method. IJBIS, 23(1):1–22.
Ali, S. and Smith, K. A. (2006). On learning algo-
rithm selection for classification. Appl. Soft Comput.,
6(2):119–138.
Attenberg, J. and Provost, F. J. (2010). Inactive learn-
ing?: difficulties employing active learning in prac-
tice. SIGKDD Explorations, 12(2):36–41.
Batista, G. E., Prati, R. C., and Monard, M. C. (2004). A
study of the behavior of several methods for balancing
machine learning training data. ACM Sigkdd Explo-
rations Newsletter, 6(1):20–29.
Bhattacharyya, S., Jha, S., Tharakunnel, K. K., and West-
land, J. C. (2011). Data mining for credit card fraud:
A comparative study. Decision Support Systems,
50(3):602–613.
Blanco-Oliver, A., Pino-Mej
´
ıas, R., Lara-Rubio, J., and
Rayo, S. (2013). Credit scoring models for the mi-
crofinance industry using neural networks: Evidence
from peru. Expert Syst. Appl., 40(1):356–364.
Breiman, L. (2001). Random forests. Machine Learning,
45(1):5–32.
Brill, J. (1998). The importance of credit scoring models in
improving cash flow and collections. Business Credit,
100(1):16–17.
Brown, I. and Mues, C. (2012). An experimental compari-
son of classification algorithms for imbalanced credit
scoring data sets. Expert Syst. Appl., 39(3):3446–
3453.
Chen, S. Y. and Liu, X. (2004). The contribution of data
mining to information science. Journal of Information
Science, 30(6):550–558.
Chi, B. and Hsu, C. (2012). A hybrid approach to integrate
genetic algorithm into dual scoring model in enhanc-
ing the performance of credit scoring model. Expert
Syst. Appl., 39(3):2650–2661.
Crone, S. F. and Finlay, S. (2012). Instance sampling in
credit scoring: An empirical study of sample size
A Linear-dependence-based Approach to Design Proactive Credit Scoring Models
119

and balancing. International Journal of Forecasting,
28(1):224–238.
Davis, R., Edelman, D., and Gammerman, A. (1992).
Machine-learning algorithms for credit-card applica-
tions. IMA Journal of Management Mathematics,
4(1):43–51.
Dean, J. and Ghemawat, S. (2008). Mapreduce: simpli-
fied data processing on large clusters. Commun. ACM,
51(1):107–113.
Desai, V. S., Crook, J. N., and Overstreet, G. A. (1996).
A comparison of neural networks and linear scoring
models in the credit union environment. European
Journal of Operational Research, 95(1):24–37.
Donmez, P., Carbonell, J. G., and Bennett, P. N. (2007).
Dual strategy active learning. In Kok, J. N., Ko-
ronacki, J., de M
´
antaras, R. L., Matwin, S., Mladenic,
D., and Skowron, A., editors, Machine Learning:
ECML 2007, 18th European Conference on Machine
Learning, Warsaw, Poland, September 17-21, 2007,
Proceedings, volume 4701 of Lecture Notes in Com-
puter Science, pages 116–127. Springer.
Doumpos, M. and Zopounidis, C. (2014). Credit scoring.
In Multicriteria Analysis in Finance, pages 43–59.
Springer.
Faraggi, D. and Reiser, B. (2002). Estimation of the area un-
der the roc curve. Statistics in medicine, 21(20):3093–
3106.
Fensterstock, A. (2005). Credit scoring and the next step.
Business Credit, 107(3):46–49.
Fern
´
andez-Tob
´
ıas, I., Tomeo, P., Cantador, I., Noia, T. D.,
and Sciascio, E. D. (2016). Accuracy and diver-
sity in cross-domain recommendations for cold-start
users with positive-only feedback. In Sen, S., Geyer,
W., Freyne, J., and Castells, P., editors, Proceed-
ings of the 10th ACM Conference on Recommender
Systems, Boston, MA, USA, September 15-19, 2016,
pages 119–122. ACM.
Hand, D. J. (2009). Measuring classifier performance: a
coherent alternative to the area under the ROC curve.
Machine Learning, 77(1):103–123.
He, H. and Garcia, E. A. (2009). Learning from imbalanced
data. IEEE Trans. Knowl. Data Eng., 21(9):1263–
1284.
Henley, W. et al. (1997). Construction of a k-nearest-
neighbour credit-scoring system. IMA Journal of
Management Mathematics, 8(4):305–321.
Henley, W. and Hand, D. J. (1996). A k-nearest-neighbour
classifier for assessing consumer credit risk. The
Statistician, pages 77–95.
Henley, W. E. (1994). Statistical aspects of credit scoring.
PhD thesis, Open University.
Hsieh, N.-C. (2005). Hybrid mining approach in the design
of credit scoring models. Expert Systems with Appli-
cations, 28(4):655–665.
Japkowicz, N. and Stephen, S. (2002). The class imbal-
ance problem: A systematic study. Intell. Data Anal.,
6(5):429–449.
Lee, T.-S. and Chen, I.-F. (2005). A two-stage hybrid
credit scoring model using artificial neural networks
and multivariate adaptive regression splines. Expert
Systems with Applications, 28(4):743–752.
Lessmann, S., Baesens, B., Seow, H., and Thomas, L. C.
(2015). Benchmarking state-of-the-art classifica-
tion algorithms for credit scoring: An update of re-
search. European Journal of Operational Research,
247(1):124–136.
Lika, B., Kolomvatsos, K., and Hadjiefthymiades, S.
(2014). Facing the cold start problem in recommender
systems. Expert Syst. Appl., 41(4):2065–2073.
Marqu
´
es, A. I., Garc
´
ıa, V., and S
´
anchez, J. S. (2013). On the
suitability of resampling techniques for the class im-
balance problem in credit scoring. JORS, 64(7):1060–
1070.
Mester, L. J. et al. (1997). Whats the point of credit scoring?
Business review, 3:3–16.
Moler, C. B. (2004). Numerical computing with MATLAB.
SIAM.
Morrison, J. (2004). Introduction to survival analysis
in business. The Journal of Business Forecasting,
23(1):18.
Ong, C.-S., Huang, J.-J., and Tzeng, G.-H. (2005). Build-
ing credit scoring models using genetic programming.
Expert Systems with Applications, 29(1):41–47.
Powers, D. M. (2011). Evaluation: from precision, recall
and f-measure to roc, informedness, markedness and
correlation.
Pozzolo, A. D., Caelen, O., Borgne, Y. L., Waterschoot, S.,
and Bontempi, G. (2014). Learned lessons in credit
card fraud detection from a practitioner perspective.
Expert Syst. Appl., 41(10):4915–4928.
Quah, J. T. S. and Sriganesh, M. (2008). Real-time credit
card fraud detection using computational intelligence.
Expert Syst. Appl., 35(4):1721–1732.
Reichert, A. K., Cho, C.-C., and Wagner, G. M. (1983).
An examination of the conceptual issues involved in
developing credit-scoring models. Journal of Business
& Economic Statistics, 1(2):101–114.
Salzberg, S. (1997). On comparing classifiers: Pitfalls
to avoid and a recommended approach. Data Min.
Knowl. Discov., 1(3):317–328.
Son, L. H. (2016). Dealing with the new user cold-start
problem in recommender systems: A comparative re-
view. Inf. Syst., 58:87–104.
Thanuja, V., Venkateswarlu, B., and Anjaneyulu, G. (2011).
Applications of data mining in customer relationship
management. Journal of Computer and Mathematical
Sciences Vol, 2(3):399–580.
Vinciotti, V. and Hand, D. J. (2003). Scorecard construc-
tion with unbalanced class sizes. Journal of Iranian
Statistical Society, 2(2):189–205.
Wang, G., Hao, J., Ma, J., and Jiang, H. (2011). A compar-
ative assessment of ensemble learning for credit scor-
ing. Expert Syst. Appl., 38(1):223–230.
Wang, G., Ma, J., Huang, L., and Xu, K. (2012). Two credit
scoring models based on dual strategy ensemble trees.
Knowl.-Based Syst., 26:61–68.
Zhu, J., Wang, H., Yao, T., and Tsou, B. K. (2008). Active
learning with sampling by uncertainty and density for
word sense disambiguation and text classification. In
Scott, D. and Uszkoreit, H., editors, COLING 2008,
22nd International Conference on Computational Lin-
guistics, Proceedings of the Conference, 18-22 August
2008, Manchester, UK, pages 1137–1144.
KDIR 2016 - 8th International Conference on Knowledge Discovery and Information Retrieval
120
