
Recommending Groups to Users based Both on Their Textual and Image
Posts
Elias Oliveira
1
, Howard Roatti
1
, Gustavo Ramos Lima
2
and Patrick Marques Ciarelli
3
1
Programa de P
´
os-Graduac¸
˜
ao em Inform
´
atica, Universidade Federal do Esp
´
ırito Santo,
Av. Fernando Ferrari, 514, Goiabeiras Vit
´
oria, ES 29075-910, Brazil
2
Graduac¸
˜
ao em Engenharia El
´
etrica, Universidade Federal do Esp
´
ırito Santo,
Av. Fernando Ferrari, 514, Goiabeiras Vit
´
oria, ES 29075-910, Brazil
3
Programa de P
´
os-Graduac¸
˜
ao em Engenharia El
´
etrica, Universidade Federal do Esp
´
ırito Santo,
Av. Fernando Ferrari, 514, Goiabeiras Vit
´
oria, ES 29075-910, Brazil
Keywords:
Text Classification, Image Classification, Social Network, Textmining.
Abstract:
This article focuses on the recommendation of Facebook groups to users, based on the post profile of each
user on Facebook. In order to accomplish this task, texts and images provided by users are used as source of
information, and the experiments showed that the combination of these two types of information gives results
better than or equal to the results obtained when using separately these data. The proposed approach in this
paper is simple and promising to recommend Facebook groups.
1 INTRODUCTION
The growth of online social networks, like Facebook,
WhatsApp, Twitter and Instagram, has been tremen-
dous in the last decade. Currently, there are over 2
billion users worldwide connected to at least one so-
cial network and the prospect is that this number will
increase each year (Statista, 2016). These users post
messages, images and videos and let them publicly
accessible, so that any person can read the content and
even interact with the user that shared it. As there are
a huge amount of users on social networks, the num-
ber of messages shared is vast. Only for Facebook,
it is estimated about 4 million of posts per minute
(WERSM, 2015). This means that the amount of
available data not only covers a significant portion of
the world population, but it is also huge.
These data can be used to model user profiles and
to identify their habits, interests, behavior patterns
and other information about them. User profiles can
be useful to provide a variety of applications, such as
personalized search engines, recommender systems
from friends and content, identification of users with
malicious behavior and indication of products and
services orientated to the interests and needs of users
(Kosinski et al., 2013; Jin et al., 2013; Mislove et al.,
2010). Regarding the marketing strategies, the avail-
ability of large volumes of data has been used in stud-
ies that seek to identify patterns and habits of con-
sumers and whose analysis can serve as guidelines for
large department stores and companies.
A common approach to identify relevant infor-
mation from users is using the texts which are pub-
lished on social networks, since they are very infor-
mative and they are the primary means of commu-
nication in most social networks. However, there
are some facts and information which are difficult
to extract solely from texts. In these texts there are
misspellings, words with multiple semantic meanings
and synonyms. Moreover, different languages in the
world and the huge dictionary of words contained in
each language are some of the difficulties. An op-
tion to get more information from users, and more
precise profiles, is to use data from images and pho-
tographs. This option is feasible because it is very
common users both disseminate text messages and the
associated images on social networks.
In this context, this paper analyzes the use of texts
and images on the task of recommending Facebook
groups for users. To accomplish this task, a dataset
of posts of Facebook groups was collected and, of
this dataset, the users with the largest number of posts
were selected. Based on the posts of these users and
in the modelling of each group, the groups are recom-
mended to each individual according to the affinity.
The information was extracted from texts and images,
Oliveira, E., Roatti, H., Lima, G. and Ciarelli, P.
Recommending Groups to Users based Both on Their Textual and Image Posts.
DOI: 10.5220/0006053803150320
In Proceedings of the 8th International Joint Conference on Knowledge Discovery, Knowledge Engineering and Knowledge Management (IC3K 2016) - Volume 1: KDIR, pages 315-320
ISBN: 978-989-758-203-5
Copyright
c
2016 by SCITEPRESS – Science and Technology Publications, Lda. All rights reserved
315

and we carried out experiments with three types of
approaches: one using only textual information, other
using visual information and a final test combining
both information. The results indicated that the use of
two types of data sources can improve the results.
This work is organized as follows. In Section 2,
we describe the procedures used for information ex-
traction in texts and images. The dataset and its pro-
cessing are presented in Section 3. The method to
recommend groups is described in Section 4. In Sec-
tion 5, we describe the experiments and analyze the
results. Conclusions are presented in Section 6.
2 TECHNIQUES FOR
INFORMATION EXTRACTION
2.1 Texts Representation
When working with texts, a series of procedures is
necessary to facilitate the information retrieval. The
pre-processing steps used in this work were per-
formed as follows.
Initially, punctuation, non-alphanumeric charac-
ters and numbers were removed from the texts. Af-
ter that, letters were passed to lower case and terms
with low semantic value, known as stopwords (Baeza-
Yates and Ribeiro-Neto, 1998), were removed, be-
cause they do not contribute with relevant information
and they may damage the information retrieval task.
Examples of stopwords are articles, prepositions and
interjections.
After this procedure, the next step is to obtain
the canonical form of words, that is, words without
inflections, genre and plurals. This step is impor-
tant because the computer is not able to understand
that words like “teacher” and “teachers”, which re-
fer to the same categorical meaning. In this work we
used the software CoGrOO (cogroo.sourceforge.net)
which, among other things, obtain the canonical form
of Portuguese words.
A fundamental step is to adopt an efficient way
to represent texts such that they can be appropriately
processed by a computer. One of the most popular
forms of representation of texts is through the vector
space model presented by Salton and Yang (1975). In
this model, each document (or text) d
j
is represented
by a vector of n dimensions, each position i of this
vector represents a term t
i
that is associated with a
weight w
i, j
. In this work, w
i, j
is the number of times
that term t
i
occurred within the document d
j
. Thus,
the document d
j
is represented as Equation 1:
d
j
= {w
1, j
, w
2, j
, .. . , w
n, j
}. (1)
For a set of D documents, a set of distinct terms
is obtained and they constitute the dictionary of terms
of D. When a term t
i
does not occur within a docu-
ment d
j
, the weight w
i, j
of this term is equal to zero.
With the vector space model is possible to use met-
rics such as Euclidean distance and cosine similarity
to measure the degree of similarity between different
documents. Each document is associated with a cate-
gory represented by the set C.
Two additional steps are performed on the set of
documents D. In the first step are removed terms with
low discrimination power. In this work, we consider
all the terms that appear only in one document, or ap-
pear in all documents in D. In the first case, the re-
moval is motivated because it can be a misspelling
or very rare word that does not influence the results,
but increases the number of terms present in the doc-
uments, increasing the computational cost in the clas-
sification stage. In the second case, the presence of
terms in all documents may be stopwords that were
not removed from the set D.
The second additional step is the use of a tech-
nique called Inverse Document Frequency (IDF),
which is utilized to increase the importance of the
terms that appear in few documents and to reduce
the weights of terms that appear in many documents
(Salton and Yang, 1975). This weighting is combined
with the term frequency of each term in each docu-
ment, and obtain the new weight
d
w
i, j
of the term t
i
in
document d
j
. This new weight is calculated by Equa-
tion 2:
d
w
i, j
= w
i, j
× id f
i
, id f
i
= log
|D|
nd
i
, (2)
where w
i, j
is the frequency of term t
i
in document d
j
,
id f
i
is the value of idf for the term t
i
, |D| is the num-
ber of documents in the set D, and nd
i
is the number
of documents that the term t
i
appeared, that is, the
number of documents that w
i, j
> 0.
Finally, after all procedures, there are two data:
one matrix M with |D| × n dimensions, representing
the documents, and a vector N with |D| × 1 dimen-
sions, representing the vector of categories associated
with the documents, where n is the number of distinct
words in the set D.
2.2 Images Representation
Images also need a pre-processing step to extract rel-
evant information and reduce the data dimensionality.
There are several methods to represent images
in categorization tasks, but many of them are slow,
complex, have many parameters to be adjusted or re-
quire a set of images with various elements labeled.
In this work, we adopted the approach proposed in
KDIR 2016 - 8th International Conference on Knowledge Discovery and Information Retrieval
316

(de Souza Gazolli and Salles, 2012), because it is fast,
simple and has no parameters for calibration, further-
more, its results are similar to other approaches.
The approach used in this work, called Contextual
Mean Census Transform (CMCT), represents each
image as a vector. This approach works on a gray-
scale image. On each pixel x of the image is centered
a small mask 3 × 3 that performs an operation on the
neighboring pixels to the pixel x. Firstly, the average
intensity I
x
of the image pixels under the mask is cal-
culated. Next, the intensities of the neighboring pixels
to the pixel x (N
x
) are compared to I
x
.
If the intensity value of a pixel y (I
y
) is greater
than or equal to I
x
, a bit 1 is generated in the pixel
of the mask 3 × 3 which is over the pixel y. Other-
wise, a value 0 is generated in the same pixel of the
mask. Equation 3 shows this calculation. After going
through all the neighboring pixels of x, the mask 3 ×3
will have binary values in all positions, except in the
central pixel. These values form a binary word of 8
bits, and it is converted into an integer between 0 and
255. This initial operation is called Modified Census
Transform (MCT), or MCT8, because it forms words
of 8 bits.
T
x
= ⊗
y∈N
x
ζ(I
y
, I
x
), ζ(m, n) =
(
1, m ≥ n
0, otherwise.
(3)
The number obtained in Equation 3 is stored in a
pixel of a new image, whose position is related to the
location of the pixel x. After passing the mask on all
pixels of the original image, a new image is obtained.
A histogram is computed from this new image, that is,
the number of times which value has occurred in the
new image. This histogram has 2
8
= 256 elements.
After this step, the MCT is passed over this new
image and the histogram of the resulting image is ob-
tained, again with 256 elements. The histograms of
both images are concatenated to form a vector h of
512 elements. To avoid a very big difference between
the values of the elements, and to achieve a better
classification performance, logarithm operation is ap-
plied on the non-zero values of the vector h, as shown
in Equation 4. Finally, the new vector
˜
h is normalized
by Equation 5.
˜
h
i
= 1 + log(h
i
) ∀ i ∈ {1,. . . , 512}|h
i
> 0. (4)
b
h
i
=
˜
h
i
∑
512
i=1
˜
h
i
∀ i ∈ {1,. . . , 512}. (5)
The previous procedure is applied to each image
of the dataset. As a result, a numerical matrix F with
dimensions W × 512 represents the images and a vec-
tor N with dimensions W × 1 represents the vector of
categories associated with the images, where W is the
number of images in the dataset.
3 DATASETS
For the experiments were collected posts from six
Brazilian groups of Facebook social network, in the
period from 04/2011 to 07/2015, using Facebook4j
API (facebook4j.org). The groups are on different
subjects, such as nature, religion, politics, etc. Each
post contains a set of fields, such as message, posting
date, post ID, group name, link of image posted on
Facebook, among others.
The second step was to collect the images. In this
step, only the images found on Facebook were col-
lected, because links of external pages could be bro-
ken. Moreover, we only collected images that had at
least a minimum size of 15 × 15 pixels and a mini-
mum size of 15 kB.
Then, we applied a filtering procedure on the col-
lected data. This procedure has the function of re-
moving all posts either with the empty message field
or with empty link of image field. we also consid-
ered an empty image link if there is a link, but we did
not collect the image. Finally, after these steps, the
dataset is available to be used in our studies.
To accomplish the task of recommending groups
to users based on their posts profiles, the following
procedures were followed. Initially, the 20 users with
the largest number of posts were identified. All posts
from these 20 users were separated of the dataset, and
these posts will be used to obtain information about
user profiles and to recommend groups to the users.
These data will be called user dataset.
After removing all posts from the 20 users of the
dataset, the next step was to select randomly 1001
posts of each group. This number was selected so that
the number of posts per group was equal.These posts
will be used to get information about each group.
These data will be called group dataset.
For each post of user and group datasets, a repre-
sentation of the message in vector space model was
obtained, as described in Section 2.1. Therefore, we
obtained a matrix of messages of the user dataset
with 4830 × 6183 dimensions, that is, 4830 posts and
6183 different terms, while the messages of the group
dataset formed a matrix of 6006 × 6183.
For each dataset was obtained the vector represen-
tation of each image included in the posts. For this,
the procedure described in Section 2.2 was used. For
user dataset was obtained a matrix 4830 × 512, and
for group dataset was obtained a matrix 6006 × 512.
Thus, each post in each dataset is represented by
two vectors: a vector representing the message and
the other one representing the image. With these ma-
trices will be carried out the experiments.
Recommending Groups to Users based Both on Their Textual and Image Posts
317

4 METHOD TO RECOMMEND
GROUPS TO USERS
The approach proposed to recommend groups is
based on the post profile of each user. A classifi-
cation algorithm will be initially trained with a ma-
trix of the group dataset, which may be the matrix of
text or image. After training, the equivalent matrix of
user dataset will be presented to the classifier. That
is, if the classifier is trained with a message matrix,
the classifier will classify the message matrix of user
dataset.
The classifier returns the group (class) most likely
to be associated with the evaluated vector. At the end
of this process, all vectors of the user matrix will be
associated with a group by the classifier. After this
step, for each user it is identified the number of posts
associated with each one of the groups, so that a vec-
tor with g dimensions will be obtained, where g is the
number of groups (in this work, g is equal to 6). The
groups are recommended for the user from this vec-
tor. Table 1 shows a synthetic example of this result
for two users and three groups. In this work, we rec-
ommend for each user the group associates with the
predominant number of posts. In the case of Table 1,
the user 1 is associated with G1 and user 2 with G3.
Table 1: Example of post categorization of 2 users.
User G1 G2 G3
user 1 23 6 10
user 2 18 5 33
In this work, we used three classifiers: the clas-
sical kNN (k-nearest neighbors) algorithm with co-
sine similarity (Duda et al., 2001), kNN++ (Oliveira
et al., 2015), which is a kNN in tree based on hierar-
chical class-conditional clustering proposed to reduce
the computational cost of kNN, and SVM (Support
Vector Machine) with histogram intersection kernel
(Barla et al., 2003). Each technique has a set of pa-
rameters to be adjusted: k for kNN, k and l for kNN++
and c for SVM.
5 EXPERIMENTS AND RESULTS
Before using the proposed approach, the values of k
and c of kNN and SVM, respectively, need to be de-
fined. In the same way, the values of k and l of kNN++
need to be selected. A set of values were evaluated us-
ing the training data, and the parameter values that re-
turned the highest values of performance metrics were
used in the test data. We used in this work the accu-
racy as performance metric. For selecting the best pa-
Table 2: Results of experiments with separated data.
Information source kNN kNN++ SVM
Messages 90.00% 30.00% 90.00%
Images 90.00% 95.00% 85.00%
rameters to each technique, accuracy was calculated
as being equal to number of correctly classified posts
by the total number of posts. For kNN, we evaluated
the value of k in the range from 1 to 15, increasing
it in steps of 1. For SVM, the value of c was eval-
uated from 1 to 15, increasing it in steps of 2. For
kNN++, the evaluated values of k and l were both 5,
10 and 15. For evaluating the performance of recom-
mendation of groups, accuracy is computed as being
the number of users associated with the correct group
by the total number of users.
The second row of Table 2 shows the accuracy ob-
tained on the 20 users when using only the informa-
tion of the messages, while the third row shows the
results when using only the images as information.
The second, third and fourth columns show the results
obtained by kNN, kNN++ and SVM, respectively.
As can be seen, kNN obtained results equal to or
better than those one obtained by SVM to recommend
groups from the messages or images used separately.
kNN++ achieved the best result to recommend groups
from images, but its result using only messages was
significantly inferior to the results obtained by kNN
and SVM. A possible reason for the weak perfor-
mance of kNN++ on text data is the amount of ze-
ros elements and each text vector. As this technique
chooses a sample to represent a group of samples, if
the chosen sample does not represent well the group
of samples (common case when the number of ele-
ments equal to zero is high), the algorithm perfor-
mance is harmed. Both information sources were use-
ful to recommend groups, since the accuracy values
were higher than 80% in all cases, with exception of
the kNN++ result when using only messages.
A new set of experiments were performed com-
bining text and image information, and this combi-
nation was performed in two ways. In the first one,
two kNN are trained, one with text data and another
one with image data, using the parameters found in
the previous step. Thus, each post is classified twice:
the text and the image, then the sum of the number
of posts associated with each group is used to recom-
mendation. The same procedure is performed by the
kNN++ and SVM. In the second way, the text and im-
age vectors are concatenated to form a single vector
per post. The kNN, kNN++ and SVM parameters are
selected as explained previously, and the results are
obtained.
Table 3 indicates the results, where the second row
presents the result when using two classifiers and the
KDIR 2016 - 8th International Conference on Knowledge Discovery and Information Retrieval
318

Table 3: Results of experiments with both information
sources.
Information source kNN kNN++ SVM
Two classifiers 100.00% 30.00% 90.00%
Concatenated vectors 100.00% 95.00% 100.00%
third row when the vectors are concatenated. The re-
sults of kNN, kNN++ and SVM are shown in the sec-
ond, third and fourth columns, respectively. As can
be seen for all classifiers, the results obtained with the
concatenated vectors are better than using two classi-
fiers. For kNN and SVM, these results are better than
the results when using a single information source. In
the case of kNN++, the concatenated vectors returned
the same accuracy obtained when using only images
data. These observations highlight the importance of
using both types of information in recommendation
tasks and classification. However, we believe that
when using the approach with two classifiers a classi-
fier may polarize the other one, because we used just
a simple sum of groups per user. An evidence is the
low accuracy of kNN++ with two classifiers, that is
equal to result obtained when using only message in-
formation, even though the result using only images
data is quite superior.
The results in Tables 2 and 3 were obtained us-
ing all collected posts from each user. However, it is
convenient to have a good precision using a number
of posts as small as possible. For this, the follow-
ing analysis was performed: the number of posts per
user was limited to the N most recent posts and cal-
culated for each value of N the accuracy of group rec-
ommendation. The N values used were 1, 5, 10, 15,
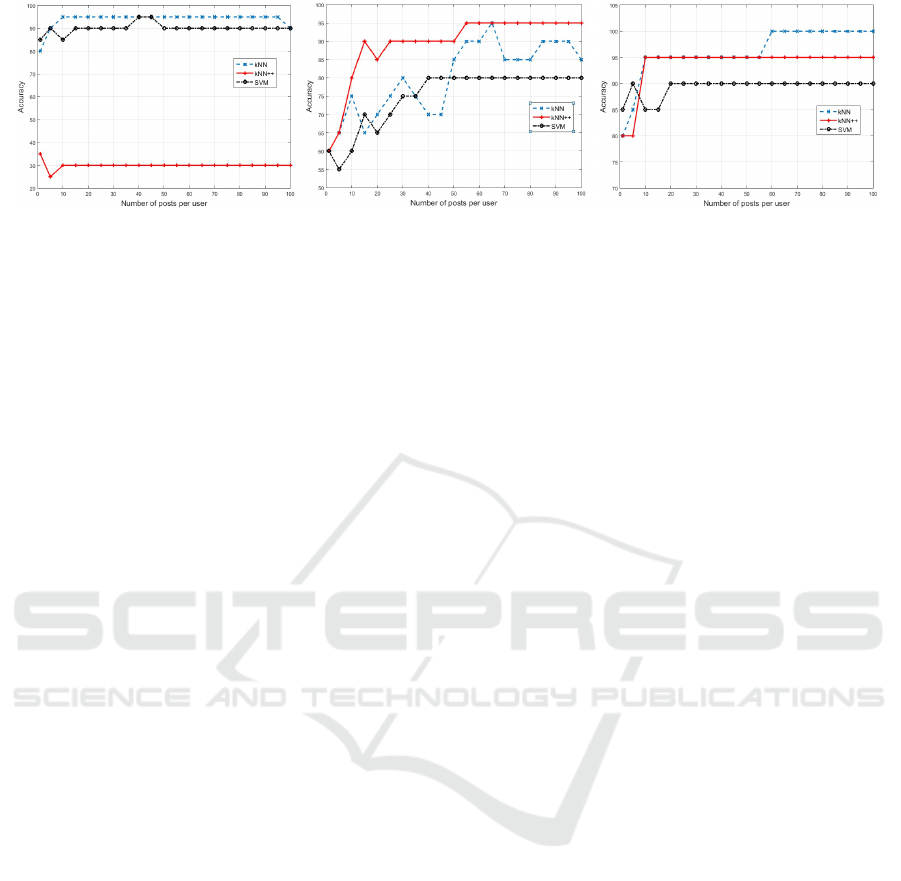
. . ., 100 posts. The graphics of Figures 1(a), 1(b) and
1(c) show the results obtained by the classifiers when
using only text, only image and the concatenated vec-
tors, respectively. Two of the 20 users had less than
100 posts, so for values greater than the number of
posts were considered all user posts.
As can be seen in Figure 1(a), classical kNN
achieved high levels of accuracy using only text to
recommend groups to users. With only the latest post
of each user has achieved an accuracy of 80% and
with 10 posts was obtained a value of 95%. The
kNN++ did not reach accuracy level as high as it was
by kNN, and the accuracy remained stable at 30%
with the number of posts above or equal to 10. The
SVM results were slightly inferior to kNN results.
The graphics in Figure 1(b) indicate that kNN++
has a higher performance than the classical kNN and
SVM to recommend groups when using image infor-
mation. The accuracy of kNN++ is equal to or higher
than the kNN and SVM accuracies for any number
of posts. Furthermore, the kNN++ performance was
more stable than that of kNN. The accuracy of SVM
rose with the increasing of the number of posts, but it
stabilized at 80%. The highest accuracy was obtained
by kNN++ with 55 posts, and the accuracy value sta-
bilized at 95%.
Finally, Figure 1(c) shows a combination of texts
and images to recommend groups. When combining
the results, classical kNN and kNN++ achieved accu-
racies of 80% with a single post, while SVM obtained
85%, with only one post. However, the accuracy of
SVM stabilized at 90% with more posts, and achieved
100% with more than 100 posts per user. The accu-
racy of kNN and kNN++ increased to 95% when us-
ing 10 posts, and the kNN accuracy reached 100%
with 60 or more posts.
Observing the experimental results, kNN achieved
high accuracy (80% or above) with few posts when
using text information (only text or text and image).
When the kNN used only image information, a larger
number of posts was necessary for it obtains high
accuracy (above 80%), unfortunately, it is not al-
ways available in a real world a lot of posts per user.
kNN++ achieved the worst accuracy when using only
text information, on the other hand, it obtained the
highest accuracy when using only image information.
A possible reason for its weak performance on text
data is the amount of zeros elements and each text
vector, as explained previously. The accuracy of SVM
was similar to kNN, when using only text. Neverthe-
less, its performance with few posts and using image
data (only image or text and image) was inferior to
those achieved by kNN++ and kNN. As SVM is a
complex algorithm, kNN or kNN++ are supposed to
be most appropriate choices.
In the context of computational cost, we observed
that kNN++ was around 15 and 2 times faster than
SVM and kNN to classify texts and the combination
of images and texts, respectively. The computational
cost of SVM and kNN to classify the same kind of
data was similar each other. However, kNN++ took as
much time as SVM to classify image data, and kNN
was around of 4 times faster than SVM and kNN++.
6 CONCLUSIONS
In this paper was analyzed the use of texts and im-
ages shared by users on the task of recommending
Facebook groups for them. Experimental results indi-
cated that both information sources (text and images)
are useful to perform appropriately this task, and high
levels of accuracy were obtained using only one type
of information, although the best results were ob-
tained when texts and images data were used alto-
gether. In the experimental results, it was also ob-
Recommending Groups to Users based Both on Their Textual and Image Posts
319
(a) (b) (c)
Figure 1: Accuracy per number of posts when using: (a) only text information, (b) only image information and (c) text and
image information.
served that the use of a reasonable amount of posts
per user to recommending groups increases the pre-
cision of the system, so that with 10 posts per user
was possible to have an accuracy of 95%, when using
texts and images, and with 60 posts was achieved up
to 100% of accuracy.
Future research paths include to evaluate better
methods for the unification of texts and images to rec-
ommend groups when the user shares only one an-
other type of information, and to use larger datasets
where the users can be recommended for a set of
groups. In this latter case, the task is similar to
multi-label classification and approaches of this field
can be employed. An example of multi-label clas-
sification used for recommendation was presented in
(de Oliveira et al., 2013).
ACKNOWLEDGEMENTS
Patrick Marques Ciarelli and Gustavo Ramos Lima
would like to thank Fundac¸
˜
ao de Amparo
`
a Pesquisa
e Inovac¸
˜
ao do Esp
´
ırito Santo (FAPES) by the financial
support to the project number 526/2015.
REFERENCES
Baeza-Yates, R. and Ribeiro-Neto, B. (1998). Modern In-
formation Retrieval. Addison-Wesley, New York, first
edition edition.
Barla, A., Odone, F., and Verri, A. (2003). Histogram inter-
section kernel for image classification. Proceedings of
2003 International Conference on Image Processing,
3:513–516.
de Oliveira, M. G., Ciarelli, P. M., and Oliveira, E.
(2013). Recommendation of programming activities
by multi-label classification for a formative assess-
ment of students. Expert Systems with Applications,
40(16):6641–6651.
de Souza Gazolli, K. A. and Salles, E. O. T. (2012). A con-
textual image descriptor for scene classification. On-
line Proceedings on Trends in Innovative Computing,
pages 66–71.
Duda, R. O., Hart, P. E., and Stork, D. G. (2001). Pattern
Classification. Wiley-Interscience, New York, 2 edi-
tion.
Jin, L., Chen, Y., Wang, T., Hui, P., and Vasilakos, A. V.
(2013). Understanding user behavior in online social
networks: a survey. IEEE Communications Magazine,
pages 144–150.
Kosinski, M., Stillwell, D., and Graepel, T. (2013). Pri-
vate traits and attributes are predictable from digital
records of human behavior. Proceedings of the Na-
tional Academy of Sciences of the United States of
America, pages 1–4.
Mislove, A., Viswanath, B., Gummadi, K. P., and Druschel,
P. (2010). You are who you know: inferring user pro-
files in online social networks. Proceedings of the
third ACM international conference on Web search
and data mining, pages 251–260.
Oliveira, E., Roatti, H., de Araujo Nogueira, M., Basoni,
H. G., and Ciarelli, P. M. (2015). Using the cluster-
based tree structure of k-nearest neighbor to reduce
the effort required to classify unlabeled large datasets.
The 7th International Joint Conference on Knowledge
Discovery, Knowledge Engineering and Knowledge
Management., pages 1–10.
Salton, G. and Yang, C. S. (1975). A vector space model
for automatic indexing. Communications of the ACM,
pages 613–620.
Statista (2016). Number of social network users worldwide
from 2010 to 2019 (in billions). Technical report,
http://www.statista.com/statistics/278414/number-of-
worldwide-social-network-users/.
WERSM (2015). How much data is generated every minute
on social media? Technical report, http://wersm.com/
how-much-data-is-generated-every-minute-on-social-
media/.
KDIR 2016 - 8th International Conference on Knowledge Discovery and Information Retrieval
320
