Instruction Structure Analysis Appling Fuzzy Number
Seiji Saito
1
and Takenobu Takizawa
2
1
Graduate School of Education, Waseda University, Shinjuku-ku, Tokyo, Japan
2
Faculty of Political Science and Economics, Waseda University, Shinjuku-ku, Tokyo, Japan
Keywords: Fuzzy Graph, Fuzzy Clustering, Fuzzy Number, Fuzzy Cognition Graph.
Abstract: Applying fuzzy clustering method to the instruction structure analysis, we can investigate whether the order
of teaching item is suitable or not. However, when the teacher gives learners partial points, it is difficult to
judge whether the leaner solve the problem correctly or not. In this paper, the authors regard the score of the
test as the fuzzy number, and present a new analysis method using fuzzy number. We show some graphs
required for analysis based on the results of examination for high school students and represent the
effectivity of the method.
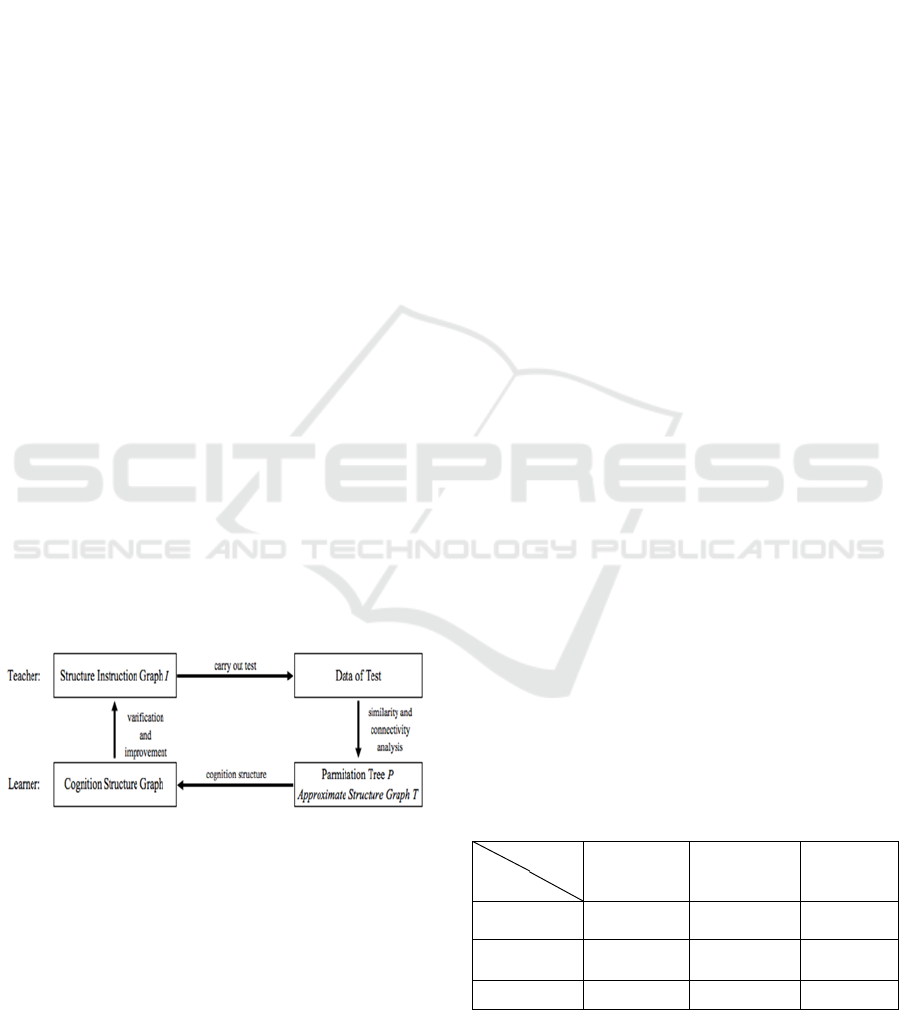
1 INTRODUCTION
When we teach a learning unit, we need to consider
that what problems should be taught and in what
order we teach items. There is a method to
investigate the similarity and the connectivity among
the problems. We call this method “Instruction
Structure Analysis”. Applying the analysis based on
the score of the test, we can obtain some graphs.
From the graphs, we can verify and improve the
teacher’s instruction structure. The following figure
shows the process of the analysis.
Figure 1: Process of analysis.
In this analysis, we assumed that we give learner
1 on correct or 1 on incorrect as the score. But, we
sometimes have to give a learner partial point
depending on the leaner’s answer. So, we improved
the method to use partial points. Consequently, we
examined to obtain the similar result using only
binary points. However, a new problem has
occurred. If a leaner gets 0.5 point, it is difficult to
judge whether the leaner solved the problem
correctly. So, we propose new method to regard the
point of the test as fuzzy number. From the method,
we obtain some indexes to figure whether reliable
the problem is in the analysis.
In section 2, we introduce the conventional
method of the instruction structure analysis. In
section 3, we propose anew method with fuzzy
number. In section 4, we apply the method to the
real data and show the effectivity of the method.
2 CONVENTIONAL METHOD
First, we present the conventional method of the
instruction structure analysis. If we execute test of m
questions
|1
to n students
|1
, we have the score matrix
, where
1 if student
gives a correct answer for
, else we
give 0
1 for incorrect answer.
Next, from the score matrix
, we obtain the
contingency table
in Figure 2.
Correct Incorrect Sum
Correct
Incorrect
Sum
Figure 2: Contingency table
.
Definition 1.
Elements of the contingency table
88
Saito, S. and Takizawa, T.
Instruction Structure Analysis Appling Fuzzy Number.
DOI: 10.5220/0006050200880092
In Proceedings of the 8th International Joint Conference on Computational Intelligence (IJCCI 2016) - Volume 2: FCTA, pages 88-92
ISBN: 978-989-758-201-1
Copyright
c
2016 by SCITEPRESS – Science and Technology Publications, Lda. All rights reserved

min
,
,min
,1
min1
,
,min1
,1
According to the contingency table
, we have
similarity index
and connectivity index
.
Definition 2.
Similarity Index
∈ 0,1
From the similarity index
, we have the
similarity matrix S=
. We can evaluate the
similsrity among the questions.
Definition 3.
Connectivity Index
∈ 0,1
From the Connectivity index
,
we have the
connectivity matrix
. We can evaluate the
connectivity among the questions.
From the similarity matrix S, we obtain partition
tree P which presents the clustering situation. Also,
from the connectivity matrix T, we obtain an
approximate ternary graph T* which presents the
relational flow among items. From the partition tree
P and the approximate ternary graph T*, we obtain a
cognition structure graph
.
3 PROPOSAL METHOD
We propose the method to create membership
function to regard the score as fuzzy number.
Definition 4. Membership Function of the Score
(i)
0
1
0
0
0
(ii)
1
1
1
0
1
(iii) 0
max0,1
|
|
(iv)
1
max0,1
|
|
The narrower the shape of membership function
is, the more accurately the problem represents
learner’s feature.
Next, we define some operations of fuzzy
number because we extend similarity index by
operating fuzzy number.
Here,
∗
in the following definitions is the fuzzy
set defined by follows.
∗
∈
Figure 3: Example of membership function.
Definition 5. Addition of Fuzzy Numbers
Let
∗
,
∗
be fuzzy numbers with -cuts
∗
,
,
,
∈,01
then the mean value
∗
∗
is;
∗
∗
∗
∩
∗
∗
∈,
∗
∗
,
,
,
,
,
Figure 4: Example of membership function of addition of
fuzzy number.
Definition 6. Minimum Value of Fuzzy
Numbers
Let
∗
,
∗
be fuzzy numbers with -cuts
∗
,
,
,
∈,01
then the minimum value
∗
,
∗
is;
∗
,
∗
∗
∩
min
∗
,
∗
∈,
min
∗
,
∗
min
,
,
,
,min
,
,
,
Definition 7. Scalar Multiple of Fuzzy Number
Let
∗
be fuzzy number with -cuts
∗
,
∈,01
then the scalar multiple
∗
∈
is;
Instruction Structure Analysis Appling Fuzzy Number
89

∗
∗
∩
∗
∈,
∗
,
Then, we extend the similarity index
, and
similarity matrix
.
Definition 8. Fuzzy Elements of Contingency
Table
∗
∗
,
∗
∗
∗
,1
∗
∗
1
∗
,
∗
∗
1
∗
,1
∗
Definition 9. Fuzzy Similarity Index
∗
1
∗
∗
From the fuzzy similarity index
∗
, we obtain
fuzzy similarity matrix
∗
∗
.
We’d like to know the reliability of each
problem. We define the width index using the width
of membership function of similarity index. Then,
we define the reliability index normalized value of
width index.
Definition 10. Width Index
Let
∗
be fuzzy similarity index with -cuts
∗
,,
,
,,
then the reliability index
is;
,,
,,
∈
0,2
Definition 11. Reliability Index
2
2
∈
0,1
From the relativity matrix and reliability matrix,
we obtain fuzzy relativity index and fuzzy relativity
matrix as follows.
Definition 12. Fuzzy Relativity Index
min
,
From fuzzy relativity index, we can obtain fuzzy
relativity matrix. Finally, we make fuzzy cognition
graph
∗
from cognition graph
, and fuzzy
reliability index. We alter the gridlines of the items
of cognition graph
depending on each reliability
index ̃
as follows.
If
1, then the gridline is bold line.
If
, then the gridline is normal line.
If
, then the gridline is narrow line.
If 0
, then the gridline is dotted line.
4 CASE STUDY
As the case study of the instruction structure
analysis, we carried out test subject to 43 tenth grade
students in a high school attached to a university.
The contents of the test are Logic and Propositions.
We gave students an examination as shown in
table 1. Then we got score matrix from the result
of the test in figure 5.
Table 1: Questions.
1
I. Let
1,2,3
. List all subsets of A.
II .Let
| ∈
,20
,
| ∈
,
| ∈ 3
,
| ∈ 5
. Find:
2
(i) ∩
3
(ii) ∪
4
(iii)
∩∩
5
(iv)
∪∩
III. Let condition p, q be the follows. Write that it
means a necessary condition, sufficient condition or
necessary and sufficient condition.
6
(i)
: , :
.
7
(ii)
: 2,: 1 1
8
IV. Write the converse, inverse and
contrapositive of the following statement.
: 0 ⇒ 0 0
, ∈
V.40 students are in a classroom. We asked them
whether they like Mathematics and they are good at
Mathematics. 35 students answered I like
Mathematics. 29 students answered I’m good at
Mathematics. 35 students answered I don’t like and
am not good at Mathematics.
9
(i) Find number of students who answer I like and
am good at Mathematics.
10
(ii) Find number of students who answer I like
Mathematics but I am not good at Mathematics.
11
VI. Proof the following proposition.(
∈
22
.
12
VII. Proof the following proposition.
√
2 .
13
VIII. Proof the following proposition.
√
2
√
3 .
From the score matrix , we obtained similarity
matrix in figure 6 and connectivity structure
matrix in figure 7.
FCTA 2016 - 8th International Conference on Fuzzy Computation Theory and Applications
90
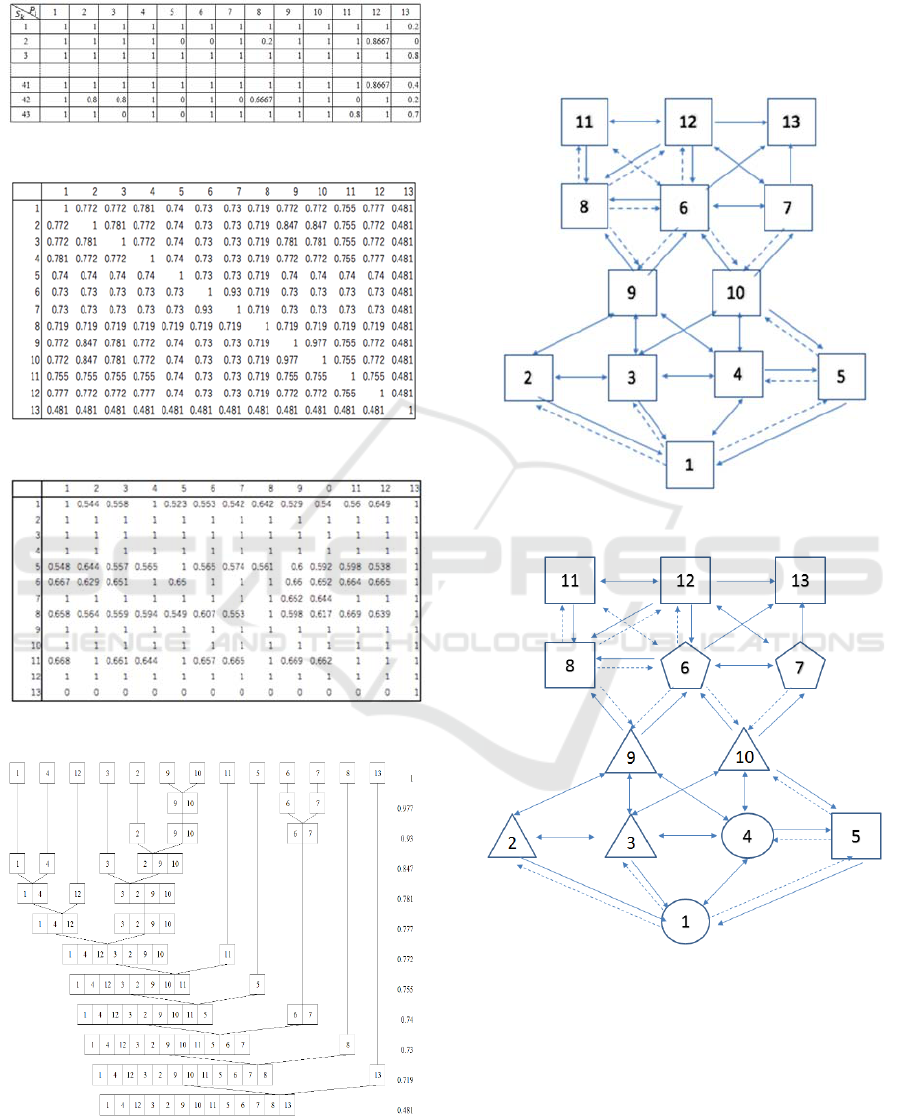
From similarity structure matrix , we obtain
partition tree in figure 8.
Figure 5: Score matrix .
Figure 6: Similarity matrix .
Figure 7: Connectivity matrix .
Figure 8: Partition tree .
On the other hand, from the connectivity
structure graph , we obtained approximate ternary
graph
∗
in figure 9.
Summarizing the partition tree and the
approximate ternary graph
∗
, we have obtained the
cognition structure graph
in figure 10.
Figure 9: Approximate ternary graph
∗
.
Figure 10: Cognition structure graph
.
To compute the reliability index, we obtained
reliability matrix in figure 11.
From connectivity structure matrix T and
reliability matrix R, we obtained fuzzy connectivity
structure matrix in figure 12.
Finally, we obtained fuzzy cognition graph
∗
in figure 13.
Instruction Structure Analysis Appling Fuzzy Number
91
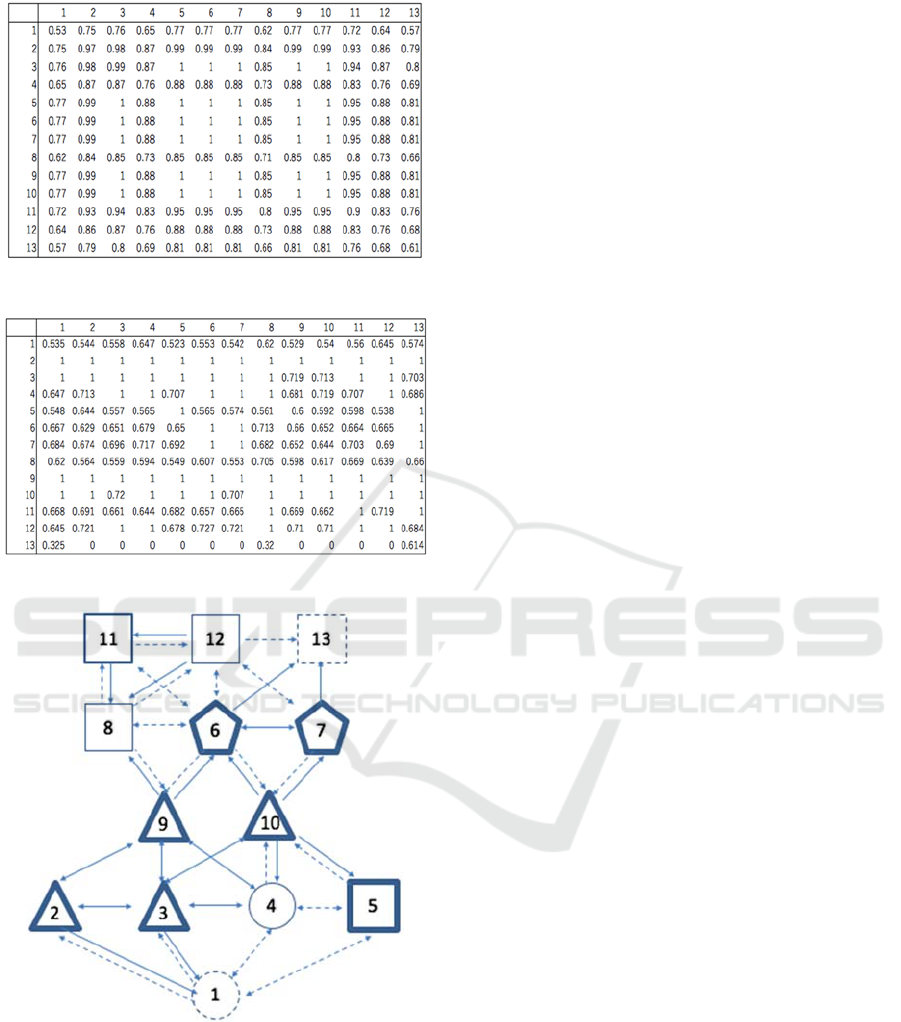
Figure 11: Reliability matrix .
Figure 12: Fuzzy connectivity structure matrix.
Figure 13: Fuzzy cognition graph
∗
.
According to the fuzzy cognition structure graph
∗
, we found following results:
(1) We classified four groups {2,3,9,10}, {6,7},
{5,8,11,12,13},{1,4} from fuzzy cognition structure
graph
∗
.
(2) 1 wasn’t suitable for analysis because many
students forgot empty set therefore we gave them
partial points.
(3) 13 wasn’t suitable for analysis because it was
proof question therefore many students couldn’t
solve correctly.
(4) Many students found it easier to solve the
problem of Set than Proposition.
5 CONCLUSIONS
The authors have discussed the analysis method to
use partial points, and have also illustrated its
example of the high school mathematics. Using the
fuzzy cognition structure graph, we have been able
to judge whether the leaner solve the problem
correctly or not. The graph is complicated therefore
we would like to improve analytical methods in the
future.
REFERENCES
Yamashita H. and Takizawa T. and more: “Introduction to
Fuzzy Theory and Its Application”, Kyoritsu Shuppan,
2010 (in Japanese).
Tsuda, E., Yamashita, H., and Nagashima, K.: “Opinion
Survey Applying Fuzzy Graph”, Proceedings of the
22
nd
Annual Conference of Biomedical Fuzzy System
Association, pp.127 – 130, 2009.
Uesu H.: “Student’s Needs Analysis Applying Type-2
Fuzzy Contingency Table for Media Lectures”,
Proceedings of the 28
th
Annual Conference of
Biomedical Fuzzy Systems Association, pp.293 – 296,
2015.
Saito S., Takizawa T.: “Instruction Structure Analysis of
High School Mathematics Applying Fuzzy
Clustering”, Proceedings of the 28
th
Annual
Conference of Biomedical Fuzzy Systems
Association, pp.183 – 186, 2015.
Saito S., Takizawa T.: “Structure Analysis of Instruction
Items Appling Fuzzy Number”, Proceedings of The
International Symposium on Information Theory and
Its Applications 2016. (forthcoming).
FCTA 2016 - 8th International Conference on Fuzzy Computation Theory and Applications
92
