
Prediction of Company’s Trend based on Publication Statistics and
Sentiment Analysis
Fumiyo Fukumoto
1
, Yoshimi Suzuki
1
, Akihiro Nonaka
1
and Karman Chan
2
1
Graduate Faculty of Interdisciplinary Research, Univ. of Yamanashi, 4-3-11, Takeda, Kofu, Yamanashi, Japan
2
Business Strategy and Development Center, IIJ Innovation Institute Inc., 2-10-2, Fujimi, Chiyoda-ku, Tokyo, Japan
Keywords:
Publication Statistics, Sentiment Analysis, Prediction, Company’s Trend.
Abstract:
This paper presents a method for predicting company’s trend on research and technological innova-
tion/development(R&D) in business area. We used three types of data collections, i.e, scientific papers, open
patents, and newspaper articles to estimate temporal changes of trends on company’s business area. We used
frequency counts on scientific papers and open patents to be published in time series. For news articles, we
applied sentiment analysis to extract positive news reports related to the company’s business areas, and count
their frequencies. For each company, we then created temporal changes based on these frequency statistics.
For each business area, we clustered these temporal changes. Finally, we estimated prediction models for each
cluster. The results show that the the model obtained by combining three data is effective to predict company’s
future trends, especially the results show that SP clustering contributes overall performance.
1 INTRODUCTION
With the exponential growth of industries, an enor-
mous body of companies provide jobs with various
business areas, e.g. IT engineer, Electronic communi-
cation, and medical science. Hence, given the limited
time, people, especially students have to go on job
hunting. Ideally, many would be more interested in
getting a job that matches their expertise of study, and
companies having high prospect in those fields in the
future. However, it is difficult to make a decision that
whether a company would really make an expertise
and investment in the future before working at that
company. Therefore, it is beneficial for automatically
predicting company’s trend on R&D in various busi-
ness fields.
In the context of high impact academic pa-
pers prediction, citation-based analysis is often
used(McGovern et al., 2003; Bethard and Jurafsky,
2010). Adams showed that the number of citations
is used to quantify paper’s attention(Adams, 2005).
McNamara et al proposed a method for predicting
paper’s future impact by using topological features
extracted from citation network(McNamara et al.,
2013). In addition to topological features, Davletov
et al predicted high impact academic paper based on
temporal features of citations(Davletov et al., 2014).
There are a few academic paper prediction method
used on textual features(Kogan et al., 2009; Joshi
et al., 2010; Yagatama et al., 2011), while much of
the previous work on paper prediction used mainly
citation statistics(Shi et al., 2010; Yan et al., 2012).
Koppel et al attempted to classify news stories about a
company according to its apparent impact on the per-
formanceof the company’s stock (Koppel and Shtrim-
berg, 2004). Milea et alproposed a method of predict-
ing the movement of the MSCI EURO index based
on European Central Bank statements by learning and
extracting fuzzy grammars from the text of the ECB
statements (Milea et al., 2010). Lavrenko et al pre-
sented a unique approach to identifying news stories
that influence the behavior of financial markets. They
identified trends in time series using piecewise lin-
ear fitting and assigned labels to the trends according
to an automated binning procedure (Lavrenko et al.,
2000). However, most of the above approaches fo-
cused on company’s financial impact.
In this paper, we focus on company’s R&D in
some business areas (henceforth referred to cate-
gories), and propose a method for predicting their
trend. We used frequency counts on scientific papers
and open patents to be published in time series to ob-
tain temporal changes for categories in the company.
Moreover, we used frequency counts on positive news
reports, e.g. new product sales, a success of new tech-
nologies, and improvement of corporate results, and
Fukumoto, F., Suzuki, Y., Nonaka, A. and Chan, K.
Prediction of Company’s Trend based on Publication Statistics and Sentiment Analysis.
DOI: 10.5220/0006048602830290
In Proceedings of the 8th International Joint Conference on Knowledge Discovery, Knowledge Engineering and Knowledge Management (IC3K 2016) - Volume 1: KDIR, pages 283-290
ISBN: 978-989-758-203-5
Copyright
c
2016 by SCITEPRESS – Science and Technology Publications, Lda. All rights reserved
283

2XWSXW
,QSXW
&RPSDQ\
QDPH
%XVLQHVV
DUHD
$WLPH
SHULRG
$FDGHPLF
SDSHUV
3DWHQW
GRFXPHQWV
1HZV
DUWLFOHV
&UHDWLRQRI
WHPSRUDOVHULHV
&OXVWHULQJ
WHPSRUDOVHULHV
,PSDFWHVWLPDWLRQ
E\FLWDWLRQQHWZRUN
&RQVWUXFWLRQRI
DSUHGLFWLRQPRGHO
3UHGLFWLRQ
5'
L
W
J
F
L
W
O
5
5'SUHGLFWLRQ
KLJKLPSDFW
/HDUQLQJSUHGLFWLRQPRGHO 3UHGLFWLRQRIIXWXUHWUHQG
Figure 1: Overview of the system.
obtained temporal changes for a specific category in
the company. To do this, we applied sentiment anal-
ysis to the newspaper articles to extract positive news
reports related to the companies, and created temporal
changes. For each category, we clustered company’s
changes. Similar to Davletov et al’s method, we used
a regression model, i.e., for each cluster, model pre-
diction is estimated as a regression problem where the
objectiveis to predict company’sfuture trend in a spe-
cific category.
2 FRAMEWORK OF THE
SYSTEM
We used three types of Japanese data, i.e., scientific
papers, patent documents, and news articles to pre-
dict future trend of a company with a specific cate-
gory. Figure 1 illustrates our system. It consists of
two procedures, (1) Learning prediction model, and
(2) Prediction. Learning prediction model consists
of four steps: (1-1) creation of temporal series, (1-2)
clustering temporal series, (1-3) impact estimation by
citation network, and (1-4) construction of a predic-
tion model. The input of the procedure is a company
name(i), its category(m), e.g. communication engi-
neering, and a time period(t) which we want to pre-
dict. The output is a plotted figure represented by a
polynomial regression(degree equals to three) where
x-axis is a time period and y-axis refers to a value in-
dicated future trend on R&D.
2.1 Learning Prediction Model
The company’s future prospect is estimated by using
patterns for each category as time series, and citation
network. The pattern is derived from the frequencies
on scientific papers, open patents to be published, and
positive news reports related to the company.
2.1.1 Creation of Temporal Series
For each category in each company c
m
i
where i is a
company and m is a category, we count the cumu-
lative number of times for three data: scientific pa-
pers, open patents, and positive news reports related
to c
m
i
within a time period,
1
and create three tempo-
ral series, scientific papers (T pa
m
i
), patents (T pt
m
i
),
and news reports (Tnr
m
i
). News articles are not as-
signed categories, while scientific papers and open
patents are classified into categories. Therefore, we
assigned categories to the news articles by using open
patents. More precisely, we collected open patents for
each category, and concatenated them into one docu-
ment. We applied a simple weighting method, tf*idf
scheme (Salton and Buckley, 1990) for term weight-
ing. We used a noun/compound noun word as a term.
For each category, we selected the number of topmost
s terms according to tf*idf values as a feature
2
. For
each news article, we count the number of terms, and
classified each article into categories whose number
of the features is largest.
To extract positive news reports, we applied sen-
timent analysis. For each category m, all news re-
ports including company name are extracted. These
news reports were parsed by the syntactic analyzer
CaboCha (Kudo and Matsumoto, 2003), and all the
dependency triples (rel,x,y) are extracted. Here, x
refers to a noun/compound noun word related to the
company name. y shows a verb or an adjective word.
rel denotes a grammatical relationship between x and
y. We classified rel into 9 types of Japanese parti-
cle, “ga(ha)”, “wo”, “ni”, “he”, “to”, “de”, “yori”,
“kara”, and “made”. For instance, from the sentence
including company name “Toyota-no-uriage(Sales of
Toyota) ha koutixyoudatta(were good).” (Toyota Mo-
tor corporation’s sales were good.), we can obtain the
dependency triplet, (ha, Toyota-no-uriage, koutixyou-
datta). The triplet shows positive opinion.
We regarded each of the extracted dependency
triplet as positive/negative if y in the triplet (rel,x,y)
is classified into positive/negative classes in the
Japanese sentiment polarity dictionary (Kobayashi
et al., 2005). However, the dictionary makes it nearly
impossible to cover all of the words in the news ar-
ticle corpus. For unknown verb or adjective words
that were extracted from the news article corpus, but
did not appear in any of the dictionary classes, we
classified them into positive or negative class by us-
ing a topic model. Topic models such as probabilis-
1
We set a time period to six months
2
As a result of manual evaluation, we set s to 20,000.
KDIR 2016 - 8th International Conference on Knowledge Discovery and Information Retrieval
284

7RSLFBLG
7RSLFBLG
7RSLFBLG
6DOHVKDYHSLFNHGXS
6DOHVDUHJRRG
%XVLQHVVKDVUHFRYHUHG
7KHFRPSDQ\KDVVXFFHGHG
7KHFRPSDQ\WHUPLQDWHGZRUNHUV
5HVXOWVGHWHULRUDWHG
SRVLWLYH
QHJDWLYH
«««
««««
«««
«««
3HUIRUPDQFHDUHJRRG
6DOHVDUHGURSSHG
Figure 2: Clusters obtained by LDA.
tic latent semantic indexing (Hofmann, 1999) and La-
tent Dirichlet Allocation (LDA) (Blei et al., 2003) are
based on the idea that documents are mixtures of top-
ics, where each topic is captured by a distribution over
words. The topic probabilities provide an explicit
low-dimensional representation of a document. They
have been successfully used in many domains such
as text modeling and collaborative filtering (Li et al.,
2013). We applied LDA based on Gibbs sampling to a
news article corpus consisted of triples, and classified
unknown words into positive/negative classes.
Figure 2 illustrates the result obtained by LDA.
The sentence marked with box includes unknown
verb words, such as pick up and terminate. “positive”
and “negative” refer to a sentence including positive
and negative words appeared in the sentiment polarity
dictionary. “Topic
id” indicates id number assigned
to each cluster/set. We need to estimate the number of
topics k
′
for the result obtained by LDA. As shown in
Figure 2, the result can be regarded as a clustering re-
sult: each element of the clusters is positive/negative
news reports according to the sentiment polarity dic-
tionary, or unknown words. Therefore, we estimated
the number of topics (clusters) k
′
by using Entropy
measure given by:
E = −
1
logk
′
∑
j
N
j
N
∑
i
P(A
i
,C
j
)logP(A
i
,C
j
). (1)
k
′
in Eq. (1) refers to the number of clusters. P(A
i
,C
j
)
is a probability that the elements of the cluster C
j
as-
signed to the correct class A
i
. N denotes the total
number of elements and N
j
shows the total number
of elements assigned to the cluster C
j
. The value of
E ranges from 0 to 1, and the smaller value of E indi-
cates better result. We chose the parameter k
′
whose
value of E is smallest. For each cluster, if the number
of positive news reports is larger than those of neg-
ative ones, we regarded a triplet including unknown
word in the cluster as positive and vice versa. For
example, “picked up” in the Topic
id1 cluster shown
in Figure 2 is regarded to a positive as the number of
positive and negative were two and zero, respectively.
We used the result of triples to classify test news
reports. Like much previous work on sentiment anal-
ysis based on supervised machine learning techniques
(Turney, 2002), or corpus-based statistics, we used
Support Vector Machines (SVMs) to annotate auto-
matically (Joachims, 1998). Each training news re-
port is represented by a vector. Each dimension of
a vector is positive/negative triples appeared in the
news report, and the value of each dimension is a
frequency of the triplet in the news report. Each test
news report is also represented by a vector. Each di-
mension of a vector is a triplet appeared in the news
report. We used pairwise classification. As a result,
for each c
m
i
, we count the cumulative number of times
for positive news reports, and create a temporal series,
Tnr
m
i
. Finally, we added these three temporal series
given by Eq. (2).
T
m
i
= αT pa
m
i
+ βT pt
m
i
+ γTnr
m
i
(2)
T
m
i
in Eq. (2) refers to the temporal series with cate-
gory m of the company i. α, β, and γ are parameters
indicating the degree of importance.
2.1.2 Clustering Temporal Series
We note that temporal series T
m
i
is created for each
category of the company. The result is a large number
of temporal series, and some of them are very close
with each other. We then applied spectral(SP) cluster-
ing technique (Ng et al., 2002) to classify them into
some classes. Similar to other clustering algorithms,
the SP clustering takes as input a matrix formed from
a pairwise similarity function over a set of data points.
For each category, we applied SP clustering to the
matrix D
m
. Given a set of points C
m
= {c
m
1
,··· ,c
m
n
}
where c
m
i
denotes company i in the category m, the
algorithm is as follows:
1. Form a distance matrix D
m
∈ R
2
between all the
number of n companies that are used in the train-
ing. The distance matrix for the category m, is
given by D
m
T
i
,T
j
=
∑
t
| T
i,t
− T
j,t
|. D
m
T
i
,T
j
indicates
distance, L
1
-norm between company i and j in the
category m. T
i,t
and T
j,t
refer to the temporal se-
ries of the company i and j at the time t.
2. D is transformed to an affinity matrix A
ij
.
A
ij
=
(
exp(−
D
2
ij
σ
2
), if i 6= j
0, otherwise
σ
2
is a parameter and controls the rate at which
affinity drops off with distance.
Prediction of Company’s Trend based on Publication Statistics and Sentiment Analysis
285

3. The matrix L = D
−
1
2
AD
−
1
2
is created. D is a diag-
onal matrix whose (i,j) element is the sum of A’s
i-th row.
4. The eigenvectors and eigenvalues of L are calcu-
lated, and a new matrix is created from the vectors
associated with the number of l largest eigenval-
ues.
5. Each item now has a vector of l coordinates in the
transformed space. These vectors are normalized
to unit length.
6. K-means is applied to S in the L-dimensional
space.
2.1.3 Impact Estimation by Citation Network
In addition to temporal series, we estimated im-
pact of open patents. We used the Markov Random
Walk(MRW) model to ranking open patents related
to c
m
i
. For each category, we created a graph G
m
=
(C
m
, E
m
) that reflects the relationships between com-
panies in C
m
. C
m
refers to a set of companies in the
category m. Each c
m
i
∈ C
m
is represented by a vec-
tor whose dimension of a vector corresponds to each
company. Each element of a dimension is a citation
count of the company. E
m
is a set of edges, which is a
subset of C
m
∗ C
m
. Each edge e
m
ij
∈ E
m
is associated
with an affinity weight. The weight is computed using
the standard cosine measure between two companies.
We applied MRW model for each category.
The transition probability from c
m
i
to c
m
j
is then
defined by normalizing the corresponding affinity
weight p(i → j) =
aw(i→ j)
∑
|C|
m=1
aw(i→m)
, if
∑
aw 6= 0, oth-
erwise, 0. We used the row-normalized matrix U =
(U
ij
)
|C
m
|∗|C
m
|
to describe G
m
with each company cor-
responding to the transition probability, where U
ij
=
p(i → j). To make U a stochastic matrix, the rows
with all zero elements are replaced by a smoothing
vector with all elements set to
1
|C
m
|
. The matrix form
of the saliency score Score(c
m
i
) can be formulated in
a recursive form as in the MRW model:
~
λ = µU
T
~
λ
+
(1−µ)
|S|
~e, where
~
λ = [Score(c
m
i
)]
|C
m
|∗1
is a vector of
saliency score for the companies. ~e is a column vec-
tor with all elements equal to 1. µ is a damping fac-
tor. We set µ to 0.85, as in the PageRank (Brin and
Page, 1998). The above process can be considered as
a Markov chain by taking the companies as the states
and the final transition matrix is given by Eq. (3), and
each score of the companies is obtained by the princi-
ple eigenvector of the new transition matrix M.
M = µU
T
+
(1− µ)
| C
m
|
~e~e
T
. (3)
~e in Eq. (3) is a column vector with all elements equal
to 1. The principal eigenvector in the MRW model is
obtained by the power method and inverse iteration
method. For implementation, we used the Eigen li-
brary.
3
We chose a vector with the largest eigenval-
ues. We normalized a vector, and obtained company’s
rank scores.
2.1.4 Prediction Model
For each cluster obtained by SP clustering, we esti-
mated prediction model for a category m of the com-
pany i at a time period t, RD
m
i
(t) which is given by
Eq. (4)
RD
m
i
(t) = g
m
s
i
(t) + λR
m
i
(4)
where g
m
s
i
(t) in Eq. (4) is a prediction model obtained
by using temporal series in the cluster s
i
assigning the
company i for the category m, and R
m
i
refers to the
ranking score of i obtained by MRW. λ is a weighting
parameter.
2.2 Prediction of Trend
Given a specific category m of the company i which
we want to predict, we first calculate the minimum
distance between its mean of the cluster µ
j
assigned to
the category m and the temporal series of the company
i by using Eq. (5).
s
i
= argmin
j
|| T
m
i
− µ
j
|| . (5)
For the rest of the prediction timeline, the chosen
cluster’s polynomial is used for prediction.
3 EXPERIMENTS
We used scientific paper publications and open
patents provided by JST,
4
and Mainichi Japanese
newspaper articles from Jan. 2003 to Dec. 2007. We
used financial newspaper articles. The dataset con-
sists of 6,984 publications, 546,230 open patents, and
16,364 newspaper articles. The categories assigned to
publications are different from those of patent docu-
ments. More precisely, the number of categories as-
signed to publications is 155. The IPC(International
Patent Classification) is assigned to each patent doc-
uments. We used second level categories consisting
of 125 categories. Therefore, we manually selected
3
http://eigen.tuxfamily.org/index.php?title=Main
Page
4
www.jst.go.jp/EN/index.html
KDIR 2016 - 8th International Conference on Knowledge Discovery and Information Retrieval
286

Table 1: Category correspondences.
Publication Patent
Computer Computation
Communication eng Electronic communication
Oncology Medical science
Electronics Electronic eng
Table 2: Top 5 triples identified positive/negative.
Positive Negative
(ga gixyouseki koutixyouda) (wo kahousixyuusei shita)
company’s performance is good
revise down sales
(ga mangakukaitou atta) (ga shonshitu baizousita)
have demand granted in full
debt increased
(wo setsubitoushi shita) (wo fusai houkokusita)
have capital investment
report a debt
(ga rieki baizoushita) (ga sonsitu hetta)
profit increased
damage is decreased
(ga uriagedaka fueta) (ga mondai shinkokuda)
the amount sold increased
The problem is so serious
a limited number of categories assigned to the publi-
cation that correspond to patent documents. Table 1
shows four categories used in the experiments.
We used plda
5
to assign positive/negative label to
the sentences in news reports. We estimated the num-
ber of topics (clusters) by searching in steps of 100
from 200 to 1,000. As a result, the minimum en-
tropy value and the number of topics is 0.328, and
500, respectively. We used these in the experiments.
Table 2 shows sample clusters regarded as positive
and negative obtained by LDA. Each cluster shows
the top 5 triples including verb/adjective that did not
appear in the sentiment polarity dictionary. We ob-
served that the extracted triples show positive opin-
ion. This indicates that sentiment analysis contributes
to classify news report into positive or negative. In
contrast, a triplet such as (ga sonsitu hetta) “damage
is decreased” which incorrectly classified into nega-
tive cluster is an obstacle to identify negative news
reports in SVMs classification.
All news reports were parsed by the syntactic an-
alyzer CaboCha(Kudo and Matsumoto, 2003), and
243,528 dependency triples are extracted. We used
them in the experiments. We classified news report
into positive or negative by using linear kernel of
SVM-Light(Joachims, 1998). We set all parameters
of SVMs to their default values. For each category,
we randomly selected news reports including com-
pany name, and manually annotated these . As a
result, we obtained 600 news reports consisting 300
for each of positive/negative. 600 news reports are
trained by using SVMs, and classifiers are obtained.
We randomly selected another 600 news reports, and
used them as test data. As a result, the macro-
5
http://code.google.com/p/plda
averaged F-score concerning to positive and negative
were 0.839, and 0.436, respectively. We added these
news reports classified by SVMs to the original 600
training news reports, and used them as a training data
to classify the total number of 3,000 test news reports.
We obtained the total number of 2,053 positive news
reports including positive training data, and used them
to create temporal series.
We test our method by using closed and open data.
In the experiment using closed data, we created tem-
poral series by using all publications, open patents,
and newspaper articles. These data include 585 com-
panies in all. The difference time period between
training and test data is one year and three years.
When the time difference between training and test
data is one year, we used the data collected from 2003
to 2006 years as a training data, and 2007 year as a
test data. When the time difference is three years, we
used the data collected from 2003 and 2004 years as
a training, and the data collected from 2007 year as
test data. We used five cross validation to evaluate
the method. The estimated parameters are l=10 (the
number of eigenvalues), α=0.5, β=0.3, and γ=0.2 in
Eq. (2), λ=0.1 in Eq. (4), and k=14 of k-means
6
.
In the experiment using open data, we divided
each of the three data into two, training and test
data. Furthermore, we divided training data into
two: training data to estimate parameters, and train-
ing data to construct prediction models by using these
estimated parameters. The estimated parameters are
l=10, α=0.1, β=0.5, γ=0.4 λ=0.1 and k=36. We evalu-
ated prediction performance by using three measures,
i.e. mean-averaged absolute error(MAE), and mean-
averaged relative error(MRE), and the coefficient of
determination(R
2
) (Yan et al., 2012) which are given
by:
MAE =
1
N
N
∑
i
| y
i
(t) − f
i
(t) | (6)
MRE =
1
N
N
∑
i
| y
i
(t) − f
i
(t) |
f
i
( f)
(7)
R
2
= 1−
∑
N
i
(y
i
(t) − f
i
(t))
2
∑
N
i
(y
i
(t) −
y(t))
2
(8)
N shows the number of categories in the company we
want to predict.
y(t) in Eq. (8) refers to the mean of
the observed data at time t, y
i
(t) indicates each ob-
served value and f
i
(t) shows each predicted value.
Eq. (8) shows that the value 1 indicates the best re-
sult, and the closer value to 1 shows better result. On
6
For each category, we used the same value of the pa-
rameters.
Prediction of Company’s Trend based on Publication Statistics and Sentiment Analysis
287
the contrary, the smaller value of Eq. (6) and Eq. (7)
indicates better result.
We recall that we extracted positive news re-
ports from news articles, clustered temporal series,
and estimated impact by citation network. To ex-
amine each method’s effectiveness, we compared our
method with three baselines, i.e. the method not us-
ing news reports(Wo News), the method without SP
clustering(Wo SP), and the method not using impact
estimation by citation network(Wo IM). The results
by both closed and open data are shown in Table 3.
We can see from Table 3 that the results obtained
by our method were better than other methods in three
evaluation measures. Moreover, out method was bet-
ter than other methods in both of the time differences
between training and test data, one and three years.
We note that when we used open data, the difference
between Ours and Wo SP was largest in all of the
three evaluation measures. This shows that clustering
temporal series by the SP clustering especially con-
tributes to prediction. This is reasonable because the
method without SP clustering predicts only one poly-
nomial regression model, while there are variation of
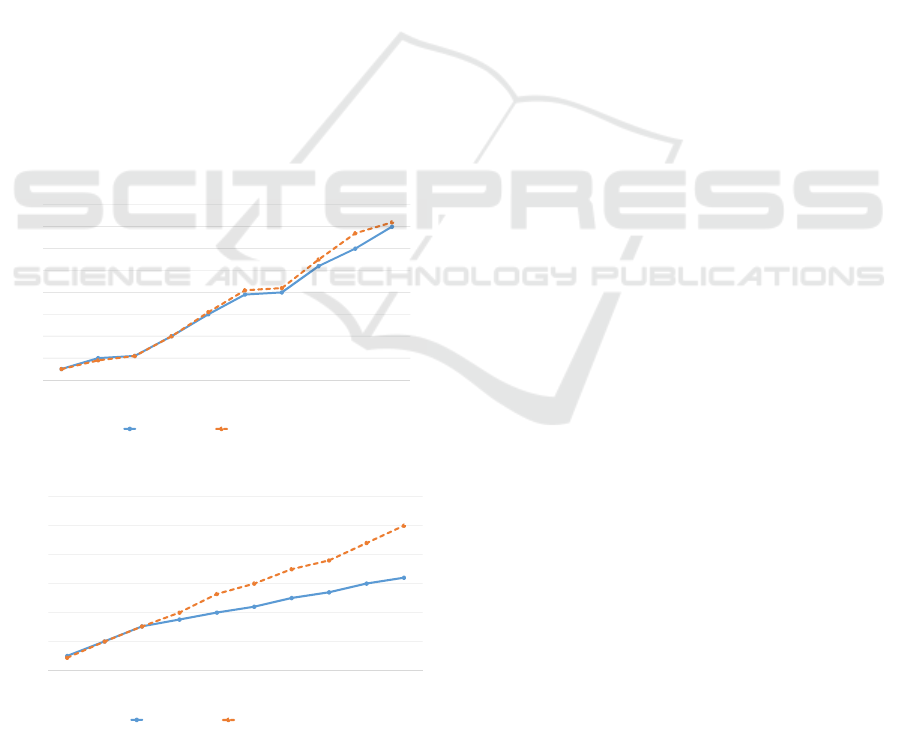
company’s trend on R&D. Figures 3 and 4 illustrates
the result of company’s trend predicted correctly and
incorrectly, respectively.
Ϭ
ϭϬ
ϮϬ
ϯϬ
ϰϬ
ϱϬ
ϲϬ
ϳϬ
ϴϬ
ϭͬϮϬϬϯ ϳͬϮϬϬϯ ϭͬϮϬϬϰ ϳͬϮϬϬϰ ϭͬϮϬϬϱ ϳͬϮϬϬϱ ϭͬϮϬϬϲ ϳͬϮϬϬϲ ϭͬϮϬϬϳ ϳͬϮϬϬϳ
dƌĞŶĚǀĂůƵĞ
Zŝ;ƚͿ
dŝŵĞƉĞƌŝŽĚ
WƌĞĚŝĐƚĞĚǀĂůƵĞ KďƐĞƌǀĞĚǀĂůƵĞ
Figure 3: An Example of correct prediction (Computer).
Ϭ
ϱϬ
ϭϬϬ
ϭϱϬ
ϮϬϬ
ϮϱϬ
ϯϬϬ
ϭͬϮϬϬϯ ϳͬϮϬϬϯ ϭͬϮϬϬϰ ϳͬϮϬϬϰ ϭͬϮϬϬϱ ϳͬϮϬϬϱ ϭͬϮϬϬϲ ϳͬϮϬϬϲ ϭͬϮϬϬϳ ϳͬϮϬϬϳ
dƌĞŶĚǀĂůƵĞ
Zŝ;ƚͿ
dŝŵĞƉĞƌŝŽĚ
WƌĞĚŝĐƚĞĚǀĂůƵĞ ŽďƐĞƌǀĞĚǀĂůƵĞ
Figure 4: An Example of incorrect prediction (Electronics).
X-axis in both Figures 3 and 4 indicates a time pe-
riod of training data, 2003 and 2004 years, and a test
data from 2007 year. Y-axis shows the specific com-
pany’s trend obtained by Eq. (4). A higher value of
the company’s trend indicates more attractive in some
business area. The business areas in Figures 3 and
4 is computer, and electronics, respectively. Doted
line shows observed value, and a solid line refers to
predicted value. We can see from Figure 3 that two
lines are very close to each other in a prediction year,
2007. In contrast, Figure 4 shows that in year 2007,
the electronics area in the company is more attractive
while our prediction result shows that it becomes a
slow curve incorrectly.
There are no existing work related to prediction
of company’s future trend. Therefore, we compared
our method to the most recent state of the art citation-
based work related to high impact academic paper
prediction proposed by Davletov et al (Davletov et al.,
2014). More precisely, we applied Davletov’s method
(Citation) to open patents and compared it with the
result obtained by our method. Because in our data,
only the open patents corpus has citation information.
The results are shown in Table 4.
Table 4 shows that in both of the closed and open
data, the results obtained by our method was better
to those obtained by citation based method except for
three years of time difference between training and
test data in closed data by using MRE measure. When
the creation time period of the test data differs three
years from that of the training data, the overall per-
formance of prediction decreased. However, the re-
sults obtained by our method were still better to those
obtained by citation based method. This shows that
prediction model obtained by combining three data is
effective to predict company’s future trend.
4 CONCLUSION
We proposed a method for predicting company’s fu-
ture trend on R&D. We used three types of data col-
lections, scientific papers, open patents, and news-
paper articles to estimate temporal change of trends
on company’s business area. The results by using
Japanese data show that the prediction model ob-
tained by combining three data is effective to predict
company’s future trends, especially the results show
that SP clustering contributes overall performance.
There are a number of directions for future work.
In the sentiment analysis, we should consider nega-
tive news articles to estimate a declining trend, and we
should be able to obtain further advantages in efficacy
by overcoming the lack of sufficient news reports by
incorporating transfer learning approaches (Dai et al.,
2007). Moreover, it is necessary to improve positive
KDIR 2016 - 8th International Conference on Knowledge Discovery and Information Retrieval
288
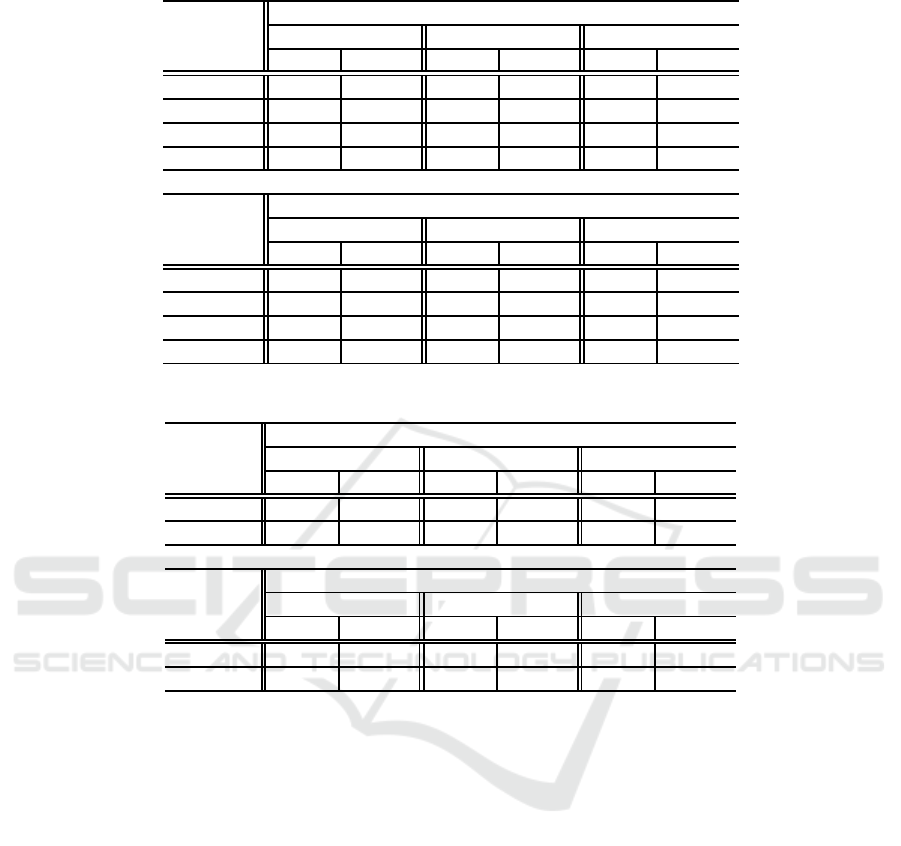
Table 3: Prediction results.
Closed data
MAE MRE R
2
1 year 3 years 1 year 3 years 1 year 3 years
Ours 12.4 12.6 0.234 0.634 0.999 0.980
Wo News 12.8 43.1 0.641 1.580 0.923 0.947
Wo SP 24.8 72.3 0.264 1.07 0.929 0.965
Wo IM 18.4 22.6 0.239 0.694 0.929 0.979
Open data
MAE MRE R
2
1 year 3 years 1 year 3 years 1 year 3 years
Ours 16.7 70.2 0.541 0.794 0.988 0.952
Wo News 30.3 76.3 0.770 0.832 0.928 0.892
Wo SP 32.8 77.8 0.862 1.27 0.819 0.842
Wo IM 15.8 69.6 0.556 0.794 0.985 0.944
Table 4: Comparative results.
Closed data
MAE MRE R
2
1 year 3 years 1 year 3 years 1 year 3 years
Ours 12.4 12.6 0.234 0.634 0.999 0.980
Citations 19.2 35.5 0.244 0.620 0.937 0.977
Open data
MAE MRE R
2
1 year 3 years 1 year 3 years 1 year 3 years
Ours 16.7 70.2 0.541 0.794 0.988 0.952
Citations 34.0 167 0.556 0.805 0.972 0.919
news classification by smoothing terms which do not
occur in the dictionary. We used Japanese newspaper
articles to extract positive news reports in the exper-
iments, while the method is applicable to other tex-
tual corpus. To evaluate the robustness of the meth-
ods, experimental evaluation by using other data such
as Nikkei technology can be explored in future. Fi-
nally, comparison to other related work which make
use of textual corpus (Joshi et al., 2010; Yagatama
et al., 2011) will also be considered in the future.
ACKNOWLEDGEMENTS
The authors would like to thank the referees for their
comments on the earlier version of this paper. The au-
thors are also to thank Japan Science and Technology
Agency for making available the data.
REFERENCES
Adams, J. (2005). Early citation counts correlate with ac-
cumulated impact. Scientometrics, 63(3):567–581.
Bethard, S. and Jurafsky, D. (2010). Who should i cite?
learning literature search models form citation behav-
ior. In Proc. of 19th ACM International Conference
on Information and Knowledge Management, pages
609–618.
Blei, D. M., Ng, A. Y., and Jordan, M. I. (2003). Latent
Dirichlet Allocation. Machine Learning, 3:993–1022.
Brin, S. and Page, L. (1998). The Anatomy of a Large-
scale Hypertextual Web Search Engine. In Computer
Networks and ISDN Systems, volume 30, pages 1–7.
Dai, W., Yang, Q., Xue, G., and Yu, Y. (2007). Boosting for
Transfer Learning. In Proc. of the 24th International
Conference on Machine Learning, pages 193–200.
Davletov, F., Aydin, A. S., and Cakmak, A. (2014). High
impact academic paper prediction using temporal and
topological features. In Proc. of 23rd ACM Inter-
national Conference on Information and Knowledge
Management, pages 491–498.
Prediction of Company’s Trend based on Publication Statistics and Sentiment Analysis
289

Hofmann, T. (1999). Probabilistic Latent Semantic Index-
ing. In Proc. of the 22nd Annual International ACM
SIGIR Conference on Research and Development in
Information Retrieval, pages 50–57.
Joachims, T. (1998). SVM Light Support Vector Machine.
In Dept. of Computer Science Cornell University.
Joshi, M., Das, D., Gimpel, K., and Smith, N. A. (2010).
Movie reviews and revenues: An experiment in text
regression. In Proc of Human Language Technologies,
pages 293–296.
Kobayashi, N., Inui, K., Matsumoto, Y., Tateishi, K., and
Fukushima, S. (2005). Collecting Evaluative Expres-
sions for Opinion Extraction. Journal of Natural Lan-
guage Processing, 12(3):203–222.
Kogan, S., Levin, D., Routledge, B. R., Sagi, J. S., and
Smith, N. A. (2009). Predicting risk from financial
reports with regression. In Proc of Human Language
Technologies, pages 272–280.
Koppel, M. and Shtrimberg, I. (2004). Good news or bad
news? let the market decide. In Proc. of the AAAI
Spring Symposium on Exploring Attitude and Affect
in Text, pages 86–88.
Kudo, T. and Matsumoto, Y. (2003). Fast method for kernel-
based text analysis. In Proc. of the 41st Annual Meet-
ing of the Association for Computational Linguistics,
pages 24–31.
Lavrenko, V., Schmill, M., Lawrie, D., Ogilvie, P., Jensen,
D., and Allan, J. (2000). Mining of concurrent text
and time series. In Proc of the KDD 2000 Conference
on Text Mining Workshop, pages 37–44.
Li, Y., Yang, M., and Zhang, Z. (2013). Scientific Articles
Recommendation. In Proc. of the ACM International
Conference on Information and Knowledge Manage-
ment CIKM 2013, pages 1147–1156.
McGovern, A., Friedland, L., Hay, M., Gallagher, B., Fast,
A., Neville, J., and Jensen, D. (2003). Exploiting re-
lational structure to understand publication patterns in
high-energy physics. 5(2):165–172.
McNamara, D., Wong, P., Christen, P., and Ng, K. S. (2013).
Predicting high impact academic papers using cita-
tion network features. In In Trends and Application
in Knowledge Discovery and Data Mining, pages 14–
25.
Milea, V., Sharef, N. M., Almeida, R. J., Kaymak, U., and
Frasineer, F. (2010). Prediction of the msci euro in-
dex based on fuzzy grammer fragments extracted from
european central bank statements. In Proc of the In-
ternational Conference of Soft Computing and Pattern
Recognition, pages 231–236.
Ng, A. Y., Jordan, M. I., and Weiss, Y. (2002). On Spectral
Clustering: Analysis and an Algorithm. In dietterich,
T. G., Becker, S., and Ghahramani, Z., editors, Ad-
vances in Neural Information Processing systems 14.
Cambridge MA MIT Press.
Salton, G. and Buckley, C. (1990). Improving retrieval per-
formance by relevance feedback. In Journal of Amer-
ican Society for Information Sciences, volume 41,
pages 288–297.
Shi, X., Leskovec, J., and McFarland, D. A. (2010). Citing
for hogh impact. In Proc of the 10th Annual Joint
Conference on Digital Libraries, pages 49–58.
Turney, P. D. (2002). Thumbs Up or Thumbs Down? Se-
mantic Orientation Applied to Un-supervised Classi-
fication of Reviews. In Proc. of the 40th Annual Meet-
ing of the Association for Computational Linguistics,
pages 417–424.
Yagatama, D., Heilman, M., Connor, B. O., Dyer, C., Rout-
ledge, B. R., and Smith, N. A. (2011). Predicting a
scientific community’s response to an article. In Proc
of the Conference on Empirical Methods in Natural
Language Processing, pages 594–604.
Yan, R., Tang, J., Liu, X., Shan, D., and Li, X. (2012). Ci-
tation count prediction: Learning to estimate future
citations for literature. In Proc of the 20th ACM Inter-
national Conference on Information and Knowledge
Management, pages 1247–1252.
KDIR 2016 - 8th International Conference on Knowledge Discovery and Information Retrieval
290
