
Exploration and Visualization of Big Graphs
The DBpedia Case Study
Enrico G. Caldarola
1,2
, Antonio Picariello
1
, Antonio M. Rinaldi
1,3
and Marco Sacco
4
1
Department of Electrical Engineering and Information Technologies, University of Naples Federico II, Napoli, Italy
2
Institute of Industrial Technologies and Automation, National Research Council, Bari, Italy
3
IKNOS-LAB Intelligent and Knowledge Systems, University of Naples Federico II, LUPT 80134, Napoli, Italy
4
Institute of Industrial Technologies and Automation, National Research Council, Milano, Italy
Keywords:
Graph Database, Big Data, NoSQL, Data Visualization, DBpedia, Neo4J.
Abstract:
Increasingly, the data and information visualization is becoming strategic for the exploration and explanation
of large data sets. The Big Data paradigm pushes for new ways, new technological solutions to deal with the
big volume and the big variety of data today. Not surprisingly, a plethora of new tools have emerged, each of
them with pros and cons, but all espousing the cause of ”Bigness of Data”. In this paper, we take one of this
emerging tools, namely Neo4J, and stress its capabilities in order to import, query and visualize data coming
from a big case study: DBpedia. We will describe each step in this study focusing on the used strategies
for overcoming the different problems mainly due to the intricate nature of the case study and its volume.
We confront with both the intensional schema of DBpedia and its extensional part in order to obtain the best
result in its visualization. Finally, an attempt to define some criteria to simplify the large-scale visualization of
DBpedia will be made, providing some examples and considerations which have arisen. The ultimate goal of
this work is to investigate techniques and approaches to get more insights from the visual representation and
analytics of large graph databases.
1 INTRODUCTION
Nowadays, Data or Information Visualization have
become interesting and wide research fields. If the
main goal of Data Visualization is to communicate
information clearly and efficiently to users, involv-
ing the creation and study of the visual representation
of data – i.e., “information that has been abstracted
in some schematic form, including attributes or vari-
ables for the units of information” (Friendly and De-
nis, 2001) – the Information Visualization main task
is the study of (interactive) visual representations
of abstract data to reinforce human cognition. The
abstract data may include both numerical and non-
numerical data, such as text and geographic infor-
mation. The field of information visualization has
emerged from research in human-computer interac-
tion, computer science, graphics, visual design, psy-
chology, and business methods. It is increasingly ap-
plied as a critical component in scientific research,
digital libraries, data mining, financial data analy-
sis, market studies, manufacturing production con-
trol, and drug discovery (Bederson and Shneiderman,
2003). Furthermore, the challenges that the Big Data
imperative (Caldarola et al., 2015; Caldarola et al.,
2014; Caldarola and Rinaldi, 2015) imposes to data
management severely impact on data visualization.
The “bigness” of large data sets and their complexity
in term of heterogeneity contribute to complicate the
representationof data, making the drawing algorithms
complex. To make an example, let us consider the
popular social network Facebook, in which the nodes
represent people and the links represent interpersonal
connections; we note that nodes may be accompanied
by information such as age, gender, and identity, and
links may also have different types, such as colleague
relationships, classmate relationships, and family re-
lationships. The effective representation of all the in-
formation at the same time is challenging. The most
common solution is to use visual cues, such as color,
shape, or transparency to encode different attributes.
At the same time, the availability of large data coming
from human activities, exploration and experiments,
together with the investigations of new and efficiently
ways of visualizing them, open new perspectivesfrom
which to view the world we live in and to make busi-
Caldarola, E., Picariello, A., Rinaldi, A. and Sacco, M.
Exploration and Visualization of Big Graphs - The DBpedia Case Study.
DOI: 10.5220/0006046802570264
In Proceedings of the 8th International Joint Conference on Knowledge Discovery, Knowledge Engineering and Knowledge Management (IC3K 2016) - Volume 1: KDIR, pages 257-264
ISBN: 978-989-758-203-5
Copyright
c
2016 by SCITEPRESS – Science and Technology Publications, Lda. All rights reserved
257

ness. The Infographics become Infonomic, a compos-
ite term between the term Information and Economics
that wield information as a real asset, a real oppor-
tunity to make business and to discover the world.
Various techniques have been proposed for graph vi-
sualization for the last two decades and they will be
presented in the next section. As far as we can say
here, the principled representation methodology we
agree on is the Visual Information Mantra presented
by Keim in (Keim et al., 2008). It can be summarized
as follows: “Analyze first, show the important, zoom,
filter and analyze further, details on demand”.
The reminder of the paper is organized as follows.
After a literature review on graph visualization tech-
niques and methodologies and a review of existing
works specifically focused in DBpedia exploration
contained in section 2, a description of the case study
and its data ecosystem is provided in section 3. Af-
terward, starting from an explanation of the approach
used for the DBpedia Ontology Schema import proce-
dure within Neo4j, in section 4, the attempts for im-
porting and visualizing the DBpedia extensional part
are described in section 5 and 6. Finally, section 7
draws the conclusion summarizing the major findings
and outlining future investigations.
2 RELATED WORKS
Since the study conducted in this paper consists in
the visual representation of DBpedia inside the Neo4j
graph DB (Webber, 2012), this section focuses mainly
on a literature review in Graph Visualization, refer-
ring to other well-known works in the literature for a
complete review of the techniques and theories in In-
formation Visualization (Spence, 2001; Mazza, 2009;
Fayyad et al., 2002; Ware, 2012). Graphs are tra-
ditional and powerful tools for visually representing
sets of data and the relations among them by draw-
ing a dot or circle for every vertex, and an arc be-
tween two vertices if they are connected by an edge.
If the graph is directed, the direction is indicated
by drawing an arrow. Basically, there are generally
accepted aesthetic rules to draw a graph (Purchase,
1997), which include: distribute nodes and edges
evenly, avoid edge crossing, display isomorphic sub-
structures in the same manner, minimize the bends
along the edges. However, since it is quite impossi-
ble to meet all rules at the same time, some of them
conflict with each other or they are very computation-
ally expensive, practical graphical layouts are usu-
ally the results of compromise among the aesthetics.
There exists different graph visualization layouts in
the literature, such as: the Tree Layout, the Space
Division Layout, the Matrix Layout and the Spring
Layout (Fruchterman and Reingold, 1991), to men-
tion a few. The latter will be used in this work and
it worth to spend few words on it. The Spring Lay-
out, also known as Force-Directed layout, is a popular
strategy for general graph visualization. The strategy
consists in modeling the graph as physical systems
of rings or springs. The attractive idea about spring
layout is that the physical analogy can be very natu-
rally extended to include additional aesthetic informa-
tion by adjusting the forces between nodes. As one of
the first few practical algorithms for drawing general
graphs, spring layout is proposed by Eades in 1984
(Eades, 1984). Since then, his method is revisited
and improved in different ways (Gansner and North,
1998). Mathematically, Spring layout is based on a
cost (energy) function, which maps different layouts
of the same graph to different non-negative numbers.
Through approachingthe minimum energy, the layout
results reaches better and better aesthetically pleasing
results. The main differencesbetween differentspring
approaches are in the choice of energy functions and
the methods for their minimization.
Specifically regarding the visualization of DBpe-
dia, there are not many works in the literature. The
most part of them confront with the LOD (Linked
Open Data) paradigm where DBpedia represents
the nucleus of the whole ecosystem. In (Brunetti
et al., 2012) a formal Linked Data Visualization
Model (LDVM) has proposed to dynamically con-
nect data with visualizations, by incorporating ana-
lytical extraction and visual abstraction steps, while
in (Helmich et al., 2014) the authors use the LDVM
implemented by Payola (a framework for analysis and
visualization of Linked Data) to visualize RDF Data
Cubes. On the visualization of RDF (Resource De-
sciption Framework) data in general, (Cammarano
et al., 2007) proposes an automatic technique for
mapping data attributes to visualization attributes for-
mulating this problem as a schema matching prob-
lem. In (Chan et al., 2009) a Web-based visualiza-
tion system has been proposed in order to incorporate
data integration into an iterative, interactive data ex-
ploration and analysis process of Wikipedia over DB-
pedia semantic graph. Finally, in (Bikakis and Sel-
lis, 2016) the authors survey the systems developed
by the Semantic Web community in the context of
the Web of Linked Data (WoD), and discuss to which
extent these satisfy the contemporary requirements,
summing up that WoD community should consider
scalability and performance as vital requirements for
the development of the future exploration and visu-
alization systems, but also should provide more so-
phisticated mechanisms that capture users preferences
KDIR 2016 - 8th International Conference on Knowledge Discovery and Information Retrieval
258

and assist them throughout large data exploration and
analysis tasks. By adopting this last advice, our work
aim at easing the exploration of large data like DBpe-
dia, by exploiting the features of new tools emerged
in the Big Data landscape.
3 DBpedia CASE STUDY
The case study presented in this paper consists in
the partial reification of the DBpedia dataset inside
the Neo4J graph database. This one is an ACID-
compliant transactional database with native graph
storage and processing where everything is stored in
form of either an edge, a node or an attribute (Web-
ber, 2012; Robinson et al., 2013; Vukotic et al.,
2015). DBpedia is a crowd-sourced community ef-
fort to extract structured information from Wikipedia
and Wikidata and make this information available on
the Web (Lehmann et al., 2015). By extracting the
structured content of Wikipedia, such as infoboxes,
tables, lists, and categorization data, and putting them
in a consistent knowledge base, it is possible to an-
swer expressive queries otherwise not allowed via the
text search engine inside Wikipedia: Give me all cities
in New Jersey with more than 10,000 inhabitants or
Give me all Italian musicians from the 18th century,
are just few examples. More importantly, with the ad-
vent of the Web of Data, several data providers have
started to publish and interlink data on the Web, in-
spired by the Tim Berners-Lees Linked Data princi-
ples and since DBpedia consists in a generalist knowl-
edge base covering different domains such as mu-
sic, science, sports, arts, and so forth, various data
providers have started to set RDF links from their data
sets to DBpedia, making the latter one of the central
interlinking-hubs of the emerging Web of Data.
DBpedia is a very large dataset. The current
English version (2015-04) describes 4.58 million
”things” with 583 million ”facts”. In addition, DB-
pedia presents localized versions in 125 languages,
which describe 38.3 million things. Altogether the
DBpedia 2015-04 release consists of 3 billion pieces
of information (RDF triples) out of which 583 million
were extracted from the English edition of Wikipedia,
2.46 billion were extracted from other language edi-
tions, and about 50 million are links to external data
sets. 4.22 million resources are classified in a consis-
tent ontology, including 1,445,000 persons, 735,000
places (including 478,000 populated places), 411,000
creative works (including 123,000 music albums,
87,000 films and 19,000 video games), 241,000 or-
ganizations (including 58,000 companies and 49,000
educational institutions), 251,000 species and 6,000
diseases. All this information are stored inside Vir-
tuoso RDF Store and are available for download in
different formats. Mainly, DBpedia project provides
files as N-Triples and N-Quads, where the N-Quads
version contains additional provenance information
for each statement, but a tabular version of some of
the core DBpedia data sets are provided as CSV and
JSON files. In the following subsections, a detailed
description of the DBpedia data will be outlined.
3.1 DBpedia Schema and Dataset
The DBpedia data ecosystem consists of two funda-
mental parts: the DBpedia Schema (i.e., the insten-
sional part, the DBpedia Ontology) and the proper
dataset (i.e., the extensional part). The current ver-
sion of the Schema contains 735 classes, 1,098 ob-
ject properties, 1,583 datatype properties, 132 spe-
cialized datatype properties, 408 owl:equivalentClass
and 200 owl:equivalentProperty mappings external
vocabularies. The extensional part of DBpedia con-
tains the canonicalized and the localized datasets.
While the first ones contain triples extracted from
the respective Wikipedia whose subject and object
resource have an equivalent English article, the sec-
ond ones contain also the triples whose URIs do
not have an equivalent English article. A URI is a
Uniform Resource Identifier (URI) and consists in
a string of characters used to identify a resource.
Its international extension (IRI) may contain charac-
ters from the Universal Character Set (Unicode/ISO
10646), including Chinese or Japanese kanji, Ko-
rean, Cyrillic characters, and so forth, and allowing
identification of resources in other languages. All
DBpedia IRIs/URIs in the canonicalized datasets use
the generic namespace http://dbpedia.org/resource/.
The localized datasets use DBpedia IRIs (not
URIs) and language-specific namespaces, e.g.,
http://pt.dbpedia.org/resource/Brasilia.
Each thing in the DBpedia data set is de-
noted by a de-referenceable IRI- or URI-based ref-
erence of the form http://dbpedia.org/resource/Name,
where Name is derived from the URL of the
source Wikipedia article, which has the form
http://en.wikipedia.org/wiki/Name, so that each DB-
pedia entity is tied directly to a Wikipedia article. Ev-
ery DBpedia entity name resolves to a description-
oriented Web document (or Web resource). Each DB-
pedia entity is described by various properties, the
most important being: the label, a short and long En-
glish abstract, a link to the corresponding Wikipedia
page, and a link to an image depicting the thing (if
available).
In this study, we focus on the canonicalized
Exploration and Visualization of Big Graphs - The DBpedia Case Study
259

Table 1: DBpedia data set files.
Dataset Description
Mapping-based
Types
Contains the rdf:types of the instances which have been extracted from the infoboxes
Mapping-based
Properties
Contains the actual data values that have been extracted from infoboxes (e.g., ’vol-
ume’).
Mapping-based
Properties (Specific)
Contains properties which have been specialized for a specific class using a specific
unit. e.g. the property height is specialized on the class Person using the unit centime-
tres instead of metres.
Titles Contains the rdfs:labels representing the title of the corresponding Wikipedia page
Short Abstract Contains the short abstract for each DBpedia resource. It is the value of the
rdfs:commentproperty
Extended Abstracts Contains the long abstract for each DBpedia resource. It is the value of the dbpe-
dia.org/ontology/abstract property.
External Links Contains the wikipedia External links. For example, the books.google.com URL for a
DBpedia Book resource.
dataset, and in particular on the English version of
dataset files. Table 1 reports a not comprehensive list
of files available from the download section of DBpe-
dia.org website, with a short description of their con-
tent. They are the most generic ones (the most im-
portant ones) and those we need in our work. All files
are available in N-Triples (.nt and .nq) and Turtle (.ttl)
format.
4 IMPORTING AND
VISUALIZING THE DBpedia
ONTOLOGY IN Neo4J
The first step in creating and visualizing the DBpe-
dia data set inside a running instance of Neo4J Graph
database has regarded its intensional schema, i.e.,
the DBpedia Ontology Schema. In order to accom-
plish this step, the Jena API and the Neo4J Java API
have been used for accessing the schema ontology
serialized in a owl file and, later on, for converting
its classes and properties in nodes and edges inside
Neo4J. A simple mapping mechanism has been used:
each ontological class has been converted in a node
with an automatically generated id and three proper-
ties: class URI, class label and class comment. Subse-
quently, the class nodes have been linked together via
two types of edges: LINK and SUBCLASSOF. The
first refers to the ontological object properties link-
ing two classes each other, while the second refers to
the hierarchical is-a relationship existing between two
classes in the ontology. The first type of edge has got
an automatically generated id, the object property la-
bel and the object property URI, while the second has
no properties. All this information are retrieved from
the DBpedia ontology owl file. Figure 1 shows a large
scale representation of the DBpedia ontology. For the
sake of clarity and to avoid a confused cloud of words,
the figure shows only a bunch of nodes with their la-
bels and an arc between two nodes if a object property
exists between the corresponding classes in the on-
tology. The figure shows only the largest connected
subgraph of the DBpedia Ontology not the whole on-
tology. Conversely, figures 2 and 3 show an excerpt of
the DBpedia Schema converted into a Neo4J labelled
graph and visualized in Cytoscape with a simple cus-
tom style. The first image highlights some of the link
relations existing between nodes correspondingto ob-
jected properties in the DBpedia schema and uses a
force-directed layout to draw the graph, while the sec-
ond one shows the hierarchical relationships subclas-
sof existing between classes and uses a Sugiyama-like
algorithm (Sugiyama, 2002) to draw the hierachical
links existing between nodes.
5 IMPORTING AND
VISUALIZING THE DBpedia
DATA SET
For the extensional part of DBpedia graph, we have
focused on two data set files, namely, the Mapping-
based Types and the Mapping-based Properties, leav-
ing out the specific mapping-based properties file be-
cause it contains specialized properties which go be-
yond the scope of this work. In fact, the procedure
described here is a generalistic one for importing and
visualizing DBpedia resources, regardless the specific
features of their ontological nature. Before digging
into the procedure details, it worths to have a close
look at the first two files. The Mapping-based Types
file contains rdf triples in the form: subject rdf:type
KDIR 2016 - 8th International Conference on Knowledge Discovery and Information Retrieval
260
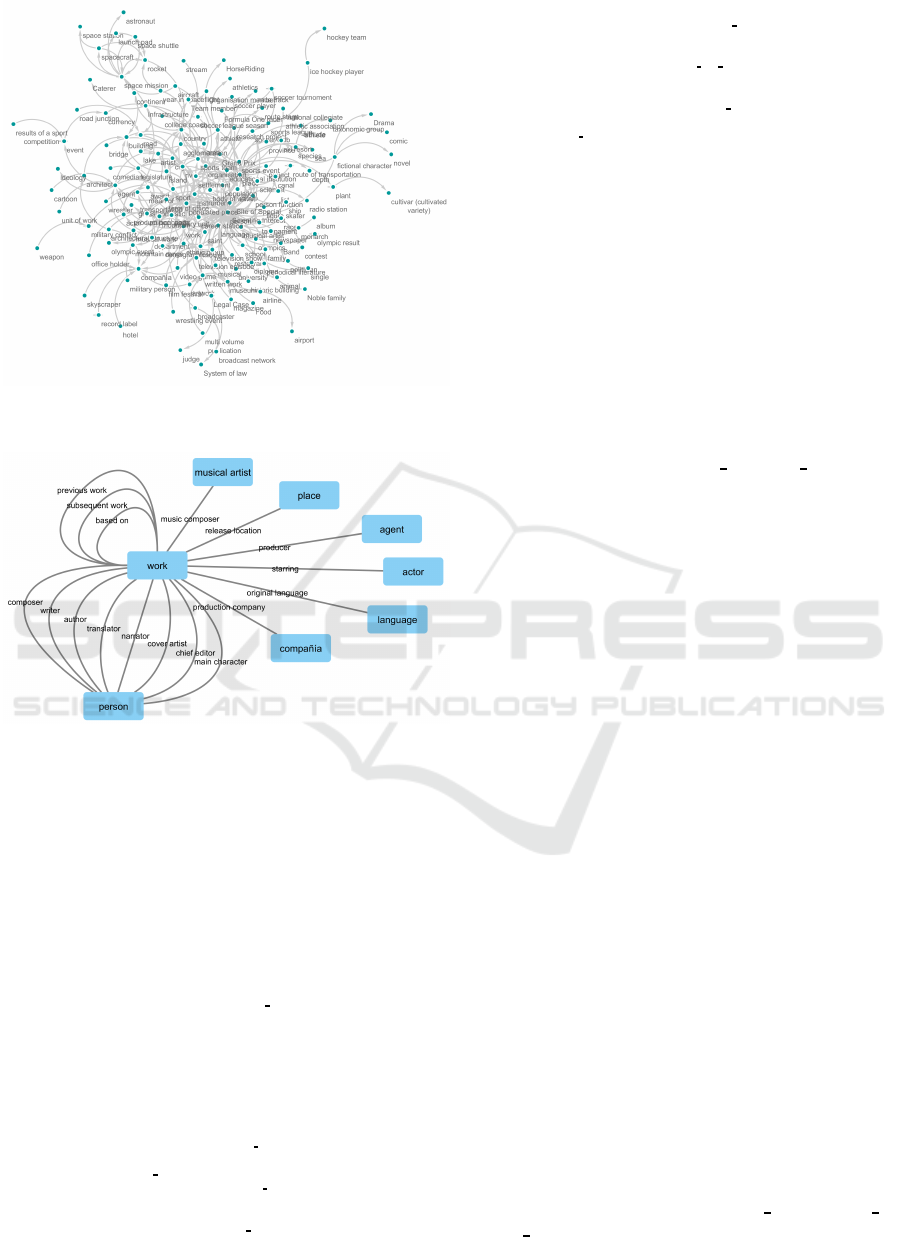
Figure 1: A large scale view of the DBpedia Ontology
Schema.
Figure 2: First view of the DBpedia Schema in Neo4J: the
object properties.
object. Each triple describes an instance (i.e., a DB-
pedia resource) of a particular type, e.g., a Person, a
Book, or just a Thing. An excerpt of the file follows:
<h ttp : / / dbpedia . org / r eso ur ce / Autism> <h tt p : / /www.w3 . org
/1999/02/22 − rdf −syntax −ns # type> <h tt p : / / dbpedia . org /
ontolog y / Disease> .
<h ttp : / / dbpedia . org / r eso ur ce / Anarchism> <h t t p : / /www. w3. org
/1999/02/22 − rdf −syntax −ns # type> <h tt p : / /www. w3. org
/2 002 /07 /owl#Thing> .
<h ttp : / / dbpedia . org / r eso ur ce / Alabama> <h tt p : / /www. w3. org
/1999/02/22 − rdf −syntax −ns # type> <h tt p : / / dbpedia . org /
ontolog y / Admin i s t r ati v e R e g i on> .
<h ttp : / / dbpedia . org / r eso ur ce / Abraham
Lincoln> <h tt p : / /www.
w3. org /1999/02/22 − rdf −syntax −ns #type> <h tt p : / / dbpedia
. org / on tol o g y / Of fi c e H older> .
On the other hand, the Mapping-based Properties
file contains rdf triples in the form: subject property
object. An excerpt of the file follows:
<h ttp : / / dbpedia . org / r eso ur ce / Alf r ed
Hitchcock> <h tt p : / /
dbpedia . org / ontolog y / almaMater> <h tt p : / / dbpedia . org /
r e so ur ce / Enfield
Town> .
<h ttp : / / dbpedia . org / r eso ur ce / Amitabh
Bachchan> <h tt p : / /
dbpedia . org / ontolog y / almaMater> <h tt p : / / dbpedia . org /
r e so ur ce / Na i ni t al> .
<h ttp : / / dbpedia . org / r eso ur ce / Aloi s
Alzheimer> <h ttp : / /
dbpedia . org / ontolog y / i n s t i t u t i on > < h tt p : / / dbpedia . org
/ r e so ur ce / F r ankf u r t> .
<h ttp : / / dbpedia . org / r eso ur ce / Alber t o
Giacomett i > <h tt p : / /
dbpedia . org / ontol o g y / t ra in i ng > <h tt p : / / dbpedia . org /
r e so ur ce / Geneva> .
<h ttp : / / dbpedia . org / r eso ur ce /A.
E . Housman> <h ttp : / / dbpedia
. org / on t o logy / almaMater> <h t tp : / / dbpedia . org / r eso u rc e
/ Oxford> .
<h ttp : / / dbpedia . org / r eso ur ce / British
Army> <h tt p : / / dbpedia .
org / ontology / country> < ht tp : / / dbpedia . org / r e sou rce /
El iz ab et h
I I > .
5.1 DBpedia Mapping-based Types
All DBpedia instances have been imported in Neo4J
by mapping them to specific Neo4J nodes with two
properties: the id (automatically generated) and the
URI, in the form: http://dbpedia.org/resource/Name,
where Name is the label of the corresponding in-
stance. All nodes are linked to other nodes through
oriented arcs as resulting in the mapping-based types
file. Technically, it has been created a first map con-
taining the node id and the DBpedia resource URI and
a second map (serialized in a CSV file) containing a
list of pairs in the form (subject id, object id) that rep-
resents the subject and the object of the rdf:type prop-
erty.
Figure 4 shows the results of the following query
in Cypher:
match (n {URI: ’http://dbpedia.org/ontology/Book’})
-[r: rdf_type]-(m)
return n,r,m limit 10
Figure 5 shows the results of this other query in
Cypher:
match (n
{URI: ’http://dbpedia.org/resource/Aristotle’})
-[r: rdf_type]-(m)
return n,r,m
This figure shows all the semantic categories to
which Aristotle belong.
An important difference holds between the two
figures above. While the first one put a DBpedia
ontology class (Book) at the center and links it to a
limited number of instances through incoming arcs
around it, the second one, put a DBpedia resource,
an instance, at the center (Aristotle) and links it to the
semantic categories to which Aristotle belong. In this
case, the arcs from the center nodes outcome.
5.2 DBpedia Mapping-based Properties
The import of DBpedia mapping-based properties has
been accomplished through a proceduresimilar to that
described in the previous section, the only difference
being the presence of the extra field (predicate) in the
csv file containing the mappings. These ones have
been serialized in the form: (subject
id, predicate id,
object
id). Figure 6 shows an excerpt of the mapping-
based properties graph inside Neo4J resulting from
Exploration and Visualization of Big Graphs - The DBpedia Case Study
261
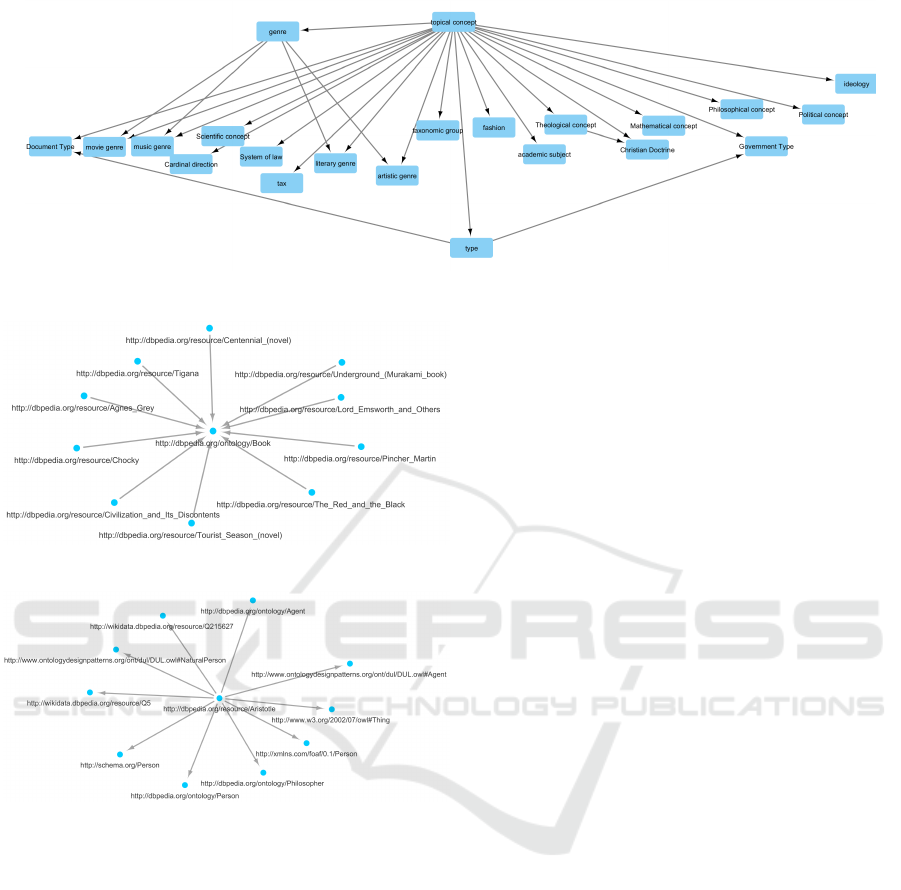
Figure 3: Second view of the DBpedia Schema in Neo4J: the hierarchical properties.
Figure 4: The instances of the class Book limited to 10.
Figure 5: All the semantic categories of the resource Aris-
totle.
the following below. This representation is centered
on the resource (Aristotle in this case) and shows all
the properties attached to it.
MATCH (n {URI:
’http://dbpedia.org/resource/Aristotle’})-[r:p]
->(m)
RETURN n,r,m LIMIT 25
6 INCREMENTAL IMPORT AND
VISUALIZATION OF DBpedia
INSTANCES THROUGHOUT
THE ONTOLOGY SCHEMA
The DBpedia.org team provides another important
way to download all the data instances from the exten-
sional dataset, that is, DBpedia as csv tables. Techni-
cally, for each class in the DBpedia ontology (such
as Book, Person, Film, Writer, or Band), DBpedia
provides a single CSV or JSON file containing all in-
stances of this class. Each instance is described by
its URI, an English label and a short abstract, the
mapping-based infobox data describing the instance
(extracted from the English edition of Wikipedia),
geo-coordinates, and external links. Altogether 685
CSV/JSON files are provided, packed in a single file
or in a separate CSV/JSON file for each class for
download. Each file starts with 4 headers:
1. The properties labels;
2. The properties URIs;
3. The properties range labels;
4. The properties range URIs.
The first column of each file contains the URIs
of the instances of the current class. The remaining
columns contain the values for the properties that are
defined for this class in the DBpedia ontology. In our
work, we have taken the Book.csv and the Writer.csv
files containing all book instances and all authors of
written works in DBpedia, respectively, and have tried
to link each instance of Book with the corresponding
instance of Writer. Book.csv contains 67 properties la-
bels with an equal number of properties URIs, range
labels and range URIs in the header section and 31030
books, while Writer.csv contains 109 properties labels
with an equal number of properties URIs, range la-
bels and range URIs and 29995 writers. For this ex-
ploratory study, we have taken into consideration only
the first fourth properties of Book beside the instance
URI, namely, the rdf label, the rdf comment, the au-
thor label and the author, and the first two properties
of Writer: the rdf label and the rdf comment. The
bridge between the Book class and the Writer class is
the author property of Book, whose URI in the DB-
pedia ontology is http://dbpedia.org/ontology/author
and the range is the set of Person whose URI
KDIR 2016 - 8th International Conference on Knowledge Discovery and Information Retrieval
262
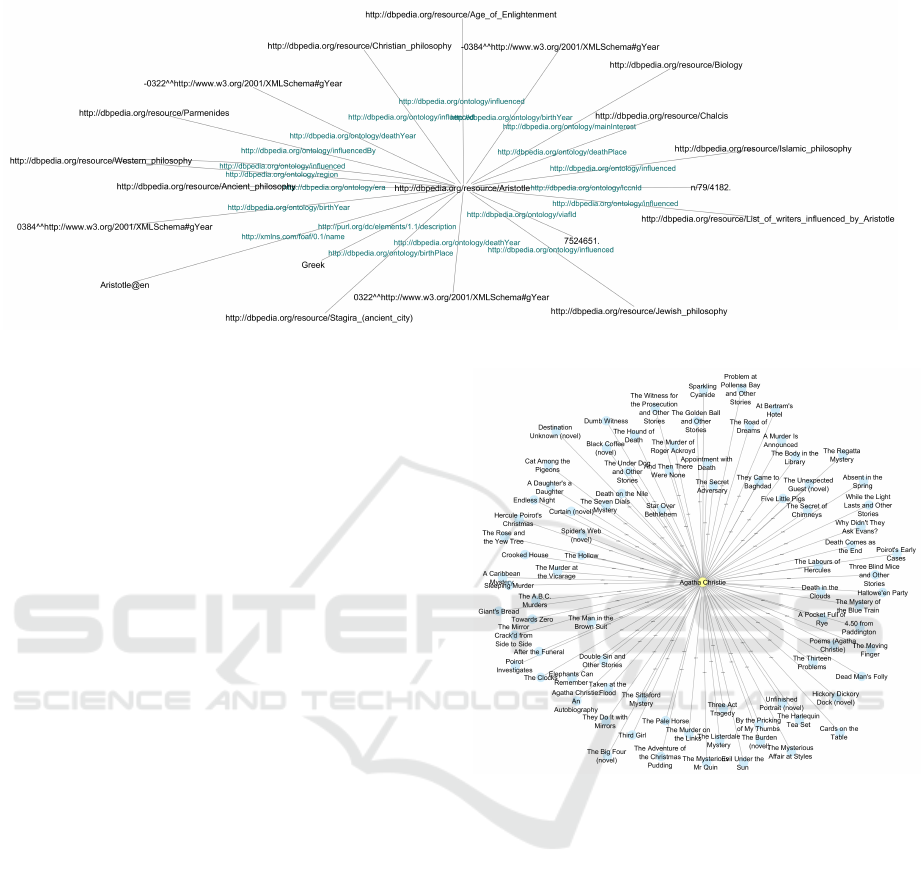
Figure 6: Aristotle properties in DBpedia.
is http://dbpedia.org/ontology/Person. To deal with
these files, we have written a simple routine in Java
that incrementally import instances from semantic
categories, which are related through specific link-
ing properties. In this example, the Book category is
linked via the author property to the Writer category,
as explained previously. In this preliminary work,
the liking property has been individuated manually
and only two classes have been imported in the run-
ning instance of Neo4J. Figure 7 shows an excerpt of
the Neo4J graph obtained through the ontology based
incremental import of DBpedia categories described
here. With simple cypher query like the following:
MATCH (b: Book)-[r:author]->(w: Writer)
RETURN b,r,w LIMIT 25
it is possible to obtained bunch of nodes (books)
surrounding the author node (writer), like in the fig-
ure that shows all the books by Agatha Christies. The
use of DBpedia Ontology can automatize as much as
possible the individuation of link properties between
classes. Generally, an ontology-based approach in vi-
sualization of large graphs (Rinaldi, 2008; Cataldo
and Rinaldi, 2010) can improve performance by out-
lining a semantic-based strategy in populating and ex-
ploring labeled properties graphs.
7 CONCLUSIONS
In this paper, we have described an experience of
importing, exploring and visualizing DBpedia into a
graph database. We have confronted with both the
intensional schema and the extensional data set, and,
obviously, the latter has resulted the most challenging.
One consideration immediately arises: the large scale
and exhaustive representation of DBpedia is merely
a chimera. Beyond the scalability and performance
Figure 7: Agatha Christie’s books.
issues, the visualization of large graph data requires
simplification and the definition of a clear style which
put order in the resulting confused and dense structure
of nodes and edges, but also it requires a strategy for
importing and exploring data.
As the first attempt to load DBpedia instances
has gone in the direction of importing all the types
instances and all the mapping-based generic proper-
ties from DBpedia files, an intricate net of nodes has
rapidly exploded in graph visualizer tools when tried
to navigate from one instance to another, without fil-
tering the query and consequently reducing the num-
ber on nodes involved. For this reason, an incremen-
tal approach in importing and visualizing instances,
throughout the ontology schema, has resulted more
practical. Additionally, a similar approach allows to
extends the knowledge graph by engulfing in the orig-
inal nucleus the knowledge domains in the neighbor-
hood of the starting core, in a fashion that is very close
Exploration and Visualization of Big Graphs - The DBpedia Case Study
263

to the way in which the human mind organizes con-
cepts and links them with each other(Rinaldi, 2008).
Moreover the use of efficient techniques to visualize
large knowledge bases could be useful in advanced
ontology based and mutimedia applications (Rinaldi,
2009; Moscato et al., 2010; Rinaldi, 2014). How-
ever, it presents a major drawback: the need to define
manually the linking properties between instances be-
longing to two or more ontology classes.
Nevertheless, this approach worths future investi-
gations and research works, mainly in the attempt to
automatize as much as possible the choice of proper-
ties that link classes each other.
REFERENCES
Bederson, B. B. and Shneiderman, B. (2003). The craft
of information visualization: readings and reflections.
Morgan Kaufmann.
Bikakis, N. and Sellis, T. (2016). Exploration and visual-
ization in the web of big linked data: A survey of the
state of the art. arXiv preprint arXiv:1601.08059.
Brunetti, J. M., Auer, S., and Garc´ıa, R. (2012). The linked
data visualization model. In International Semantic
Web Conference (Posters & Demos).
Caldarola, E. G., Picariello, A., and Castelluccia, D. (2015).
Modern enterprises in the bubble: Why big data mat-
ters. ACM SIGSOFT Software Engineering Notes,
40(1):1–4.
Caldarola, E. G. and Rinaldi, A. M. (2015). Big data:
A survey - the new paradigms, methodologies and
tools. In Proceedings of 4th International Conference
on Data Management Technologies and Applications,
pages 362–370.
Caldarola, E. G., Sacco, M., and Terkaj, W. (2014). Big
data: The current wave front of the tsunami. ACS Ap-
plied Computer Science, 10(4):7–18.
Cammarano, M., Dong, X., Chan, B., Klingner, J., Talbot,
J., Halevy, A., and Hanrahan, P. (2007). Visualization
of heterogeneous data. Visualization and Computer
Graphics, IEEE Transactions on, 13(6):1200–1207.
Cataldo, A. and Rinaldi, A. M. (2010). An ontological ap-
proach to represent knowledge in territorial planning
science. Computers, Environment and Urban Systems,
34(2):117–132.
Chan, B., Talbot, J., Wu, L., Sakunkoo, N., Cammarano,
M., and Hanrahan, P. (2009). Vispedia: on-demand
data integration for interactive visualization and ex-
ploration. In Proceedings of the 2009 ACM SIG-
MOD International Conference on Management of
data, pages 1139–1142. ACM.
Eades, P. (1984). A heuristics for graph drawing. Congres-
sus numerantium, 42:146–160.
Fayyad, U. M., Wierse, A., and Grinstein, G. G. (2002). In-
formation visualization in data mining and knowledge
discovery. Morgan Kaufmann.
Friendly, M. and Denis, D. J. (2001). Milestones
in the history of thematic cartography, statis-
tical graphics, and data visualization. URL
http://www.datavis.ca/milestones.
Fruchterman, T. M. and Reingold, E. M. (1991). Graph
drawing by force-directed placement. Softw., Pract.
Exper., 21(11):1129–1164.
Gansner, E. R. and North, S. C. (1998). Improved force-
directed layouts. In Graph Drawing, pages 364–373.
Springer.
Helmich, J., Kl´ımek, J., and Neˇcask`y, M. (2014). Visualiz-
ing rdf data cubes using the linked data visualization
model. In The Semantic Web: ESWC 2014 Satellite
Events, pages 368–373. Springer.
Keim, D., Andrienko, G., Fekete, J.-D., G¨org, C., Kohlham-
mer, J., and Melanc¸on, G. (2008). Visual analytics:
Definition, process, and challenges. In Information
visualization, pages 154–175. Springer.
Lehmann, J., Isele, R., Jakob, M., Jentzsch, A., Kon-
tokostas, D., Mendes, P. N., Hellmann, S., Morsey,
M., van Kleef, P., Auer, S., et al. (2015). Dbpedia–
a large-scale, multilingual knowledge base extracted
from wikipedia. Semantic Web, 6(2):167–195.
Mazza, R. (2009). Introduction to information visualiza-
tion. Springer Science & Business Media.
Moscato, V., Picariello, A., and Rinaldi, A. M. (2010). A
recommendation strategy based on user behavior in
digital ecosystems. In Proceedings of the Interna-
tional Conference on Management of Emergent Digi-
tal EcoSystems, pages 25–32. ACM.
Purchase, H. (1997). Which aesthetic has the greatest effect
on human understanding? In Graph Drawing, pages
248–261. Springer.
Rinaldi, A. M. (2008). A content-based approach for doc-
ument representation and retrieval. In Proceedings of
the eighth ACM symposium on Document engineer-
ing, pages 106–109. ACM.
Rinaldi, A. M. (2009). An ontology-driven approach for se-
mantic information retrieval on the web. ACM Trans-
actions on Internet Technology (TOIT), 9(3):10.
Rinaldi, A. M. (2014). A multimedia ontology model based
on linguistic properties and audio-visual features. In-
formation Sciences, 277:234–246.
Robinson, I., Webber, J., and Eifrem, E. (2013). Graph
databases. ” O’Reilly Media, Inc.”.
Spence, R. (2001). Information visualization, volume 1.
Springer.
Sugiyama, K. (2002). Graph drawing and applications for
software and knowledge engineers, volume 11. World
Scientific.
Vukotic, A., Watt, N., Abedrabbo, T., Fox, D., and Partner,
J. (2015). Neo4j in Action. Manning.
Ware, C. (2012). Information visualization: perception for
design. Elsevier.
Webber, J. (2012). A programmatic introduction to neo4j.
In Proceedings of the 3rd annual conference on Sys-
tems, Programming, and Applications: Software for
Humanity, pages 217–218. ACM.
KDIR 2016 - 8th International Conference on Knowledge Discovery and Information Retrieval
264
