
Graph-based Rating Prediction Using Eigenvector Centrality
Dmitry Dolgikh and Ivan Jel
´
ınek
Department of Computer Science and Engineering, Faculty of Electrical Engineering,
Czech Technical University in Prague, Prague, Czech Republic
Keywords:
Recommendation Systems, Graph-based Recommendations, User Preference, Social Network Analysis,
Eigenvector Centrality.
Abstract:
The most of recommendation systems rely on the statistical correlations of the past explicitly given user rating
for items (e.g. collaborative filtering). However, in conditions of insufficient data of past rating activities,
these systems are facing difficulties in rating prediction, this situation is commonly known as the cold-start
problem. This paper describes how graph-based represendation and Social Network Analysis can be used to
help dealing with cold-start problem. We proposed a method to predict user rating based on the hypotesis
that the rating of the node in the network corresponded to the rating of the most important nodes which are
connected to it. The proposed method has been particularly applied to three MovieLens datasets to evaluate
rating predition performance. Obtained results showed competitiveness of our method.
1 INTRODUCTION AND
RELATED WORK
Rating prediction is an important and popular re-
search topic in the area of recommendation systems.
In a typical Collaborative filtering system user assigns
ratings to already known items, so the system can
predict ratings of unknown items based on the rat-
ings that other similar users assigned to these items
(Celma, 2010). Similarity among the users can be
represented by the similarity of rows in user-item ma-
trix where each row represents the rating given by
user to the particular item (i.e. who rated the same
items with similar scores). The most highly rated un-
known items commonly are presented as recommen-
dations to the user.
Despite the fact that Collaborative filtering is one
of the most widely used recommendation methods it
has several issues, such as the complexity of the find-
ing the similar users in case of sparse user-item ma-
trix (i.e. cold-start problem) and subjectivity and am-
biguity of explicitly given rating (Ricci et al., 2011).
Moreover, according to (Cena et al., 2010) and (Gena
et al., 2011), users have different preferences with re-
spect to the rating scales to use for the object they are
evaluating i.e. rating scale are differently perceived
by users.
Recommendation systems collect data for a sig-
nificant period of time and emotional state of the user
can vary greatly during this period, causing variation
of the rating. As a consequence, the search for similar
users may give false positive results.
Content-based filtering approach solves some of
the issues of the Collaborative filtering by collecting
information describing items. This approach relies on
the similarity of items, which is defined as objective
distance between items (e.g. the similarity of prop-
erties), without any influence by subjective factors.
Items which are similar to the preferences given by
user are typically presented as recommendations. Ob-
vious problem of this approach is the need to extract,
maintain and store a lot of relevant and reliable infor-
mation about the items that can be a challenging task
depending on the domain complexity. For instance,
due to the vastness of the multimedia field, the user
is often unable to describe his preferences correctly
and fully. In addition, in a real world his preferences
at the specific moment of time may be influenced by
the other unknown factors such as various psycholog-
ical effects or his friends’ opinions. Besides, content-
based filtering approach is limited by the type of con-
tent that can be recommended in that way.
Towards improving the results of recommenda-
tions, many researchers use so-called Hybrid methods
to find the best combination of the abovementioned
methods (Burke, 2002).
Nowadays, usage of graph-based structures and
application graph theory to extract additional hid-
228
Dolgikh, D. and Jelínek, I.
Graph-based Rating Prediction using Eigenvector Centrality.
DOI: 10.5220/0006044902280233
In Proceedings of the 8th International Joint Conference on Knowledge Discovery, Knowledge Engineering and Knowledge Management (IC3K 2016) - Volume 1: KDIR, pages 228-233
ISBN: 978-989-758-203-5
Copyright
c
2016 by SCITEPRESS – Science and Technology Publications, Lda. All rights reser ved
den features is gaining popularity (Nu
˜
nez-Gonzalez
and Gra
˜
na, 2015; Tiroshi et al., 2014; Zeng et al.,
2013). Graph-based representation allows to visu-
alise and deeply understand semantic relations among
items and users. Introduced in the beginning of the
20th century by sociologists, Social Network Analy-
sis (SNA)(Scott, 2012) became widespread in recent
years due to the advent of the social network websites
such as Facebook and Twitter.
For example, the effective identification of impor-
tant nodes and, in general, discovering of hidden net-
work organization structure is a challenging task for
current large-scale social networks (Sun et al., 2014).
Like the most powerful people in the community, im-
portant nodes influence not only the nodes directly
connected to them, but also the whole network. User’s
interests also have heterogeneous structure and they
can be represented by the network of connected nodes
(interests) which have varying degrees of importance.
Typical for the Collaborative filtering methods user-
items relationships can be easily represented as a bi-
partite graph and applying SNA to this network struc-
ture might discover some hidden features. Obtained
additional information is capable to help to better un-
derstand the data that can be useful to improve the
results of recommendation process.
The advantages of usage of SNA motivated us
to examine rating prediction process from the other
side. We have used the network structure to predict
the user’s given rating based only on user’s personal
preferences and his previous feedback. The proposed
method has no limitations concerning the type of rec-
ommended items, which is typical for content-based
systems, and also does not rely on the other users’
feedback, as collaborative filtering algorithm does.
This approach adapts to the user’s behaviour and al-
lows us to calculate recommendations independently
for each user.
Summary of Contributions
The main contributions of the paper are the follow-
ings:
• Novel graph-based rating prediction method that
is based on eigenvector centrality.
• Rating impact measuring process, which helps to
deal with the variation of rating.
• Experiments on three well-known MovieLens
datasets to show the comparison results in dif-
ferent data sparseness and measuring its per-
formance with respect to well-known MAE and
RMSE metrics.
factorfactor
itemitem
itemitem
factorfactor
factorfactor
itemitem
factorfactor
itemitem
factorfactor
itemitem
itemitem
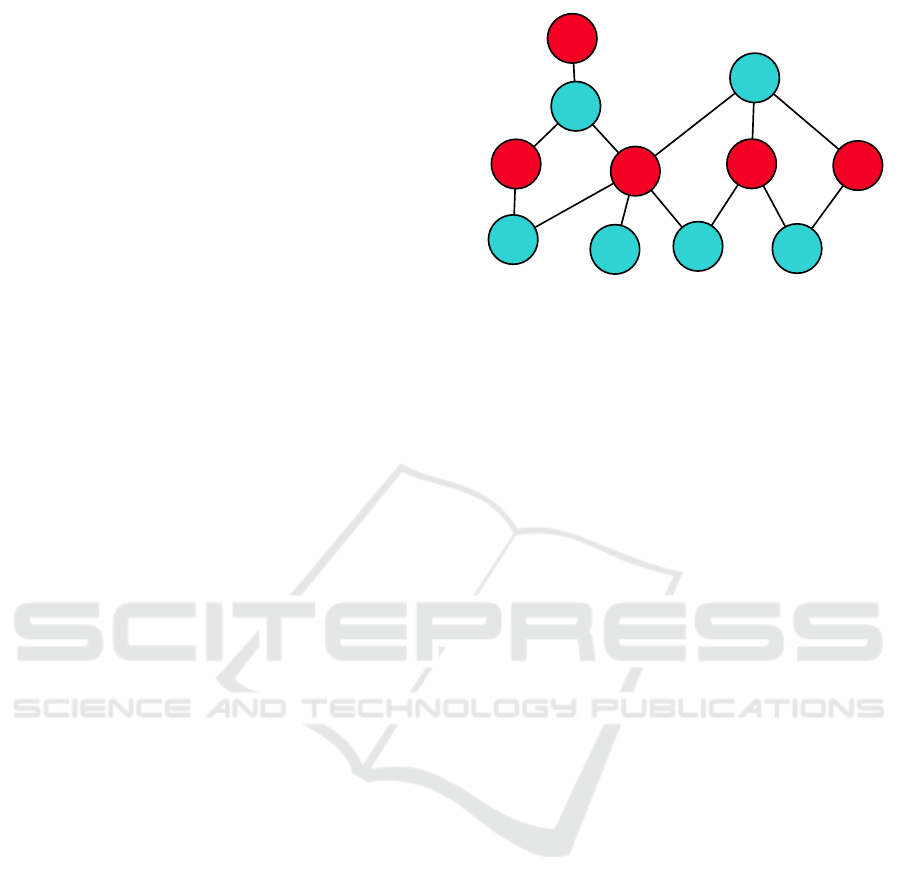
Figure 1: The example of created undirected bipartite item-
factor graph.
2 METHODOLOGY
Our research was based on the hypothesis that the rat-
ing of the node in the network corresponds to the rat-
ing of the most important nodes which are connected
to it.
We have focused on the item-item relationships
inside users interests. This examination allowed us
to look deeper into the preferences of each individ-
ual user, by identifying the underlying factors that in-
fluenced his choice. The item-item relationships are
of little use to find hidden patterns, because they de-
scribe only the existence of a link (similarity) between
objects, but do not explain the reason for this connec-
tion. To compensate it, we needed to add the interme-
diate objects in the relationships between items - the
factors.
The factor is any object semantically defining
the existence of connection between items. In other
words, if there is a common factor between two or
more items, these items are semantically connected.
Genres (categories) of music, films or literature may
be considered as the representative examples of fac-
tors.
As a result, we have created undirected bipartite
graph G = (I, F, E) where I is a set of items, F is a
set of factors and E denoting the edges of the graph
(Figure 1).
Following our aforementioned hypothesis, we
require to determine the importance of each node in
the network, before we can predict the rating. For
this purpose, we have used the SNA eigenvector
centrality measure. Based on the idea that the node
importance in a network is increased by having con-
nections to other nodes that are themselves important,
eigenvector centrality computes the centrality of a
node based on the centrality of its neighbours. Hence,
the value of eigenvector centrality can be large not
Graph-based Rating Prediction using Eigenvector Centrality
229

0.40.4
0.5890.589
0.5070.507
1.01.0
0.40.4
0.3680.368
0.6080.608
0.580.58
0.2160.216
0.7280.728
0.360.36
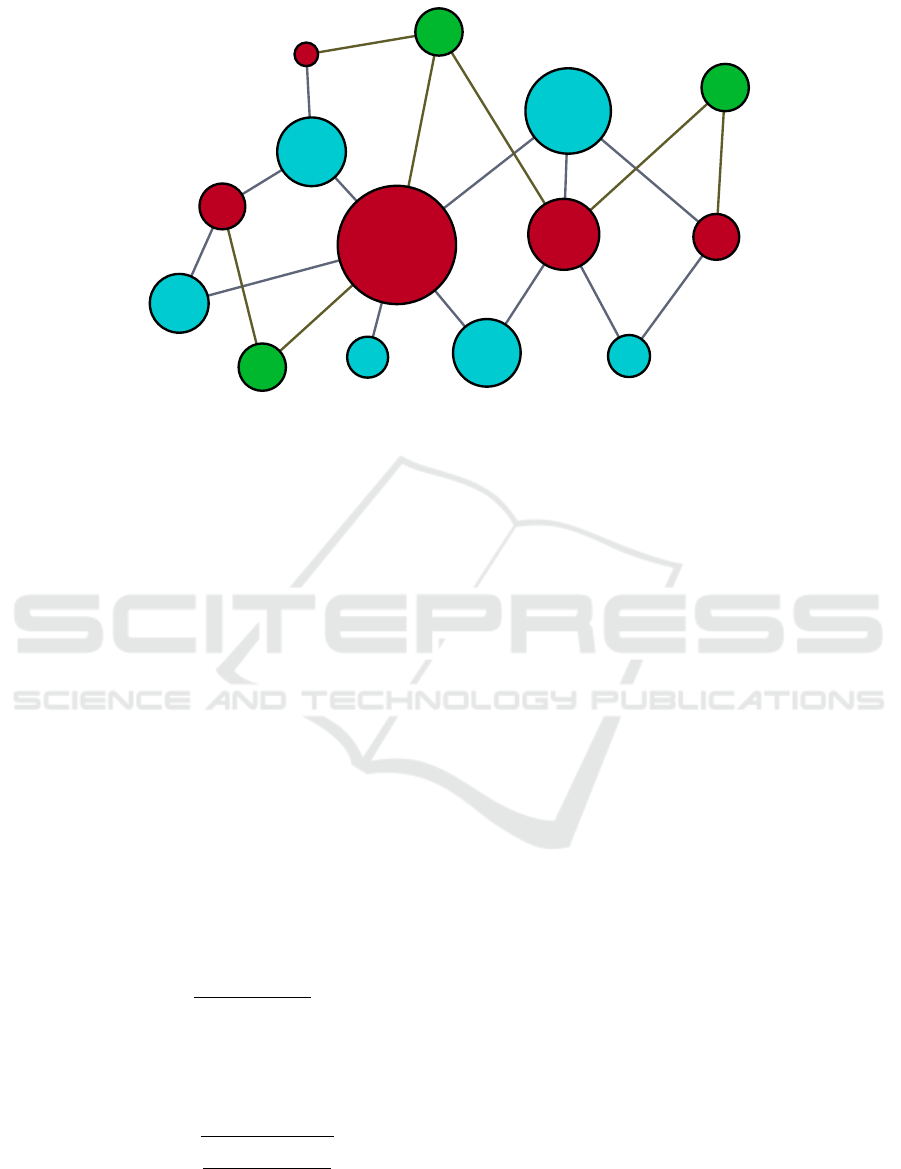
Figure 2: Nodes are ranked, based on the normalized value
of eigenvector centrality.
only because a node has many neighbours, but also
if it has important neighbours (or in both cases).
Definition 1 (Eigenvector Centrality). For given
graph G the eigenvector centrality c(i) of node i is
proportional to the sum of the centralities of i’s neigh-
bours:
c(i) =
∑
t∈G
A
it
c(t) (1)
where A
it
is an element of adjacency matrix (New-
man, 2010). This measure was firstly proposed by
Bonacich in 1987 (Bonacich, 1987). Figure 2 demon-
strates the example of graph, where nodes are ranked,
based on the value of centrality.
In the most of the practical cases a rating scale is
discrete, not continuous. As we mentioned before,
user’s choice can be influenced by the unknown
factors, so rating scale can be differently interpreted
depending on user’s current emotional state. As a
result, we are dealing with atypical rating for this
user. We elaborated rating impact measure using
eigenvector centrality to deal with outliers. This
measure allowed us to correctly approximate the
rating of node, based on the rating of its neighbours.
Definition 2 (Rating Impact). Let R be predetermined
numerical set of possible ratings (e.g. from 1 to 5),
predicted rating r
i
of the node i must be an element of
predetermined set R. Based on the eigenvector cen-
trality we can determine the impact of each possible
rating in the subset of node neighbours.
A rating impact I
r
of rating r ∈ R can be measured
by:
I
r
=
∑
i∈N
c(i) (2)
where N is a subset of node neighbours which
have rated by rating r and c(i) is a value of eigen-
vector centrality of node i ∈ N.
High-impact rating among node neighbours can
be used as the predicted rating of node. In other
words, neighbour nodes are ”voting” for the best rat-
ing according to their importance. Similarly to eigen-
vector centrality, rating of node can be chosen not
only because node has a lot of neighbours rated by
some rating, but also if it has important neighbours.
3 EXPERIMENTAL EVALUATION
3.1 Datasets
To implement and evaluate the proposed algorithm,
we have exploited three datasets provided by Grou-
pLens Research group at University of Minnesota
1
to
show the comparison results in different data sparse-
ness. The first dataset is MovieLens 1M dataset,
which contains 1,000,209 anonymous ratings of ap-
proximately 3,900 movies made by 6,040 users, rat-
ings are made on a 1-to-5-star scale. The sec-
ond dataset is MovieLens 10M dataset, which con-
tains 10,000,054 ratings applied to 10,681 movies by
71,567 users, ratings are made on a 5-star scale, with
half-star increments (from 0.5 to 5). The last dataset is
MovieLens 20M dataset, which contains 20,000,263
ratings of 27,278 movies made by 138,493 users, rat-
ings are made on a 5-star scale, with half-star incre-
ments (from 0.5 to 5) (Harper and Konstan, 2015).
All of them provided genres and year of release as
side information for each movie.
3.2 Evaluation Procedure
From the abovementioned datasets we produced small
datasets consisted of ratings, given by randomly se-
lected 1000 users. Each user’s subset of ratings was
randomly 80%-20% split to train-test subsubsets of
the ratings data.
For our experiment, we developed the prediction
script in Python programming language. For graph
constructing, analysis and eigenvector centrality cal-
culation we used NetworkX library (Hagberg et al.,
2008).
Afterwards, for each user, prediction script con-
structed undirected bipartite (movie-factor) graph us-
ing training set and conducted calculating eigenvector
centrality for each node in this graph. Genres and year
of release were used as the factors.
At the initial stage all factor nodes are not rated.
Obtained values of centrality were used by the script
to predict rating for each factor node in the graph
1
http://grouplens.org/
KDIR 2016 - 8th International Conference on Knowledge Discovery and Information Retrieval
230
factorfactor
moviemovie
moviemovie
factorfactor
factorfactor
moviemovie
factorfactor
moviemovie
factorfactor
moviemovie
moviemovie
NewNew
NewNew
NewNew
Figure 3: Rating prediction.
based on the rating impact measure proposed in sec-
tion 2. After this step, all nodes in the graph were
rated.
At the next step, to predict the rating of movies
in the test set, our script created nodes for each of
them and connected them to their factor nodes if they
existed in the graph before (Figure 3). Thereafter the
script performed the similar rating prediction process
for new nodes based on the rating of factor nodes to
which they were connected.
We repeated this process five times to reduce the
variance caused by the random split selection.
3.3 Evaluation Metrics
In order to measure the accuracy of the system pre-
dicted ratings Mean Absolute Error (MAE) and the
RMSE (Root Mean Square Error) were used. They
are well-known metrics widely used for the evalua-
tion of the accuracy of the predicted ratings (Sotelo
and Juayek, 2015; Barjasteh et al., 2015; Gupta and
Nagpal, 2015; Shi et al., 2015). MAE is defined as
MAE
u
=
∑
i∈U
test
|ˆr
i
− r
i
|
|U
test
|
(3)
where U
test
is the test set of user’s ratings, ˆr
i
and r
i
are
predicted and actual rating value respectively.
RMSE gives more weight to larger prediction er-
rors and is defined as
RMSE
u
=
s
∑
i∈U
test
(ˆr
i
− r
i
)
2
|U
test
|
(4)
For each metric, the results were also averaged
over all users.
3.4 Results and Discussion
To reduce the variance, the results were averaged over
5 validation folds. Table 1 summarizes our results. A
smaller value of metrics indicates better accuracy.
As can be seen from the results, our method
showed better performance for the MovieLens 20M
dataset. This is caused by the fact that this dataset
not only contains more ratings data, but also a greater
amount of side information about the movies. For
example, the average number of genres per movie
has increased from 1.65 to 2 in comparison with 1M
dataset. The total number of movies has also in-
creased, enabling users to evaluate their preferences
in more detail. The results for datasets 10M and 20M
do not differ so much due to the fact that they contain
approximately the same amount of side information.
However, based on the fact that the number of
users and ratings increased nearly two times, it can
be assumed, that the proposed method shows stable
results despite variability of users in the dataset.
The results indicate that this method is at the
level of the performance of some recently introduced
semantic-based and social-based methods (Qian et al.,
2014; Sotelo and Juayek, 2015), but without requiring
a large volume of metadata. Another benefit of our
method is the possibility to calculate recommenda-
tions for each user independently, which can be useful
in the case of parallel computations or in case of ab-
sence data about other users (e.g. new e-commerce
website).
Graph-based Rating Prediction using Eigenvector Centrality
231
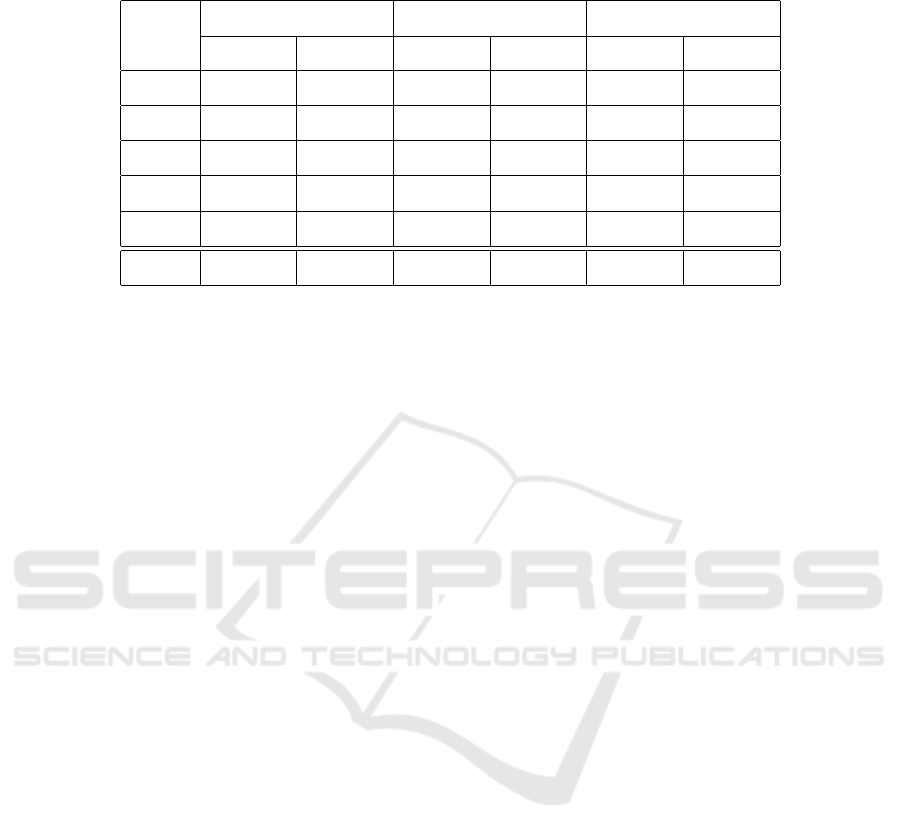
Table 1: The results of experiments using MovieLens dataset. A smaller value of metrics indicates better accuracy.
n
MovieLens 1M MovieLens 10M MovieLens 20M
MAE RMSE MAE RMSE MAE RMSE
1 0.8598 1.1719 0.8334 1.1207 0.8189 1.1026
2 0.8558 1.1719 0.8315 1.1198 0.8139 1.0916
3 0.8543 1.1568 0.8184 1.1068 0.8392 1.1169
4 0.8471 1.1601 0.8184 1.1064 0.8082 1.0891
5 0.8762 1.1504 0.8218 1.1114 0,8096 1.1002
Avg. 0.8586 1.1845 0.8250 1.1130 0.8180 1.1001
4 CONCLUSION AND FUTURE
WORK
We have introduced a graph-based rating prediction
method that is based on eigenvector centrality. The
advantages of usage of eigenvector centrality let us
create rating prediction method using items metadata
as well as explicitly given rating. We also proposed
rating impact measuring process to compensate the
variation of rating, considering the individual rating
behaviour of the particular user.
The proposed method can be useful to predict rat-
ing in conditions of insufficient data of past rating ac-
tivities of other users that help dealing with the cold-
start problem. This method can also be used in com-
bination with Collaborative Filtering approaches to
predict rating for untypical users.
We conducted our experiments on three well-
known MovieLens datasets from the movie domain
to evaluate the proposed method and to compare the
results with existing methods. The results indicated
that this method was at the level of the performance
of the recently introduced content-based methods, but
without requiring a large volume of metadata.
Furthermore, the presented method provides the
the ability to calculate the recommendations for each
user separately.
An important future work direction is investigat-
ing of alternative ways to adaptive recommendation
process to the user’s behaviour. We are also inter-
ested in exploiting additional data sources for online
recommendations, for example Linked Open Data.
ACKNOWLEDGEMENTS
This work was supported by the Grant Agency of
the Czech Technical University in Prague, grant No.
SGS16/163/OHK3/2T/13.
REFERENCES
Barjasteh, I., Forsati, R., Masrour, F., Esfahanian, A.-H.,
and Radha, H. (2015). Cold-start item and user rec-
ommendation with decoupled completion and trans-
duction. In Proceedings of the 9th ACM Conference
on Recommender Systems, RecSys ’15, pages 91–98,
New York, NY, USA. ACM.
Bonacich, P. (1987). Power and centrality: A family of mea-
sures. American Journal of Sociology, 92(5):1170–
1182.
Burke, R. (2002). Hybrid recommender systems: Survey
and experiments. User modeling and user-adapted in-
teraction, 12(4):331–370.
Celma, O. (2010). Music recommendation and discovery:
The long tail, long fail, and long play in the digital
music space. Springer Science & Business Media.
Cena, F., Vernero, F., and Gena, C. (2010). User Model-
ing, Adaptation, and Personalization: 18th Interna-
tional Conference, UMAP 2010, Big Island, HI, USA,
June 20-24, 2010. Proceedings, chapter Towards a
Customization of Rating Scales in Adaptive Systems,
pages 369–374. Springer Berlin Heidelberg, Berlin,
Heidelberg.
Gena, C., Brogi, R., Cena, F., and Vernero, F. (2011). User
Modeling, Adaption and Personalization: 19th In-
ternational Conference, UMAP 2011, Girona, Spain,
July 11-15, 2011. Proceedings, chapter The Impact of
Rating Scales on User’s Rating Behavior, pages 123–
134. Springer Berlin Heidelberg, Berlin, Heidelberg.
Gupta, S. and Nagpal, S. (2015). An empirical analysis
of implicit trust metrics in recommender systems. In
KDIR 2016 - 8th International Conference on Knowledge Discovery and Information Retrieval
232

Advances in Computing, Communications and Infor-
matics (ICACCI), 2015 International Conference on,
pages 636–639.
Hagberg, A. A., Schult, D. A., and Swart, P. J. (2008).
Exploring network structure, dynamics, and function
using NetworkX. In Proceedings of the 7th Python
in Science Conference (SciPy2008), pages 11–15,
Pasadena, CA USA.
Harper, F. M. and Konstan, J. A. (2015). The movielens
datasets: History and context. ACM Trans. Interact.
Intell. Syst., 5(4):19:1–19:19.
Newman, M. (2010). Networks: An Introduction. Oxford
University Press, Inc., New York, NY, USA.
Nu
˜
nez-Gonzalez, J. D. and Gra
˜
na, M. (2015). Bioin-
spired Computation in Artificial Systems: Interna-
tional Work-Conference on the Interplay Between
Natural and Artificial Computation, IWINAC 2015,
Elche, Spain, June 1-5, 2015, Proceedings, Part II,
chapter Graph-Based Learning on Sparse Data for
Recommendation Systems in Social Networks, pages
61–68. Springer International Publishing, Cham.
Qian, X., Feng, H., Zhao, G., and Mei, T. (2014). Person-
alized recommendation combining user interest and
social circle. IEEE Transactions on Knowledge and
Data Engineering, 26(7):1763–1777.
Ricci, F., Rokach, L., Shapira, B., and Kantor, P. B. (2011).
Recommender systems handbook, volume 1. Springer.
Scott, J. (2012). Social network analysis. Sage.
Shi, C., Zhang, Z., Luo, P., Yu, P. S., Yue, Y., and Wu, B.
(2015). Semantic path based personalized recommen-
dation on weighted heterogeneous information net-
works. In Proceedings of the 24th ACM International
on Conference on Information and Knowledge Man-
agement, CIKM ’15, pages 453–462, New York, NY,
USA. ACM.
Sotelo, R. and Juayek, M. (2015). Incidence of specific se-
mantic characteristics on the performance of recom-
mender systems of audiovisual content. In Broadband
Multimedia Systems and Broadcasting (BMSB), 2015
IEEE International Symposium on, pages 1–4.
Sun, L., Ge, H., and Guo, X. (2014). An algorithm with
user ranking for measuring and discovering important
nodes in social networks. In Biomedical Engineering
and Informatics (BMEI), 2014 7th International Con-
ference on, pages 945–949.
Tiroshi, A., Berkovsky, S., Kaafar, M. A., Vallet, D., Chen,
T., and Kuflik, T. (2014). Improving business rat-
ing predictions using graph based features. In Pro-
ceedings of the 19th International Conference on In-
telligent User Interfaces, IUI ’14, pages 17–26, New
York, NY, USA. ACM.
Zeng, A., Gualdi, S., Medo, M., and Zhang, Y.-C. (2013).
Trend prediction in temporal bipartite networks: the
case of movielens, netflix, and digg. Advances in
Complex Systems, 16(04n05):1350024.
Graph-based Rating Prediction using Eigenvector Centrality
233
