
Using Simulation for Strategic Blood Supply Chain Design in the
Canadian Prairies
John Blake
1,2
and Ken McTaggart
2
1
Department of Industrial Engineering, Dalhousie University, Halifax, Nova Scotia, Canada
2
Centre for Innovation, Canadian Blood Services, Ottawa, Ontario, Canada
Keywords: Blood Supply Chain, Facilities Location, Transportation and Logistics, Simulation Modelling.
Abstract: Since 2010, Canadian Blood Services has been modernizing its facility infrastructure. Current plans call for
the amalgamation of production sites in the Prairie region by 2019. Under this plan existing production centres
in Alberta and Saskatchewan will be consolidated into a single site in Calgary. Because of the potential impact
to the distribution network, a simulation model of the logistics network was constructed in Visual Basic.Net,
using an established simulation framework. Experiments were conducted to estimate the robustness of the
network under varying assumptions for delivery interruptions and inventory reserves. Results suggest that,
given reasonable assumptions on road network reliability, product demand, and inventory staging, either no,
or very modest, changes to product wastage and product reliability should be expected after facility. This
work demonstrates the application of a generic simulation modelling framework to resolve important policy
questions.
1 INTRODUCTION
Canadian Blood Services is one of two organizations
in Canada whose mission is to manage the supply of
blood and blood products. In 2013/14, Canadian
Blood Services distributed more than 800,000 units
of red blood cells and 114,000 units of platelets. The
cost of operations in 2013/14 was $1.02B (Canadian
Blood Services, 2014).
Since 2010, Canadian Blood Services has been
modernizing its facility infrastructure. It has replaced,
or will replace, 14 local production and testing centres
with two national testing laboratories, and three
regional production and distribution centres, while
retaining four local sites in remote locations. Plans
call for the amalgamation of production sites in the
Prairie region of the country (Alberta and
Saskatchewan), which will consolidate local sites in
Edmonton, Calgary, and Edmonton. Once facilities
are consolidated, blood will either be shipped directly
to customers from Calgary or via two distribution
centres and stock holding units (SHU) to be located
in Regina and Edmonton. See Figure 1.
Consolidation of local facilities into regional hubs
allows for economies of scale, increased process
standardization, and improved productivity through
Figure 1: Map of facilities and associated customer
locations. Map data © 2016 Google.
enhanced equipment utilization and greater
production intensity. However, facility consolidation
is not without critics, particularly in provinces that
lose a local centre; debate over the consolidation of
services generally garners considerable attention in
the popular press (CanadaEast.com, 2011) and
amongst political parties of all stripes. Accordingly,
to address stakeholder concerns, a simulation based
study of the proposed Prairie distribution network
was built. The model was constructed in Visual
Basic.Net, using an established simulation
framework (Blake and Hardy, 2014). The model
Blake, J. and McTaggart, K.
Using Simulation for Strategic Blood Supply Chain Design in the Canadian Prairies.
DOI: 10.5220/0006041703450352
In Proceedings of the 6th International Conference on Simulation and Modeling Methodologies, Technologies and Applications (SIMULTECH 2016), pages 345-352
ISBN: 978-989-758-199-1
Copyright
c
2016 by SCITEPRESS – Science and Technology Publications, Lda. All rights reserved
345

reproduces the processes of blood supply chain
management in the Prairies, including collection of
raw materials, production and testing, distribution,
order arrivals, order completion and dispatch. In
addition, it incorporates hospital order, inventory, and
transfusion practices. The framework includes
routines to simulate both planned and unplanned
closures of the distribution network. The model was
validated against a series of benchmarks using both
qualitative assessments and statistical tests. Once
validated, the model was used to conduct a series of
experiments in which red blood cell (RBC) outdates
and availability were measured under differing
assumptions regarding the level of inventory held at
the SHUs and reliability of the distribution network.
2 LITERATURE REVIEW
There is an extensive operational research literature
dealing with blood and blood products. Osorio,
Brailsford, and Smith (2015) note that the blood
supply chain has motivated researchers since the
1960’s. Much of the early literature in the field
focused on inventory management policies for red
blood cells. The work in blood formed the basis for
much of the theoretical development of perishable
inventory theory. See Nahmias (1982) for a seminal
review.
Over the years, the literature has expanded from
pure inventory policy into the broader range of issues.
Beliën and Forcé (2012) classify the literature along
multiple dimensions of blood product, solution
method, system hierarchy, supply chain type, and
modelling structure.
Strategies for designing network topology have
been extensively studied. Pierskalla (2004) presents
a review of models for determining the number, size,
and location of regional blood distribution nodes.
Brodheim and Prastacos (1979) use a statistical
analysis to create a piece-wise linear relationship
between target inventory and daily demand.
Prastacos (1981) compares myopic policies based on
immediate data with optimal policies and shows that
myopic policies cannot be “too different” from
optimal.
Transhipment and rotation policies have been
studied by Gregor, Forthofer, and Kapadia (1982)
who show that lower outdates and greater product
availability are associated with these policies when
compared to traditional no-redistribution policies.
Katsaliaki and Brailsford (2007) describe the use of a
large scale simulation model to evaluate a blood
supply chain. They show that for a single producer
and single consumer system, the amount of inventory
stored can be reduced if improved ordering and cross-
matching policies are implemented. Lang (2010)
uses simulation based optimization to set study
inventory policy for a two-echelon system consisting
of a single supplier and seven hospitals in which
transhipment is allowed along with product
substitution.
While planning for inbound and outbound
logistics is frequently addressed in the literature,
fewer consider the operational impact of disruptions
to the delivery network. Sha and Huang (2012)
describe a location-allocation model to site donor
collection facilities in Beijing following an
earthquake. Jabbarzadeh et al. (2014) present a
robust version of the Sha and Yue model, which
incorporates terms for both cost and undersupply.
However, neither the Sha and Ye model, nor the
Jabbarzadeh et al. models explicitly consider failure
of transportation links, nor do they model period to
period inventory decisions or the aging of a
perishable product. Perhaps most applicable to this
problem are studies by Blake and Hardy (2013) which
describe a simulation methodology to evaluate
inventory decisions in a regional network subject to
periodic failures of the logistics network and a later
paper (Blake and Hardy, 2014) which details the
development of a generic simulation framework for
modelling regional blood networks. Recently Blake,
Hardy, and McTaggart published a simulation study
of a blood supply chain subject to period delivery
failures, but that study was limited to evaluation of a
single stock holding unit (Blake, Hardy, and
McTaggart, 2015)
We conclude that while there is an established
literature on location/allocation problems in blood
supply chains, there are few papers describing
methods for evaluating network logistics under
operational conditions. There are no papers, that we
are aware of, in which a generic simulation
framework has been applied to an instance of a large
regional blood supply distribution network with
several production and distribution hubs and hundred
hospitals linked via a logistics network subject to
periodic failures. We note, finally, that proof of
operational implementation of blood supply chain
study results is generally absent from the existing
literature.
3 PROCESS DESCRIPTION
Hospital customers in Alberta and Saskatchewan, and
are presently serviced from three production and
SIMULTECH 2016 - 6th International Conference on Simulation and Modeling Methodologies, Technologies and Applications
346
distribution sites located in Calgary, Edmonton, and
Regina. After consolidation, blood will continue to
be collected from both fixed and mobile collection
sites in regions centred on Calgary, Edmonton, and
Regina. In the new network, however, whole blood
will be consolidated at a regional site and then
transported for processing in Calgary. Production
and testing activities are expected to require between
one and two days to complete and thus blood is
expected to become available for release as follows:
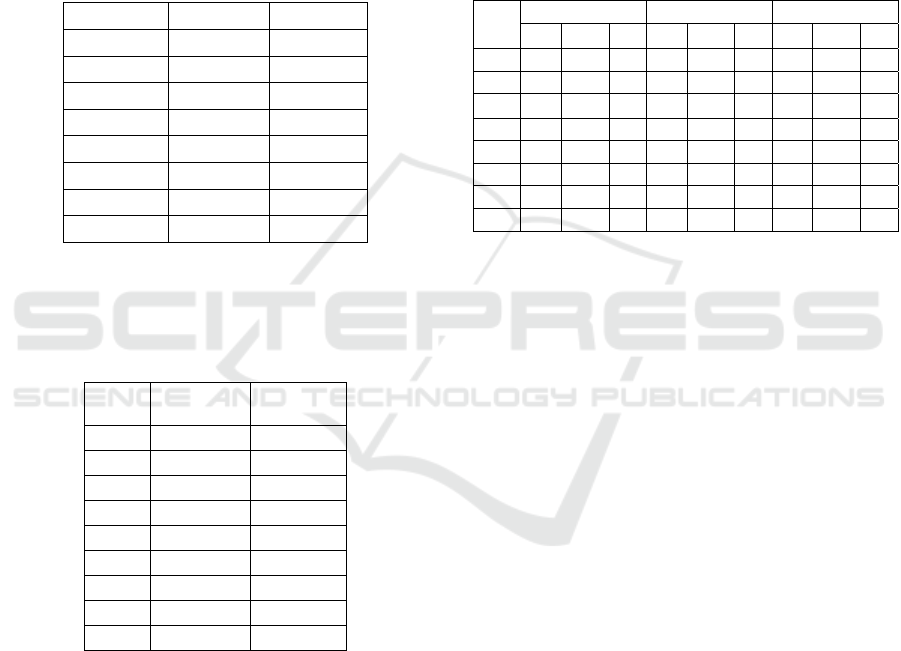
Table 1: Expected daily distribution of units becoming
available for release.
Day Units/Year Units/Day
Sunday 19,642 377.73
Monday 23,466 451.27
Tuesday 19,326 371.66
Wednesday 26,005 500.10
Thursday 36,676 705.31
Friday 34,167 657.06
Saturday 24,586 472.81
Total 183,868 3,535.92
The blood type profile of units collected in the
Prairie region is expected to be as defined in Table 2
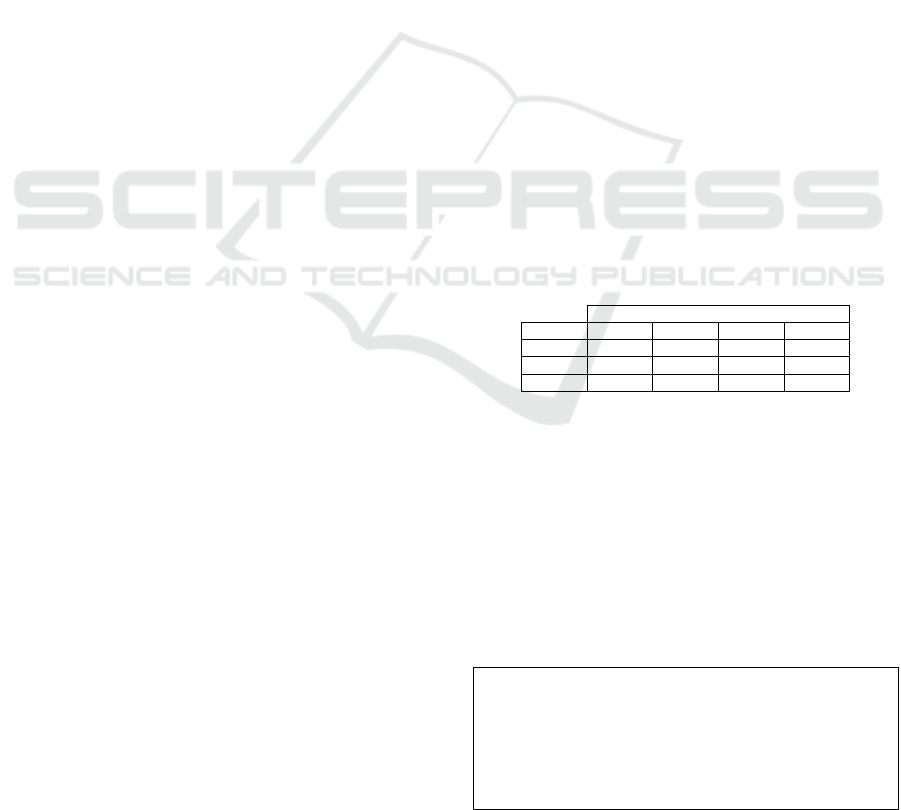
Table 2: Expected distribution of blood units collected in
the Prairie region.
Blood
Type
Units/Year Units/Day
A- 12,569 34.53
A+ 54,493 149.71
AB- 1,250 3.43
AB+ 5,841 16.05
B- 3,878 10.65
B+ 16,763 46.05
O- 21,456 58.95
O+ 67,618 185.76
Total 183,868 505.13
After production and testing are complete, units
are released for distribution. Following consolidation
of production in Calgary, some customers will be
serviced directly from Calgary, while others will
receive blood products from their regional stock
holding unit. SHUs are expected to function in two
modes – on most days the SHU will operate as a local
distribution hub for materials transhipped from
Calgary. However, on days during which shipments
cannot be completed from Calgary, the SHUs will
serve as a forward store for all customers in an area.
Since some large customer sites in Edmonton and
Saskatoon will be supplied from Calgary, rather than
their regional SHU, the anticipated volume of
demand to be met at the regional SHU depends on the
status of the network. For this study, it is assumed
that the regional SHUs will hold sufficient inventory
to meet the greater of 6 days of regular demand from
hospitals in their regular catchment area or 3 days’
emergency demand from all hospitals in their
catchment area.
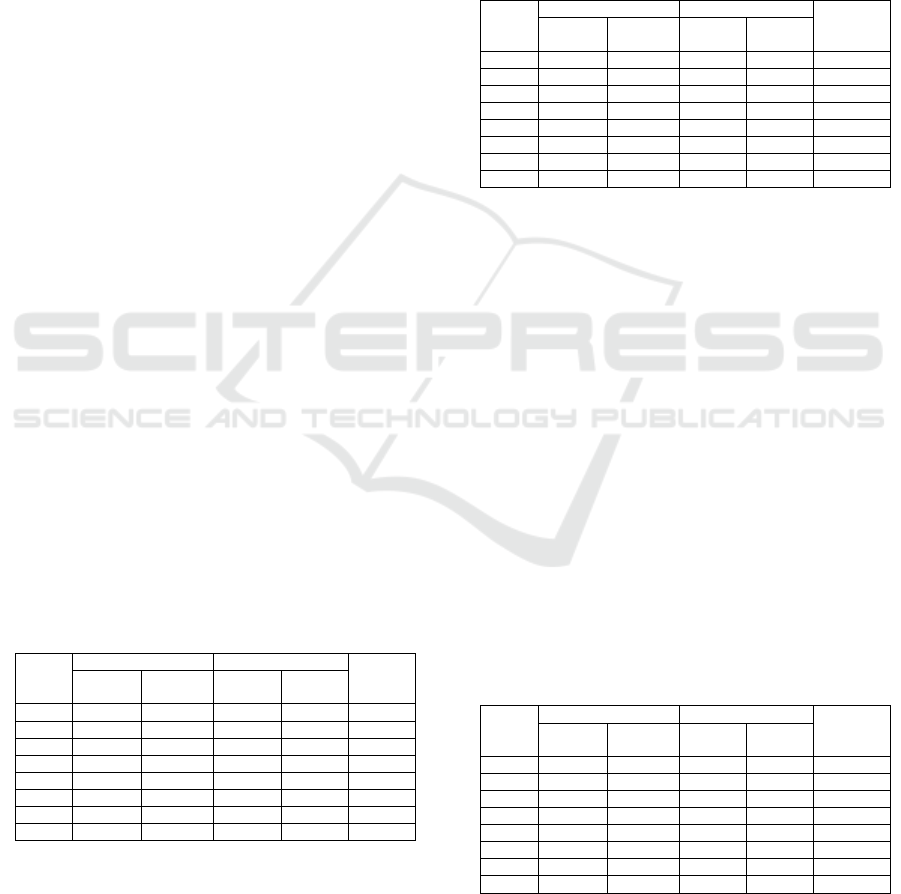
Table 3: Demand and inventory levels at supplier sites.
(Reg = regular daily demand, Emer = daily demand during
a delivery network failure, and Inv = target inventory).
Type Calgary Edmonton Regina
Reg Emer Inv Reg Emer Inv Reg Emer Inv
A-
17.7 7.3 142 4.8 13.2 44 3.4 5.5 17
A+
82.8 36.9 662 22.6 59.5 203 20.2 29.2 88
AB-
1.3 0.5 11 0.3 0.9 3 0.3 0.6 2
AB+
7.4 2.3 60 1.1 5.3 16 2.2 3.2 10
B-
4.5 1.6 36 0.6 3.0 9 1.0 1.5 5
B+
26.4 11.6 211 5.0 16.8 51 4.0 7.0 21
O-
30.4 16.8 243 11.5 22.5 103 6.3 8.8 27
O+
107.5 45.8 860 28.3 78.3 255 21.6 33.3 100
3.1 Simulation Framework
The blood distribution network in the Prairie
provinces is represented by a simulation model
derived from a generic framework developed by
Blake and Hardy (2014) Within the framework a
fixed sequence of events is assumed to occur daily.
The production and distribution site (supplier), the
SHUs (SHU), and hospitals (consumers) are
modelled as separate software classes. Each class has
a series of properties that define the state of the object
and a set of methods that can be called to change or
update the object’s state. The objects are linked
together through a simulation control algorithm. This
algorithm implements a special case of the next-
event, time-advance inventory model outlined in Law
(2006) in which a set of events are executed
sequentially and a single, daily update is made to the
simulation clock.
This implementation of the generic framework
assumes that one or more distribution centres and
several SHUs exist within a network of consumer
objects. The supplier object contains methods that
simulate the process of collecting, producing,
inventorying, aging and distributing blood to SHUs
and customers. SHU objects are implemented as a
sub-class of supply objects; they inherit supplier
methods that allow for inventory ordering, product
receipt, product aging, and distribution of products to
consumers. Unlike the supplier object, SHU objects
Using Simulation for Strategic Blood Supply Chain Design in the Canadian Prairies
347

do not collect their own products. Rather they are
“connected” to a supplier object at which they place
orders. Operationally, SHUs are assumed to function
like distribution centres: They hold stock and fill
requests for products from hospitals in their
catchment area. According to operational plans in the
Prairie region, some hospital consumers will be
supplied directly from the Calgary DC during regular
day-to-day operations. However, in the event of an
interruption to the logistics network, all consumer
sites within a region will order and receive product
from their local SHU.
Hospitals, in the framework, are modelled as a
consumer object that encapsulates methods for
ordering, receiving, inventorying, and aging blood, in
addition to methods for simulating patient demand.
3.2 Process Description
At the beginning of each run, the system is initialized.
All objects are instantiated and their properties are set
according to data read in from a transaction database.
Initialization is completed by assigning a starting
inventory, by blood group and type, to each supplier
object, based on the anticipated demand for products
from consumers and any associated SHUs.
Once initialized, the model is run for some
replications of a specified number of days. On each
simulated day, the model steps through a fixed
sequence of events. The day begins with a call to
advance suppliers’ inventory. This ages the stock on
hand at each supplier by one day and causes any stock
with -1 days of shelf-life remaining to be outdated; a
similar call is then made to advance inventory at all
SHU objects.
After advancing the inventory age, both the
supplier object and SHU objects make a call to have
inventory arrive. The supplier object samples from a
day-of-week specific distribution to determine the
number of units to arrive from testing. Each unit is
assigned a blood group and type and a shelf-life
drawn from empirical distributions. Reductions in
the rated shelf-life of arriving units are primarily
intended to represent delays in the testing process, but
are also used to represent mandated reductions in
shelf-life when units are irradiated.
SHUs are assumed to evaluate their inventory
each morning against a two-level (s,S) inventory
policy and place an order for product, rather than
observing a randomly distributed product collection.
Thus, each morning, every SHU object evaluates its
inventory. If the inventory level for a particular blood
type is less than s, an order is placed with the supplier
to have exactly enough stock (S-s, where S≥s) arrive
to return the inventory level to S. The supplier is
assumed to fill requests for product using a FIFO
inventory policy in most instances. Inventory is
assumed to be delivered instantaneously from the
supplier to the SHU.
Once all incoming inventory is in place at
suppliers and SHUs, the simulation loops through
each of the consumer objects and makes a call to
advance the inventory. This causes the stock on hand
to age by one day. Any units with -1 days of shelf-
life remaining are counted as outdated and exit the
system. Each consumer object then determines if an
order is required, in a manner similar to that of the
SHU. Consumers are assumed to order from either
from their regional SHU or directly from the Calgary
DC. In instances where a consumer object is
associated with a SHU, but regularly receives
products from the DC, orders are usually placed with
the DC. However, when an emergency order is
issued, or if the logistics network has been disrupted,
all consumers are assumed to place an order with their
local SHU.
Once orders are received and entered into
inventory, customer sites experience demand for
blood products from patients. Each day the model
issues a call to each consumer object. The call
generates requests for blood, using a zero-inflated
Poisson distribution with a day-of-week specific
mean value. Once the number of units required is
known, blood group and type are assigned to the
demand items via empirical distributions. Demand is
filled at the consumer FIFO from available units. If
no unit is available, the consumer site issues a
demand for additional units, on an emergency basis,
from its supplier (either the SHU or the DC). If
available, emergency units are transferred to the
consumer object, using the same logic as regular
demand. If no unit is available, the demand is
considered to be lost and counted as a shortage. The
day ends, the simulation clock is then advanced by
one day and the cycle repeats.
4 DATA
Data for the simulation was derived from Canadian
Blood Services’ operational database which provided
transaction level data for all units of packed red cells
collected in, distributed in, or disposed from any CBS
facility in Alberta and Saskatchewan during fiscal
2013/2014. A total of 277,000 records were
retrieved.
The transaction level data was processed using a
set of custom routines to format the data and to
SIMULTECH 2016 - 6th International Conference on Simulation and Modeling Methodologies, Technologies and Applications
348
prepare a set of pre-defined input data lists and
distributions for the regional simulation framework
(Blake and Hardy, 2014). Automatically derived
from the data are simulation inputs such as lists of
CBS facilities and hospitals as well as distributions
describing hospital demand, whole blood collection,
and product testing parameters, amongst other
elements.
5 VA L I D AT I O N
Extensive verification activities were undertaken to
ensure the model functions as intended. Once inputs
were verified, the model was validated by comparing
simulated output against historical data.
5.1 Verification
At a macro level, the distribution network is similar
to a queuing network with random arrivals
(collections) and random services (demand).
Drawing upon that analogue, the key elements
dictating system performance are inputs (collections)
and outputs (filled demand or outdates)
5.1.1 Verifying Inflows
Inflows of materials within the simulation model are
comprised primarily of collections.
Table 4 provides
a summary of model results for collections against the
historical value. This table provides a 95% prediction
interval, based on 10 replications of the simulation
model for a 10-year period, following a 364-day
warm up. The results suggest that there is no
evidence that historical data is inconsistent with the
simulation framework.
Table 4: Comparison of daily collections by blood group
within the Prairie region.
Blood
Group
Daily Collections Prediction Interval
Historic
Value
Average Variance
Lower
Limit
Upper
Limit
A- 34.557 0.010 30.547 38.566 34.530
A+ 149.66 0.035 141.316 158.004 149.706
AB- 3.525 0.000 2.244 4.805 3.434
AB+ 16.042 0.003 13.31 18.774 16.047
B- 10.681 0.001 8.452 12.91 10.654
B+ 46.076 0.022 41.446 50.705 46.052
O- 58.915 0.014 53.679 64.15 58.945
O+ 185.774 0.120 176.478 195.07 185.764
5.1.2 Verifying Outflows
Outflows of materials in the simulation model consist
of items provided to patients.
Table 5 provides a
summary of model results for demand, as observed in
the simulation model, against the historical value for
fiscal 2013/2014. This table provides a 95%
prediction interval, again based on 10 replications of
the simulation model for a ten-year period, following
a 364-day warm up period. The results show that
there is no evidence to suggest that historical demand
data is not consistent with the results of the simulation
model.
Table 5: Comparison of daily demand by blood group
within the Prairie region.
Blood
Group
Daily Demand Prediction Interval
Historic
Value
Average Variance
Lower
Limit
Upper
Limit
A- 26.025 4.6E-03 22.546 29.505 26.066
A+ 125.884 6.5E-02 118.231 133.536 125.824
AB- 2.0992 8.6E-04 1.111 3.088 1.901
AB+ 10.994 2.4E-03 8.732 13.255 10.739
B- 6.042 1.5E-03 4.365 7.719 6.104
B+ 35.254 6.6E-03 31.204 39.304 35.404
O- 48.020 1.0E-02 43.294 52.747 48.228
O+ 157.869 5.7E-02 149.299 166.439 157.885
5.2 Validation
To confirm that the model represents reality, output
values for outdates were compared against historical
values. Since outdates are not an input to the
simulation, but rather a result of the differences
between simulated inflows and outflows, a basic test
of validity is to ensure that the number of outdating
units matches the historical record. The simulation
model was run for ten replications of 10-year’s
duration, using a 364-day warm-up period under the
method of batch means. The average number of
outdates for RBC was recorded and a 95% prediction
interval was constructed. A comparison, shown in
Table 6, indicates there is no reason to suggest that
outdates recorded by the simulation model are not
consistent with those observed in the 2013/14
historical data.
Table 6: Comparison of model outdates within the Prairie
region as recorded in the simulation against historical data.
Blood
Group
Daily Outdates Prediction Interval
Historic
Value
Average Variance
Lower
Limit
Upper
Limit
A- 0.293 0.004 0.000 0.098 0.063
A+ 1.898 0.100 2.865 5.685 4.578
AB- 0.015 0.000 0.000 0.259 0.058
AB+ 4.275 0.008 3.148 6.078 4.841
B- 0.074 0.001 0.242 1.524 0.258
B+ 4.613 0.049 1.074 3.027 1.211
O- 0.883 0.002 0.000 0.098 0.063
O+ 2.050 0.002 2.865 5.685 4.578
Using Simulation for Strategic Blood Supply Chain Design in the Canadian Prairies
349
6 EXPERIMENTS AND RESULTS
The simulation framework assumes the distribution
system will function as a network of stock holding
units, each linked to the Calgary DC. The SHUs in
Edmonton and Regina will provide regular shipments
to some facilities and emergency shipments to all
customers in their catchment area. Accordingly, the
function of the SHUs is to provide regular deliveries
and to serve as a buffer against network interruptions.
A basic test of technical feasibility therefore involves
evaluation of network operations as delivery
interruptions are introduced into the system.
6.1 Delivery Interruptions
Road network reliability data was obtained from the
Alberta Department of Transportation. The data covers
the period between 03 Mar 13 and 04 Jan 16 and
describes closures to the Trans-Canada Highway. In
total, the data shows 23 road closures over 34 months.
Road closures were observed to occur approximately
once every 54 days. However, of the 23 closures
recorded in the dataset, 20 involved a closure of less than
7 hours’ duration, while the remaining three resulted in
an average closure duration of 9.46 hours. Thus, in the
simulation framework it is assumed that the time
between road failures is exponentially distributed with a
mean of 54 days and that 87% (20/23) of all road failures
result in a delay that is too short to disrupt deliveries.
6.2 Experimental Framework
All scenarios for the simulation model of the Prairie
region assume the existence of the Calgary distribution
centre and stock holding units located in Edmonton and
Regina. Deliveries to SHUs are assumed to take place
six days per week (Tuesdays through Sundays).
Inventory policies at all ordering nodes in the
model (SHUs, and customer sites) are assumed to
follow an (s, S) type inventory policy. In all runs of
the model it is assumed that facilities review their
inventory daily, placing an order for stock on any day
of the week that deliveries are feasible. Inventory
targets for the three SHUs are as defined in
Table 3
and, for hospital customers, it is assumed that S is
equal to 6 days’ of average patient demand.
It is assumed that every hospital is connected to a
local SHU. Some larger facilities in Edmonton and
Regina may bypass their regular SHU and instead
order directly from Calgary for their day-to-day
needs. Nevertheless, in the event of a disruption to the
delivery network, all hospitals are assumed to draw
from their local SHU.
Finally, it is assumed that the mean time between
network road failures is 54 days, exponentially
distributed, but that only 13% of the failures result in
a significant delay to deliveries.
Two parameters were varied in the experimental
framework:
1) The mean time to repair the delivery link
between Calgary and the SHUs. Repair time was
tested at 9.46, 15.46, and 21.46 hours to repair,
with all times to repair assumed to be
exponentially distributed.
2) The amount of inventory held at the SHUs. In
the base case, it is assumed that the amount of
inventory held at the SHUs is as defined in
Table
3
. In experiments, the amount of inventory held
is adjusted by -1, 0, +1, or +2 days’ demand to
determine the impact of safety stock at the SHUs
to buffer out disruptions to the logistics network.
7 RESULTS
Table 7 shows the results of the experiments in terms
of units outdated per day. Results are shown as the
mean time to recover from a network failure ranges
from 9.46 hours to 21.46 hours and as SHU
inventories are varied from -1 days’ demand on hand
to +2 days’ demand on hand from the base case.
Table 7: Average daily number of RBC units outdated vs.
mean time to road failure and changes to SHU inventory.
Change in SHU Inventory
MTTR -1 0 1 2
0.394 14.392 14.720 15.637 25.158
0.644 14.643 14.389 15.598 25.155
0.894 14.756 14.535 15.905 25.105
The results in Table 7 indicate outdates are not
affected by the mean time to recover the network after
a road failure. However, the results suggest that
increases to the inventory held at the SHU increases
the amount of outdating in the system. This
conclusion is supported by an analysis of variance
(ANOVA) as shown in
Table 8.
Table 8: ANOVA for units wasted per day against time to
recover from a network failure (MTTR) and changes in the
SHU inventory.
Analysis of Variance for Daily Wastage
Source DF SS MS F P
MTTR 2 0.04 0.02 0.75 0.51
Change in
SHU
Inventory
3 236.08 78.7 3246.35 0.00
Error 6 0.15 0.02
Total 11 236.26
SIMULTECH 2016 - 6th International Conference on Simulation and Modeling Methodologies, Technologies and Applications
350
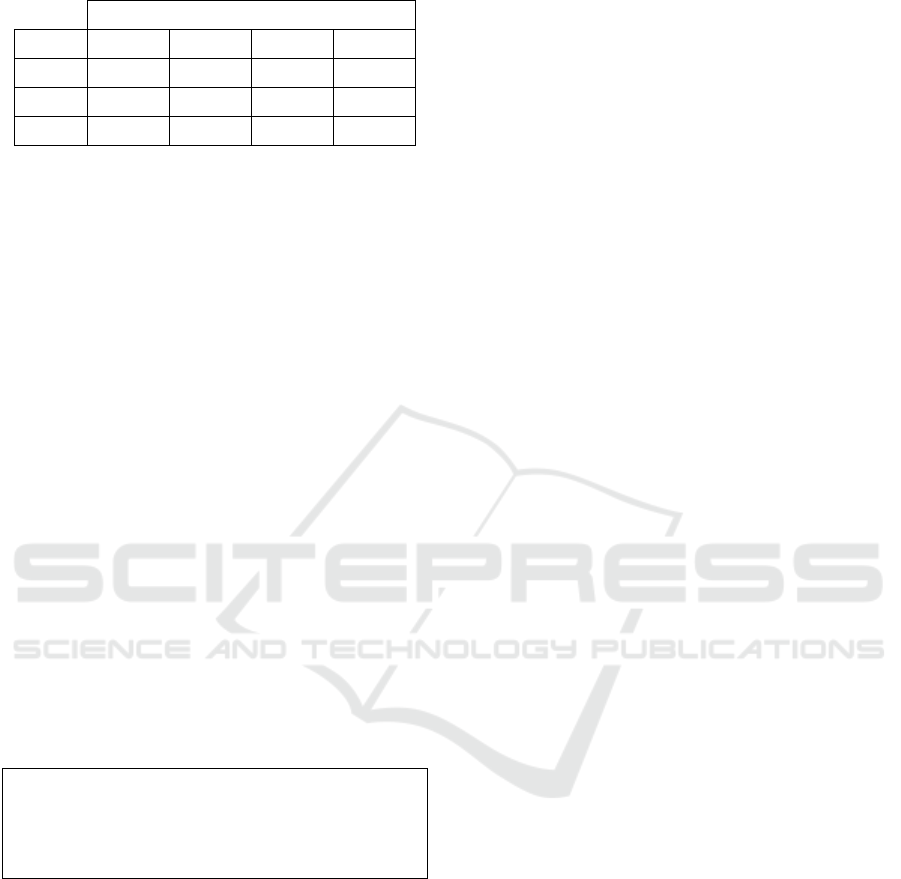
Table 9: Average daily number of units short vs. mean time
to road failure and change to SHU inventory.
Change in SHU Inventory
MTTR -1 0 1 2
0.394 5.96E-03 4.67E-03 2.18E-02 1.98E-02
0.644 4.95E-03 5.66E-03 2.02E-02 2.16E-02
0.894 7.45E-03 6.04E-03 2.22E-02 2.14E-02
Table 9 shows that product shortages increase as
the mean time to recover from a network failure
increases. In all cases, however, shortages were
observed to be rare events, with instances occurring
less than once per 45 days to once per every 168 days,
depending on the scenario. Reductions in the SHU
inventory below baseline values, did not significantly
change shortage rates. However, when SHU
inventory was increased, a significant increase in
shortage was observed. In the simulation, product
substitutions are explicitly disallowed. Thus, if
demand appears for a particular blood type and none
is available at the customer hospital, its associated
SHU, or at the supplier site in Calgary, the demand is
lost. The majority of shortages recorded in the
simulation are due to requests for rarer AB- and B-
blood. Shortages of these blood types occur when
additional inventory is held at the SHUs since this
policy sequesters more of these rare types to the
SHUs and away from the DC in Calgary.
Table 10
shows an ANOVA which indicates that road recovery
time does not significantly influence shortages, but
that changes in the SHU inventory level does.
Table 10: Average daily number of RBC units short vs.
mean time to road failure and change to SHU inventory.
Analysis of Variance for Daily Shortage x 100
Source DF SS MS F P
MTTR 2 0.0388 0.0194 2.56 0.157
Change in SHU Inventory 3 7.1018 2.3673 313.16 0.000
Error 6 0.0454 0.0076
Total 11 7.1859
8 CONCLUSIONS
Based on the results of the experiments, it may be
concluded that consolidation of production and
distribution facilities in the Prairie region will result
in either no, or very modest, change to product
wastage and shortage, given the assumptions on road
network reliability, product demand, and inventory
staging made in this study.
If one assumes the same types of operational
structures as in the simulation experiments, it would
be expected that 14.92 +/- 1.08 units per day of RBC
would be wasted, while product shortages would be
in the range of 0.01 +/- 0.008 units per day prior to
consolidation; after consolidation, and assuming the
most likely scenario for road closures, it is expected
that 14.72 +/- 0.43 units per day of RBC will be
wasted, while there will be 0.004 +/- 0.002 instances
of shortage per day. Since these results are not
statistically different from the base case, it may be
concluded that, under the most likely scenario for
network reliability, there should be no discernible
changes in product availability or system wastage
after consolidation.
Experimental results to test the effect of decreased
network reliability and changes in inventory staging
suggest that the network performance is reasonably
robust. Wastage rates were observed to increase from
14.4 units per day to 25.2 units per day as inventory
at the SHUs in Edmonton and Regina were varied
from their baseline amounts by -1 to +2 days of
demand, but were unaffected by changes in the road
network reliability. In all runs tested, shortages
ranged from 4.7x10
-3
units per day to 2.2x10
-2
units
per day, or roughly 1.7 to 7.8 units per year.
Shortages were observed to increase modestly as the
road network reliability decreased. However,
shortages were also observed to increase as more
inventory is held at the SHUs and less is held at
Calgary.
Overall, the results of the simulation experiments
suggest that, within the range of likely network
failures, the impact on customer service resulting
from facility consolidation in the Prairie region is
likely to be negligible.
9 DISCUSSION
The value of modelling changes in the blood
distribution network in the Prairie provinces extends
beyond a proof of technical feasibility. In Canada,
the provision of health care is a provincial
responsibility; provinces are responsible for the
regulation, function, and funding of health care.
Blood, because it is a biologic product, is federally
regulated. Thus, while provinces pay for the
provision of blood services, they are disallowed from
directing the operations of blood agencies. Issues can
arise when changes are suggested to blood
distribution networks, particularly when such change
involves the loss of facilities within a province.
Concerns over the loss of facilities sometimes leads
stakeholders to question whether the revised network
Using Simulation for Strategic Blood Supply Chain Design in the Canadian Prairies
351

will provide a similar level of service to that of the
existing network (Blake and Hardy, 2013).
To address stakeholder concerns and, as due
diligence for patient safety, Canadian Blood Services
has found it useful to develop detailed simulation
models of its regional networks. The models have
been instrumental in establishing proof of concept
and forecasting operational robustness. In this paper
we have reported on the development of a specific
instance of a simulation model created from a generic
framework to represent changes in the distribution
network in the Prairie provinces of Canada. This
model, and its derivatives, have been used to address
a specific series of policy questions and has served as
a vehicle for fostering discussions between the blood
agency and stakeholder groups in the Canadian
Prairie Provinces.
REFERENCES
Belien, J. and Force, H. (2012). Supply chain
managementof blood products: A literature review.
European Journal of Operational Research, 217(1), 1-
16.
Blake, J. (2012). A case study on the use of operations
research to evaluate changes in a blood supply chain.
Proceeding of the 4th Interanational Conference on
Information Systems, Logistics, and Supply Chain.
Quebec : ILS.
Blake, J., and Hardy, M. (2013). Using simulation to
evaluate a blood supply network in the Canadian
maritime provinces. Journal of Enterprise
Managements, 26((1/2)), 119-134.
Blake, J., and Hardy, M. (2014). A generic modelling
framework to evaluate network blood management
policies: The Canadian Blood Services experience.
Operations Research for Healthcare, 3(3), 116-128.
Blake, J., and Hardy, M. (2014). Evaluating the impact of a
shorter shelf life for red blood cells with a generic
simulation. In Y. Guan, and H. Liao (Ed.), Proceedings
of the 2014 Industrial and Systems Engineering
Research Conference. Montreal, QC: IIE.
Blake, J., and Hardy, M. (2015). Modelling exchanges in a
national blood system. Proceedings of the First
Karlsruhe Service Summit Workshop - Advances in
Service Research (pp. 73-80). Karlsruhe: Karlsruhe
Service Research Institute. doi:10.5445/KSP/100
0045634.
Blake, J., Hardy, M., and McTaggart, K. (2015). Modelling
a blood distribution network in the Prairies with a
generic simulation framework. INFOR, 53(4), 194-201.
Brodheim, E., and Prastacos, G. (1979). The Long Island
blood distribution system as a prototype for regional
blood management. Interfaces, 9(5), 3-20.
CanadaEast.com. (2011, June 27). NB to ensure top quality
of blood supply. Retrieved from CanadaEast.com:
http://timestranscript.canadaeast.com/newstoday/articl
e/1411744.
Canadian Blood Services. (2014). Delivering Value:
Annual Report 2013-2014. Ottawa, ON: Canadian
Blood Services.
Gregor, P., Forthofer, R., and Kapadia, A. (1982). An
evaluation of inventory and transportation policies of a
regional blood distribution system. European Journal
of Operational Research, 10(1), 106-113.
Jabbarzadeh, A., Fahimnia, B., and Seuring, S. (2014).
Dynamic supply chain network design for the supply of
blood in disasters: A robust model with real world
application. Transportation Research Part E: Logistics
and Transportation Review, 70, 225-244.
Katsaliaki, K., and Brailsford, S. (2007). Using simulation
to improve the blood supply chain. Journal of the
Operational Research Society, 58(2), 219-227.
Katsaliaki, K., Mustafee, N., T. S., and Brailsford, S.
(2009). Facilitating the analysis of a UK National Blood
Service supply chain using distributed simulation.
SIMULATION, 85(2), 113-128.
Lang, J. (2010). Blood bank inventory control with
transshipments and substitutions. In M. Beckmann, H.
Kunzi, G. Fandel, and W. Trockel, Production and
Inventory Management with Substitutions (pp. 205-
226). Berlin: Springer.
Law, A. (2006). Simulation Modeling and Analysis, 4th
Edition. New York: McGraw-Hill.
Nahmias, S. (1982). Perishable inventory theory: a review.
Operations Research, 30(4), 680-780.
Osorio, A., Brailsford, S., and Smith, H. (2015). A
structured review of quantitative models in the blood
supply chain: a taxonomic framework for decision
making. International Journal of Production Research.
doi:10.1080/00207543.2015.1005766.
Pierskalla, W. (2004). Blood banking supply chain
management. In M. Brandeau, F. Sainfort, and W.
Pierskalla, Operations Research and Health Care (pp.
103-146). Boston: Klewer.
Prastacos, G. (1981). Allocation of a perishable product
inventory. Operations Research, 29(1), 95-107.
Sha, Y., and Huang, J. (2012). The multi-period location-
allocation problem of engineering emergency blood
supply systems. Systems Engineering Procedia 5, 21-
28.
SIMULTECH 2016 - 6th International Conference on Simulation and Modeling Methodologies, Technologies and Applications
352
