
New EEG Measure of the Alertness Analyzed by Emotiv EPOC
in a Real Working Environment
Dariusz Sawicki
1
, Agnieszka Wolska
2
, Przemysław Rosłon
1
and Szymon Ordysiński
2
1
Warsaw University of Technology, Institute of Theory of Electrical Engineering,
Measurements and Information Systems, Warsaw, Poland
2
Central Institute for Labour Protection - National Research Institute (CIOP-PIB), Warsaw, Poland
Keywords: EEG, Alertness Level, Emotiv EPOC.
Abstract: Alertness level evaluation has obvious implications for safety–critical occupations such as operators in
control rooms or drivers. It has already been stated that alertness can be assessed objectively by EEG.
However, the high costs of standard medical equipment for EEG measurement, their complex and time-
consuming operation, and the need to use conductive gel on the scalp make this method impossible for
general use or at workstations. The aim of the study was to analyze the possibility of alertness level
assessment based on EEG measurements using the Emotiv EPOC headset, which is relatively cheap,
wireless, comfortable for wearing and does not need the use the of conductive gel, but allows the capture of
only 14 channels of EEG. The experiments were carried out in laboratory conditions using three different
light spectra for 40 minutes exposure on office workstation during the afternoon drop in alertness. 50
participants took part in each light scene (white, red, blue). The EEG measurements were performed before
exposure and just after exposure to a particular light scene. A new measure of alertness, based on analysis of
EEG signals, has been introduced. The results showed that this new measure based on low-cost Emotiv
EPOC EEG measurements is reliable and confirms the results of previous studies.
1 INTRODUCTION
1.1 Motivation
Studies on alertness levels have been conducted for
many years. This study is important for ensuring
safety at work, and also due to the possibility of
increasing efficiency. The methodology for these
tests is usually based on an analysis of the contents
of melatonin in the blood, urine or saliva. Such a
study is the simplest test of alertness in laboratory
conditions, but difficult or impossible in real
conditions – in the workplace, for example for
drivers. Therefore, the need for another method
which enables the effective recognition of the level
of alertness. For several years, research on the
melatonin level in blood has been combined with the
analysis of EEG (Rahman et al., 2014, Sahin and
Figueiro, 2013, Sahin et al., 2014, Górnicka, 2008).
At the same time, systems based only on the analysis
of EEG signals have been developed. Research
conducted among drivers are a good example of this
(Ji et al., 2011, Li et al., 2010).
Participant comfort during the performance of
tests is a basic prerequisite for the practical
application of EEG in the diagnosis of alertness
level. This is especially so if the tests are carried out
on a large group of participants. The traditional
medical equipment for EEG recording, in which it is
necessary to use a conductive gel, does not meet this
condition. Tests organized in this way disqualify the
use of EEG signals in the identification of alertness
in the workplace. Therefore, increasingly often we
notice attempts to use a simpler device, equipped
with saline electrodes (not gelled) – a low-cost
(consumer edition) device. The above conditions are
clearly met by the Emotiv EPOC (Emotiv Systems
Inc.) device, which in recent years has also been
used to analyze EEG signals (Stytsenko et al., 2011,
Pham and Tran, 2012, Zhan, 2013, Badcock et al.,
2013, Fakhruzzaman et al., 2015). Comparisons
between signal analysis based on Emotiv EPOC and
medical EEG devices have been performed
(Duvinage et al., 2012). As a result of these
comparisons, it has been concluded that Emotiv
should only be chosen for non-medical, non-critical
applications. On the other hand, Ramirez and
Vamvakousis (2012) tried to detect emotion from
Sawicki, D., Wolska, A., Rosłon, P. and Ordysi
´
nski, S.
New EEG Measure of the Alertness Analyzed by Emotiv EPOC in a Real Working Environment.
DOI: 10.5220/0006041200350042
In Proceedings of the 4th International Congress on Neurotechnology, Electronics and Informatics (NEUROTECHNIX 2016), pages 35-42
ISBN: 978-989-758-204-2
Copyright
c
2016 by SCITEPRESS – Science and Technology Publications, Lda. All rights reserved
35

the EEG signals obtained using an Emotiv device.
Their conclusion was that indeed Emotiv allows the
registration of signals only from selected points
(from 10–20 system), but such registered signals are
sufficient for data analysis. Similar conclusions can
be found in one independent report (Ekanayake,
2010, updated in 2015). Badcock et al. (2013)
showed high similarity of signals registered by
traditional a medical EEG system and an Emotiv
EPOC.
Therefore, it is worth conducting a study where
the aim is to enable the recording of EEG in the
most friendly way for employees, while at the same
time in a way that enables the identification of the
level of alertness. Emotiv EPOC is a good example
of a low-cost consumer electronic device with
proven correct registration of signals, although we
must be aware that it has limited capabilities and
requires careful interpretation of the results.
1.2 EEG Signals as a Measure of the
Alertness Level
Studies show that for most people during normal
readiness state (and with eyes open) Theta waves
(4.5-8 Hz) and Alpha waves (8–12 Hz) practically
do not exist (Sahin and Figueiro, 2013, Baek and
Min, 2015, Klimesch, 2012, Okamoto, 2014). If they
occur, their amplitudes are minimal. It is assumed,
therefore, that if during the registration process (in a
state of readiness, work etc. with open eyes) there
are Theta and Alpha waves with greater amplitude,
this represents an increase in drowsiness and fatigue,
and thus a decrease in alertness (Lal 2001).
With eyes open, and with an decrease in
alertness, the amplitude of the waves of lower
frequency (and thus Theta and Alpha) increases.
While with closed eyes, and in a state of drowsiness,
Alpha wave activity begins to decline, and the
amplitude of waves Theta increases. Therefore, in
studies usually two types of waves are analyzed –
Alpha and Theta. Sometimes additional bandwidth
Low Beta (Beta 1) (12–18Hz) is taken into account.
This band is associated with commitment and mental
activity. It is combined with cognitive alertness and
states immediately before performing tasks requiring
alertness (Gola et al., 2013). However, a direct
correlation with the level of alertness has not yet
been showed.
The simplest and simultaneously most effective
way to stimulate alertness is to use light of a
particular color. The discovery of new receptors of
light (ipRGC - Intrinsically Photosensitive Retinal
Ganglion Cell) begun many studies on lighting,
which is biologically effective (Brainard, 2001,
Sahin and Figueiro, 2013, Sahin et al., 2014,
Thapan, 2001, Viola 2008). Studies have shown that
light with a wavelength range between 425 and
560 nm is effective in inhibiting melatonin secretion.
The maximum effectiveness of this process occurs
for blue light in the wavelength range from 460 to
480 nm, depending on the obtained results of the
tests and their interpretation (Brainard et al., 2001,
Thapan et al., 2001, Aube et al., 2013). Despite
minor differences in interpretation, the authors of
these studies are in full agreement about the effect of
blue light with short wavelengths on the
physiological process of secretion of the hormone
melatonin – the process responsible for the states of
modulation between sleep and wakefulness during
the day. The use of light blue (or white with a high
proportion of blue light) raises the level of alertness
and thus helps to achieve a higher level of
psychophysical efficiency at work (Rahman et al.,
2014, Sahin and Figueiro, 2013, Sahin et al., 2014,
Viola 2008).
1.3 The Aim of the Study
The aim of the study was to analyze the possibility
of identifying the level of alertness in the
registration of the EEG signal in real working
conditions. The tests were planned for a large group
of 50 participants. Due to the need for adequate
comfort of such a large group of participants, we
used EEG equipment which does not require the use
of a conductive gel and has wireless connection to a
computer (i.e. there was no wiring that could make
movements difficult).
The equipment (Emotiv EPOC) is also a non-
medical, consumer, low-cost device. In this context,
these studies might also answer the question about
the possibility of using such low-cost equipment in
this research. As a key factor that affects the
increase in alertness, lighting with a significant blue
component was applied. The white-color lighting
used in workrooms was used as a reference
condition ("placebo"), which should not elicit
alertness. In addition, we used red-color lighting as a
factor that influences the level of alertness but on a
different principle than that of blue.
2 METHODOLOGY
2.1 Participants
In the study, a group of 50 participants took part,
NEUROTECHNIX 2016 - 4th International Congress on Neurotechnology, Electronics and Informatics
36

mean age 47.84 ±16.51 years, range 22–67. In a
natural way, there was a division into two
subgroups: older (mean age 66.66 ± 3.54 years,
range 56–67) and younger (mean age 27.83 ± 3.59
years, range 22–32). Participants included 22
healthy male and 28 female volunteers. All
participants met the following criteria: no report of
any physical or mental health problems, no color
blindness, office workers or students with
experience of computer work, and no use of any
medication. The experimental protocol was
reviewed and approved by the Ethical and Bioethical
Committee of Cardinal Stefan Wyszynski University
in Warsaw. Informed written consent was obtained
from each study participant. Participants were paid
for their participation.
Every participant completed a Horne-Ostberg
Morningness-Eveningness Questionnaire (MEQ)
(Horne and Ostberg, 1976) before the study. The
mean of reported chronotype was 2.6 ± 1.06. In the
older subgroup, this was 2.2 ± 0.92, and in the
younger subgroup 3.2 ± 0.95. Participants kept a
sleep/wake diary during all weeks of the experiment,
starting one week before starting the study. These
diaries documented bedtimes, rising times and level
of sleepiness / alertness on an hourly basis.
2.2 Lighting Conditions
The assumption of the study was to show that
lighting in office working conditions of specific light
spectra can be used to increase alertness in the
afternoon, close to the post lunch hours. Some
literature (Figueiro and Rea, 2010, Hanifin et al.
2006, Sahin and Figueiro, 2013, Sahin et al., 2014)
has stated that exposure to blue and red light during
the afternoon elicits alerting effects in humans.
These studies used direct exposure to blue or red
light with fixed head position. The aim of our study
was to model lighting conditions which would be
applied at office workstations to elicit alertness.
Lighting of a special spectrum switched on for an
exposure time of about 40 minutes should allow the
performance of visual tasks with visual comfort,
adequate color recognition of the environment and
appropriate illuminance. So, the red or blue lights
were added to white light as a significant
component, which would influence the alertness
(Wolska and Sawicki, 2015). The three experimental
lighting conditions participants were exposed to
were:
Reference conditions – general lighting –
fluorescent white light (Tc = 4000 K,
Ra = 80), termed “white” lighting scene;
Blue enriched white lighting conditions –
general lighting + localized lighting: white
LEDs (4000 K) and blue LEDs
(λ
max
= 470 nm), termed “blue” lighting scene;
Red enriched white lighting conditions –
general lighting + localized lighting: white
LEDs (4000 K) and red LEDs
(λ
max
= 630 nm), termed “red” lighting scene.
The localized lighting was placed over the
participant's head to avoid direct sight of light
sources and glare during the experimental session.
Discomfort glare from general lighting was limited
to UGR < 16, which fulfilled the requirements of
lighting standard EN 12464-1 (EN 12464-1, 2011).
During the exposure, participants were sitting at the
computer workstation and performed visual tasks
while looking at the screen. Eye height was fixed to
about 1.20 cm above the floor. The illuminance at
the cornea was: 286 lx under “white” conditions,
714 lx under “blue” conditions and 842 lx under
“red” conditions.
2.3 Emotiv EPOC
Emotiv EPOC allows the recording of EEG signals
in accordance with the 10–20 system, but with a
limited number of electrodes. In the Emotiv system,
only 14 active electrodes are available, together with
two reference electrodes (P3 and P4). The electrodes
are arranged around the head of the participant,
within the structures of the following areas: frontal
and front-parietal: AF3, AF4, F3, F4, F7, F8, FC5,
FC6; temporal: T7, T8; and the occipital and
occipital-parietal: O1, O2, P7, P8. The device has an
internal sampling rate of 2048 Hz and after cleaning
artifacts, it is resampled to 128 Hz. Finally, EEG
signals are transferred wireless to a computer, where
they are stored in a file using edf format. Proper
impedance of electrodes is formed by the use of
physiological saline. The scheme of electrode
arrangement in the Emotiv headset is presented in
Figure 1.
The Emotiv system has a known disadvantage -
the lack of electrodes in the center of the skull (Pz,
Cz, Fz), and therefore, this system has limited
applicability in research. In our experiments,
missing signals were replaced by signals from
electrodes O1, O2, T7, T8, FC5, FC6. The
manufacturer of Emotive states that the signal
picked up by these electrodes would be good enough
to perform experiments with EEG registration.
New EEG Measure of the Alertness Analyzed by Emotiv EPOC in a Real Working Environment
37
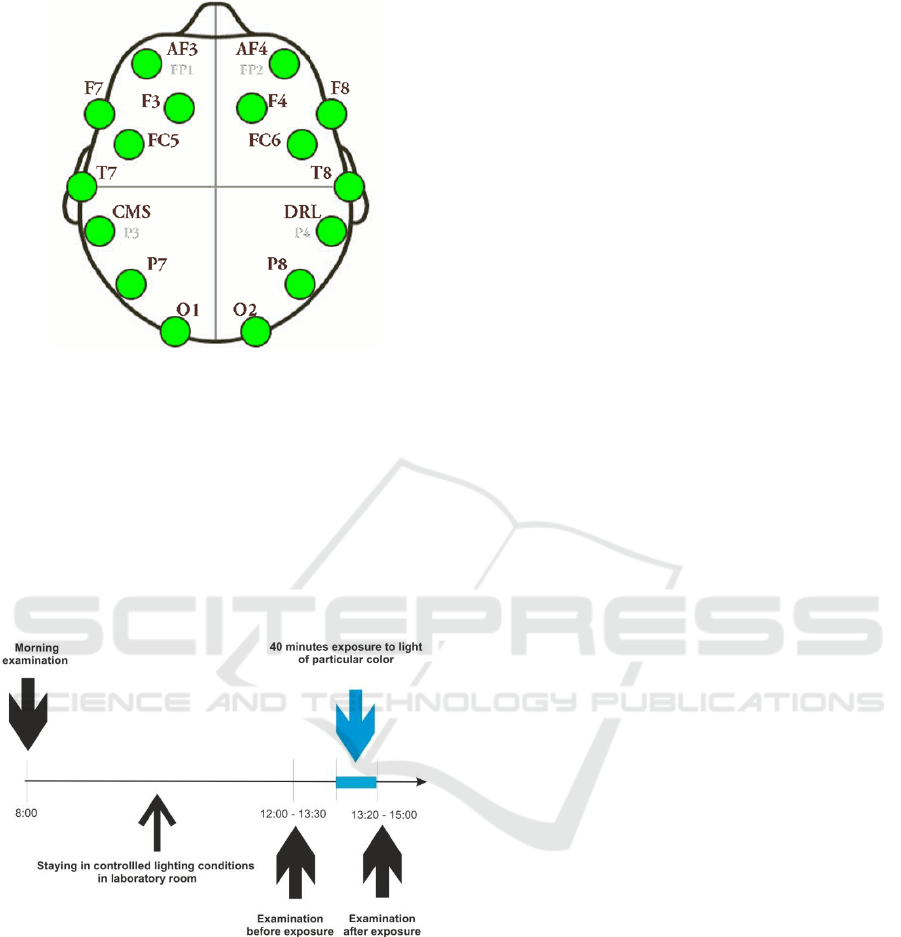
Figure 1: Placement of electrodes on the headset in the
Emotiv EPOC system. Picture from (Emotiv Systems
Inc.).
2.4 Procedure of the Experiments
Participants were informed about the experiment and
trained in the performance of visual tasks a few days
before experiments. Participants were instructed to
be well rested before the experiments. Participants
were asked to refrain from alcohol and caffeine
intake during the experimental sessions.
Figure 2: The course of the experiment, with time
dependencies, for one participant.
Participants experienced three experimental
sessions, separated by one week. On the
experimental days, participants arrived at the CIOP-
PIB laboratory at 8–8:30 AM and stayed in
controlled artificial lighting conditions under scene
“white”. They stayed until the afternoon drop in
their alertness (according to their sleepiness /
alertness assessment in personal diaries). Thereafter,
the first EEG measurements were carried out
(session “before exposition”). Then, one of three
lighting scenes, “white”, “red” or “blue”, was
modeled and participants performed visual tasks
typical for office work during 40 minutes of
exposure to particular light. At the end of the task,
the additional component (“red” or “blue”) of
lighting was switched off. Then, the second EEG
measurements were carried out (session “after
exposure”). The course of the experiment, with time
dependencies, for one participant is presented in
Figure 2.
All statistical analyses were carried out using
SPSS program version 18.
3 EEG ANALYSIS
3.1 Signal Acquisition
Signal acquisition took place using TestBench
software (from Emotiv System Inc.). We used a high
pass filter set at 0.2 Hz. To register markers that
signal the emergence of a stimulus on the screen, we
developed a communication between TestBench and
our original application CatchMe using the COM
port. After registration, we visually analyzed the
signal and we discarded fragments of the signal,
which cannot be solved in a different way. We used
EEGLab in this task. The next step was to filter the
signals in the frequency range 0.2 Hz – 40 Hz.
Initially prepared signal was analyzed by FFT
(Fast Fourier Transform) with 2 s Hamming window
and 1 s overlapping.
The next step was the visual analysis of the
collected data. We rejected cases where artifacts of
unknown origin occurred. We also rejected
incomplete registrations and those that did not
achieve the correct FFT analysis for all conducted
experiments. Finally, from the 50 sets of signals
(from 50 participants) we selected 46 for further
analysis.
Because of the lack of electrodes in the center of
the skull (Pz, Cz, Fz) in the Emotiv system, we have
to analyze signals from neighboring electrodes (O1,
O2, T7, T8, FC5, FC6). Preliminary trials before the
studies showed that the signals in such a situation
are of slightly lower quality but allow the
performance of analysis. Apart from artifacts, signal
registration in the Emotiv system often causes
problems of levels (signal levels at the various
electrodes may vary). In order to choose proper
electrodes, we analyzed the collected set of signals
and we selected electrodes from which we had better
quality of signals. Finally, we analyzed signals from
O1, T7 and FC5.
NEUROTECHNIX 2016 - 4th International Congress on Neurotechnology, Electronics and Informatics
38

For all participants the following bands were
selected:
Alpha 8–12 Hz from O1;
Beta from FC5;
o LowBeta 12–16 Hz;
o Beta 16–31 Hz;
o HighBeta 16–24 Hz;
Theta 4–8 Hz from T7;
AlphaTheta 5–9 Hz from T7;
DeltaTheta 0.3–3 Hz from FC5;
DeltaTheta 2.5–5.5 Hz from T7;
Total Power 6–40 Hz as average of all 14
electrodes.
In our experiment, we registered the above set of
signals for all participants. However, in the analysis
of the alertness we only used the frequency band of
4–12 Hz, because such a range is most commonly
documented in the literature (Sahin and Figueiro,
2013, Chang, 2013).
3.2 Analysis in Alpha Frequency Band
In the literature, we can find two general methods
for investigating symptoms of alertness in the EEG
signals. The first is where authors initially use
special mathematical algorithms for proper feature
extraction, for example principal component
analysis (PCA) in (Giusti, 2009). The second is
where the analysis is performed directly on the
signals (Sahin et al., 2014). The correlation between
level of alertness and level of proper bands of EEG
signals has been showed, so in our study we
analyzed directly registered EEG signals.
The most commonly used bands for
identification of alertness are: Alpha (8–12 Hz) or
AlphaTheta (5–9Hz) (Sahin and Figueiro, 2013,
Baek and Min, 2015; Klimesch, 2012, Okamoto,
2014). Therefore, initially we decided to analyze the
band Alpha. We analyzed the levels of Alpha before
being in a certain light scene and then afterwards. It
is reported in publications that an increase in
alertness should be associated with a decrease in the
level of Alpha (Lal, 2001).
Due to the high dispersion of data, which was the
result of a high level of precision, we decided to
transform the variables in order to reduce the
dispersion of the results. For this purpose, we carried
out the categorization of the dependent variables,
identified from the standard deviation values (+/- 1
to 3 standard deviations). Variables recorded in this
way show a decrease or increase in the measurement
of EEG both before and after exposure. This is a
change for the corresponding scaled value (1 to 8);
however, it does not show what value has changed
the EEG in each variable. From the description of
variables and recent statistics, it is known that the
exposure for each color has a different effect on the
value of the EEG. This resulted in different EEG
values, but the processed data did not take into
account this difference. For this reason, to each
identified group we assigned the average value of
the group. Such recordings were conducted
separately for each lighting scene (color).
The Kolmogorov-Smirnov test showed that the
tested variables are not distributed normally. Not in
groups, not without grouping. Levene's test
confirmed the homogeneity of variance.
Analysis using the Student's t-test for
independent samples showed no statistically
significant difference in the decrease in EEG (before
and after exposure) among people from younger
subgroup compared to the results of measurements
for the older subgroup for all kinds of light
(Table 1).
Table 1: Results of the first analysis for Alpha band
between two subgroups of participants under different
lighting scenes. Equal mean t test.
Lighting
scene
t
df
significance
(two-sided)
White
1.159
45
0.252
Red
1.522
45
0.135
Blue
1.872
45
0.068
Because the analyzed variables did not meet the
requirements, we decided to confirm the test results
using the non-parametric equivalent. The Mann-
Whitney U Rank test unfortunately confirmed that
among the analyzed variables there are no
statistically significant differences.
However, it is worth paying attention to the
values of significance. For the “blue” lighting scene
we obtained a result that is close to the possibilities
of the hypothesis confirmation (significance = 0.068
– in comparison to the expected 0.05). We can,
therefore, say that there is a tendency that the color
blue has a greater effect on alertness than the red and
white color, and red has greater effect than white.
3.3 Proposition of a New Alertness
Measure
There are known research of alertness, which uses a
very wide range of frequency analysis of EEG
signals. Chang (2013), for example, analyzed the
range of frequency covering the sum of Theta and
Alpha bands. Such an approach is justified by
New EEG Measure of the Alertness Analyzed by Emotiv EPOC in a Real Working Environment
39
individual differences in the response of EEG to
stimulus associated with alertness. However, an
excessively wide frequency range can cause
averaging of local extremes. In our experiments, the
first analysis carried out in only one band, Alpha,
did not produce statistical confirmation. In order to
try to confirm the study, we decided, therefore, to
take into account other recorded bands.
We introduced a new measure of alertness
(TAAT
max
) (1) based on the capture of signal
decreases in three bands: Theta, Alpha and
AlphaTheta. In our algorithm signals are analyzed
independently in each of these bands, and then the
biggest decrease among them is searched.
TAAT
max
= max(DIFF
T
, DIFF
A
, DIFF
AT
) (1)
Where DIFF
T
is the difference of power in Theta
band. This is calculated as power_before –
power_after. DIFF
A
is the difference of power in the
Alpha band and DIFF
AT
is the difference of power in
the AlphaTheta band, similarly calculated. Because
the decrease in signal level is correlated with an
increase in alertness, the greater the TAAT
max
the
higher the level of alertness.
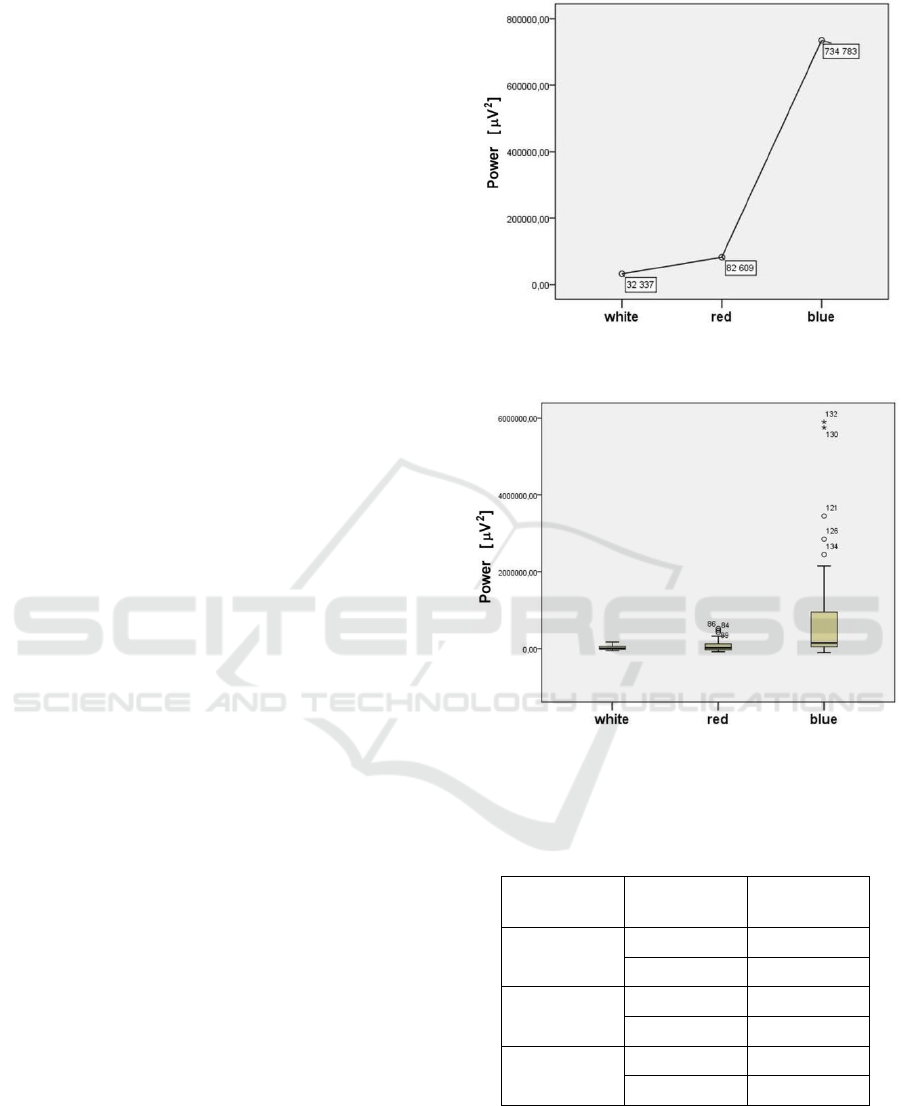
3.4 Analysis of the New Measure
In the analysis, One Way ANOVA,
F(2, 135) = 11.04; p < 0.001, was used. Post hoc
tests and comparison of averages showed that the
greatest differences (before – after) were observed
for the blue lighting scene (Figure 3). For red and
white scenes, small differences were obtained.
Similarly, the size decrease in the EEG signal for the
blue lighting scene was the highest (Figure 4).
Gamesa-Howell post hoc tests showed that there are
statistically significant differences between the
decline for the blue lighting scene and the other two
at the level of p < 0.005 for white and p < 0.01 for
red (Table 2).
The analyses allowed the conclusion that
alertness increased after exposure under the blue
lighting scene. Also, post hoc tests and comparison
of averages showed that white lighting scene has no
elicited alertness increase, but we can see a certain
tendency for the red light in this respect. These
results are consistent with previously published
studies.
On the one hand, it has been confirmed that
alertness can be recognized from the analysis of
bands: Alpha, Theta and AlphaTheta (Chang, 2013,
Sahin and Figueiro, 2013, Baek and Min, 2015,
Klimesch, 2012, Okamoto, 2014). On the other
hand, it has been confirmed that there is a strong
Figure 3: Mean differences of TAAT
max
level decline after
exposure under particular light scenes.
Figure 4: The size of EEG signal decline using TAAT
max
measure after exposure under particular light scenes.
Table 2: Results of the ANOVA analysis for TAAT
max
measure (selection of the independent falls capture in
Alpha, AlphaTheta and Theta bands).
Lighting
scene
Lighting
scene
significance
White
Red
0.079
Blue
0.003*
Red
White
0.079
Blue
0.007*
Blue
White
0.003*
Red
0.007*
influence from blue light and a weak influence from
red on alertness, according to earlier publications
(Sahin and Figueiro, 2013, Sahin, 2014). However,
in our research the influence of red light has not
been confirmed statistically.
NEUROTECHNIX 2016 - 4th International Congress on Neurotechnology, Electronics and Informatics
40

4 CONCLUSIONS
Obtained results of measured EEG showed an
increase in alertness after 40 minutes exposure to
blue enriched white lighting modeled for normal use
in office working. It was also stated that red
enriched white lighting could increase the alertness,
but much less than was the case with blue. It is
worth noting that red light influences alertness, but
in a different way than that for melatonin
suppression, as it is for blue light. However, a
statistically significant effect on alertness was
observed only for blue light. The tendency of
increasing alertness after red light exposure was also
noticed, but that effect was not statistically
significant.
Our results confirm that blue light is the most
effective in increasing alertness, even if it is only
component (significant) of the lighting spectrum.
This was stated for real working environments and
exposure to blue enriched white lighting and with
participants not having heads fixed in one position
but performing office work during exposure. Most
of the light falling on the cornea was indirect (after
multiple reflections from the environment). In the
literature (Figueiro and Rea, 2010, Hanifin et al.,
2006, Sahin and Figueiro, 2013, Sahin et al., 2014),
the exposure was to direct light from different
lighting fixtures and subjects were looking directly
at the light, so they had not performed any work
during exposure. Our study is the first attempt to
create lighting conditions suitable for increasing
alertness and also adequate for working performance
which could be applied in reality.
The research was conducted on a group of 50
participants. It is worth noting that this is the first
study on the effect of lighting on the level of
alertness, which has included such a large group of
participants.
Additionally, the study confirmed the possibility
of the use of such low-cost equipment. Despite its
disadvantages known from the literature, the Emotiv
EPOC device allowed for the correct registration of
the EEG signal. The proposed measure of the
alertness level, which is based on the analysis of the
three bands (Alpha, Theta and AlphaTheta), proved
to be sufficiently effective. The use of this measure
in our study allowed an assessment of the effect of
blue light, which was confirmed statistically.
It is worth noting that this material gathered from
research on a large group of people will allow for
the future performance of additional analyses. In our
study, we used the bands of 4–12 Hz, because such a
range is most commonly documented in the
literature connected with alertness investigations.
However, we registered many other bands of signals
for all participants. It is planned to carry out
analyses including Beta (especially LowBeta and
optionally independently HighBeta), Delta and
DeltaTheta bands. We also want to use emotions
identified by the software of Emotiv EPOC device.
ACKNOWLEDGEMENTS
This paper has been based on the results of a
research task carried out within the scope of the third
stage of the National Programme "Improvement of
safety and working conditions" partly supported in
2014–2016 --- within the scope of research and
development --- by the Ministry of Labour and
Social Policy. The Central Institute for Labour
Protection -- National Research Institute is the
Programme's main co-ordinator.
REFERENCES
Aube, M., Roby, J., Kocifaj, M. (2013): Evaluating
potential spectra impacts of various artificial lights on
melatonin suppression, photosynthesis and star
visibility. PLOS ONE. 8(7), 1-15.
Badcock, N. A., Mousikou, P., Mahajan, Y., de Lissa, P.,
Thie, J., McArthur, G. (2013). Validation of the
Emotiv EPOC® EEG gaming system for measuring
research quality auditory ERPs. PeerJ, 1, e38.
Baek, H. and Min, B. K. (2015). Blue light aids in coping
with the post-lunch dip: an EEG study. Ergonomics,
58(5), 803-810.
Brainard, G. C., Hanifin, J. P., Greeson, J. M., Byrne, B.,
Glickman, G., Gerner, E., Rollag, M. D. (2001).
Action spectrum for melatonin regulation in humans:
Evidence for a novel circadian photoreceptors. J.
Neuroscience 21, 6405-6412.
Chang, A. M., Scheer, F. A., Czeisler, C. A., Aeschbach,
D. (2013). Direct effects of light on alertness,
vigilance, and the waking electroencephalogram in
humans depend on prior light history. Sleep. 36(8),
1239-1246.
Duvinage, M., Castermans, T., Dutoit, T., Petieau, M.,
Hoellinger, T., Saedeleer, C. D., Cheron, G. (2012). A
P300-based quantitative comparison between the
Emotiv Epoc headset and a medical EEG device. In:
Proceedings of the 9th IEEE/IASTED International
Conference on Biomedical Engineering. Innsbruck,
Austria: Acta press; 2012. doi:10.2316/P.2012.764-
071.
Ekanayake, H. (2010). P300 and Emotiv EPOC: Does
Emotiv EPOC capture real EEG?” viewed 2 May
2016, http://neurofeedback.visaduma.info/emotiv
research.htm, updated version (2015) from:
New EEG Measure of the Alertness Analyzed by Emotiv EPOC in a Real Working Environment
41

http://neurofeedback.visaduma.info/EmotivResearch.p
df.
Emotiv Systems Inc. viewed 2 May 2016
http://www.emotiv.com/
EN 12464-1, (2011). Light and lighting. Lighting of work
places. Part 1. Indoor work places. European Lighting
Standard.
Fakhruzzaman, M. N., Riksakomara, E., Suryotrisongko,
H. (2015). EEG Wave Identification in Human Brain
with Emotiv EPOC for Motor Imagery. Procedia
Computer Science. 72, 269-276.
Figueiro, M. G., Rea, M. S., (2010). The effects of red and
blue light on circadian variations in cortisol, alpha
amylase and melatonin. International Journal of
Endocrinology. 2010 (Article ID 829351),
doi:10.1155/2010/829351.
Giusti, A., Zocchi, C., Rovetta, A., 2009. A Noninvasive
System for Evaluating Driver Vigilance Level
Examining Both Physiological and Mechanical Data.
IEEE Trans. on Intelligent Transportation Systems.
10(1), 127-134.
Gola, M., Magnusk, M., Szumska, I., Wróbel, A. (2013).
EEG beta band activity is related to attention and
attentional deficits in the visual performance of elderly
subjects. International Journal of Psychophysiology,
89(3), 334-341.
Górnicka, G. B. (2008). Lighting at work: environmental
study of direct effects of lighting level and spectrum
on psychophysiological variables. PhD Thesis,
Technische Universiteit Eindhoven.
Hanifin J. P, Stewart K. T., Smith P., Tanner R., Rollag
M., Brainard, G. C., (2006). High-intensity red light
suppresses melatonin. Chronobiol Int. 23(1-2), 251-
68.
Horne, J. A. and Östberg, O. A. (1976). A self-assessment
questionnaire to determine morningness-eveningness
in human circadian rhythms. International Journal of
Chronobiology. 4, 97-110.
Ji, H., Li, J., Cao, L., Wang, D. (2012, Marz). A EEG-
Based Brain Computer Interface System towards
Applicable Vigilance Monitoring. In: Foundations of
Intelligent Systems. Chapter In: Advances in
Intelligent and Soft Computing. 122, 743-749.
Klimesch, W. (2012). Alpha-band oscillations, attention,
and controlled access to stored information. Trends in
cognitive sciences. 16(12), 606-617.
Lal, S. K. I. and Craig, A. (2001). A critical review of the
psychophysiology of driver fatigue. Biological
Psychology. 55(3), 173-194.
Li, J., Yan, C. G., Xia, B., Cao, L., Wang, D. M., Sun, Y.
R. (2010). EEG-based Brain Computer Interface for
Vigilance Analysis and Estimate. In: Proceedings of
Conference on Asia-Pacific Signal and Information
Processing Association, APSIPA ASC, Singapore, 14-
17 Dec. 2010, 189-192.
Okamoto, Y., Rea, M. S., Figueiro, M. G. (2014).
Temporal dynamics of EEG activity during short- and
long-wavelength light exposures in the early morning.
BMC Res Notes, 2014; 7:113.
Pham, T. D. and Tran, D. (2012). Emotion Recognition
Using the Emotiv EPOC Device. In: LNCS 7667, 394-
399, Springer-Verlag Berlin Heidelberg.
Rahman, S. A., Flynn-Evans, E. E., Aeschbach, D.,
Brainard, G. C., Czeisler, C. A., Lockley, S. W.
(2014). Diurnal spectral sensitivity of the acute
alerting effects of light. Sleep. 37(2), 271-281.
Ramirez, R. and Vamvakousis, Z. (2012). Detecting
Emotion from EEG Signals Using the Emotive Epoc
Device. In: LNCS 7670, 175-184. Springer-Verlag
Berlin Heidelberg.
Sahin, L. and Figueiro, M.G. (2013). Alerting effects of
short-wavelengths (blue) and long – wavelengths (red)
lights in the afternoon. Physiology & Behaviour. 116-
117(5), 1-7.
Sahin, L., Wood, B.M., Plitnick, B., Figueiro, M.G.
(2014). Daytime light exposure: effects on biomarkers,
measure of alertness and performance. Behavioural
Brain Research. 274(1 November), 176-185.
Stytsenko, K., Jablonskis, E., & Prahm, C. (2011, August).
Evaluation of consumer EEG device Emotiv EPOC.
In: Proceedings of MEi: CogSci Conference 2011.
Thapan, K., Arendt, J., Skene, D. (2001). An action
spectrum for melatonin suppression: Evidence for a
novel non-rod. non-cone photoreceptor system in
humans. J. Physiol. 535, 261-267.
Viola, A.U., James, L.M., Schlangen, L.J., Dijk, D.J.
(2008). Blue-enriched white light in the workplace
improves self-reported alertness, performance and
sleep quality. Scand J Work Environ Health. 34(4),
297-306.
Wolska, A. and Sawicki, D. (2015). Melanopic lux and
blue light under different lighting scenarios. In:
Proceedings of the 28th Session of the CIE, June 28 -
July 4, 2015, Manchester UK. Vol.1, Part 2, 1238-
1243.
Zhan, Z. and Mu, Z. (2013). Vigilance Degree Computing
based on EEG. Telkomnika. 11(9), 5409-5414.
NEUROTECHNIX 2016 - 4th International Congress on Neurotechnology, Electronics and Informatics
42
