
GAdaBoost: Accelerating Adaboost Feature Selection with Genetic
Algorithms
Mai F. Tolba and Mohamed Moustafa
Computer Science and Engineering Department, The American University in Cairo, Road 90, New Cairo, Cairo, Egypt
Keywords:
Object Detection, Genetic Algorithms, Haar Features, Adaboost, Face Detection.
Abstract:
Boosted cascade of simple features, by Viola and Jones, is one of the most famous object detection frame-
works. However, it suffers from a lengthy training process. This is due to the vast features space and the
exhaustive search nature of Adaboost. In this paper we propose GAdaboost: a Genetic Algorithm to acceler-
ate the training procedure through natural feature selection. Specifically, we propose to limit Adaboost search
within a subset of the huge feature space, while evolving this subset following a Genetic Algorithm. Experi-
ments demonstrate that our proposed GAdaboost is up to 3.7 times faster than Adaboost. We also demonstrate
that the price of this speedup is a mere decrease (3%, 4%) in detection accuracy when tested on FDDB bench-
mark face detection set, and Caltech Web Faces respectively.
1 INTRODUCTION
Machine learning and training, require large feature
sets, which can be time consuming to explore. With
the advancement of this field the need for algorithms
to decrease the training time arose. Genetic Algo-
rithms (GA) has proven its strength in solving prob-
lems like the aforementioned one, especially those
concerned with exploring large search spaces, and
providing acceptable results in a significantly less
amount of time than the brute force manner. Many re-
search has explored the use of GA in time consuming
tasks like feature selection, which aims to choose a
representative small subset of features from the whole
set of features (Xue et al., 2015).
Object detection lies in the set of machine learn-
ing techniques that require a huge search space for
training, thus their training is time consuming. Ob-
ject detection is concerned with detecting whether an
object is present in a given image, and where it lies
in this image. It has many applications including, but
not limited to, face detectors in all modern state of the
art cameras, automotive safety, video indexing, image
classification, surveillance, and content-based image
retrieval (Lillywhite et al., 2013).
Much research has been put into this area, due to
its complex nature as detection is hard to achieve in
different light conditions, occlusion and the angle in
which the object appears in the image (Lienhart and
Maydt, 2002; Lillywhite et al., 2013; Viola and Jones,
2001). Researchers has been trying to implement ef-
ficient high speed detectors that work in real time
and has a high percentage of accuracy. Though the
Viola-Jones detector has reached an impressive de-
tection speed it still consumes a lot of time in train-
ing. Viola-Jones uses Adaboost, a type of boosting
algorithms, to select and combine weak classifiers to
form a strong one. Adaboost is simple and adaptive
(Dezhen and Kai, 2008), yet it operates in a brute
force manner, passing by all the set of features mul-
tiple times. This can be very time consuming, as the
search space consists of a set of more than 162,000
features for a 24X24 image.
The main contribution of this paper is increasing
the speed of training of the Viola-Jones face detector
by implementing a hybrid approach that combines the
use of boosting and GAs. This will find the best fea-
tures efficiently instead of going through all of them
in a brute force manner, which will decrease the train-
ing time. The Paper is organized as follows: section 2
discusses some of the related previous work. Section
3 explains the proposed method. Section 4 provides
some experiments and their results. Section 5 con-
cludes the paper and discuss future enhancements.
2 RELATED WORK
Genetic Algorithms (GA) are optimizing procedures
that are devised from the biological mechanism of
156
Tolba, M. and Moustafa, M.
GAdaBoost: Accelerating Adaboost Feature Selection with Genetic Algorithms.
DOI: 10.5220/0006041101560163
In Proceedings of the 8th International Joint Conference on Computational Intelligence (IJCCI 2016) - Volume 1: ECTA, pages 156-163
ISBN: 978-989-758-201-1
Copyright
c
2016 by SCITEPRESS – Science and Technology Publications, Lda. All rights reserved

reproduction, and evolutionary science (Sun et al.,
2004). GA continues to prove itself successful in
many fields including object detection. There are
other optimization methods that serve well; however,
from some experiments, GA has proven to perform
better in solving problems. This might be due to the
advantages of GA and that they are probabilistic and
not deterministic, and have the ability to be better at
avoiding to be stuck at a local maxima and are par-
allelizable. Ferri et al. (1994), compared GA against
sequential search and their results clearly show that
GA performs better. Their work highlighted the point
of strength of GA which is the ability to perform the
search in a near optimal region due to the inherited
randomizations used in the search. Tabassum and
Mathew (2014), said that It was proved that genetic
algorithms are the most powerful unbiased optimiza-
tion techniques for sampling a large solution space.
After implementing the Knapsack problem and im-
age optimization, they concluded in their paper that
GA are the best application to solve various common
problems and that they are suitable for solving high
complexity problems like the combinatorial optimiza-
tions. Sun et al. (2004) provided another proof to the
strength of GA, when they used it to select the best
eigenvectors. In their work GA was used to solve the
problem of selecting the best feature set. They com-
pared their results with other techniques and proved
to provide better accuracy with less number of fea-
tures. Lillywhite et al. (2013) used Genetic algo-
rithms in constructing features which was used by
Adaboost to train a classifier. They tested their ap-
proach against previously published papers and used
the same dataset for comparison. Their technique
proved to be significantly more accurate than most of
the previous work they compared against. Some re-
searchers used GA in feature selection. Feature selec-
tion methods can be divided into 3 main categories:
wrappers, filters and embedded methods. Filters are
a form of preselecting each feature on its own with-
out considering the previous predictor. Wrappers are
methods to score the predictive power of a subset of
features by using a machine learning technique as a
black box, while the embedded are methods that inte-
grate classification and learning into a single process
(Chouaib et al., 2008; Xue et al., 2015) . In Their
work, Chouaib et al. (2008) aimed to find the set of
the most representative features using GAs, in order
to decrease the detection time. Their results showed
that for the majority of descriptors their feature set
was significantly reduced up to 75% of the original
set in two class problems. Dezhen and Kai (2008)
provided a post optimization technique to avoid the
redundancy of classifiers. By doing so, they managed
to increase the speed of classification by 110% due to
reducing the number of features to 55% of the original
set. Since this is a post optimization process, it can be
considered as an added part to the training process,
which will be an overhead on the training time. Xue
et al. (2015) provided a survey on the use of evolu-
tionary computing in feature selection. In their work
they surveyed more than 40 papers which use GA in
feature selection.
Object detection is a main area of research in com-
puter vision. It falls under the type of problems that
suffer from a time consuming training process, due
to the huge search space involved. Viola and Jones
(2001) devised a new face detector using Haar fea-
tures, since features provide a set of comprehensive
information that can be learned by machine learning
algorithms. They also reduce the in-out class vari-
ability compared to that of the raw pixels (Lillywhite
et al., 2013; Viola and Jones, 2001). Haar features
are mainly rectangles divided into black and white re-
gions and the value of this feature is calculated by
subtracting the sum of pixels in the white region from
the sum of those in the black region (Viola and Jones,
2001). For each image, variations of each of the four
Haar feature types are computed in all possible sizes
and all possible locations, which provides a huge set
of features.
The authors chose Adaboost as a method to obtain
their strong classifier. Adaboost was proposed by Fre-
und and Schapire (1995), it has the power to search
through the features and select those of good perfor-
mance then combine them to create a strong classifier.
The general idea of the algorithm works as follows:
For a number of iterations T:
• Pass through the set of all possible features and
calculate the error of each one on the given im-
ages.
• Choose the best feature (the one with the lowest
error) as the first weak classifier.
• Update the sample images corresponding weights,
by putting more weights on the wrongly classified
images.
• It then goes through the next iteration, until it
finds the set of best features, to be used in clas-
sification.
One of the important contributions of Viola and
Jones (2001) work is the cascade classifier which in-
creased the accuracy while radically reducing the time
consumed in detection. The cascade classifier is a
stage classifier where the thresholds vary. The first
stages has a low threshold, thus detecting all the true
positives while eliminating the strong negatives, be-
fore more complex classifiers are used to achieve less
GAdaBoost: Accelerating Adaboost Feature Selection with Genetic Algorithms
157
false positives. Although their final detector has per-
formed well in terms of accuracy, the training process
is time consuming as Adaboost passes by the set of all
possible features multiple times in training each stage
of the classifier. In addition to that, training the stage
classifier becomes slower in the last stages since the
images become harder to classify. This is due to the
use of images that were classified as false positives
by the previous stages, therefore the last stages of the
classifier typically need more features to satisfy the
false alarm and the true positive rates desired. This
means that the final stages has to go through the set of
all possible features more times than in the first stages
which puts an overhead on the training time.
Some of the researchers used the Viola-Jones al-
gorithm as a base for their research to provide a more
powerful detector. Lienhart and Maydt (2002) pro-
posed the increase of the Haar features used. Instead
of using only the four basic types of Haar features,
they increased them to include the 45 degree rotation
of the original ones, consequently, the total number
of feature types amounted to 14. The use of more fea-
tures resulted in better accuracy, yet it substantially
increased the number of generated features per im-
age. A larger feature set means that more time will
be taken by the training as the Adaboost operates in a
brute force manner.
The previous work was concerned with enhanc-
ing the accuracy or speed of detection regardless of
the overhead posed on the training time. This work
aims to examine the effects on increasing the speed
of training using GA and how this might affect the
accuracy.
3 PROPOSED METHOD
The proposed method (Named: GAdaBoost) applies
GA to select a set of features, to have Adaboost
choose from, instead of going through the set of all
possible features. The original Adaboost algorithm
was proposed by Freund and Schapire (1995) the gen-
eralized version works as follows: for the training of
each stage in the stage classifier, the algorithm passes
through the set of all possible features and calculates
the error of each feature on each given image. Af-
ter that, it chooses the best feature (the one with the
lowest error, i.e best classifies the image correctly) as
the first weak classifier. It then updates the sample
images and their corresponding weights, by putting
more weights on the wrongly classified images. The
procedure is repeated until the set of chosen features
reaches a preset false alarm, and hit rate set for clas-
sification.
In order to integrate the use of GA, OpenCV
0
s (It-
seez, 2015) implementation on the Viola Jones algo-
rithm has been modified. Incorporating the use of GA
will increase the training speed by avoiding the error
calculation of the set of all possible features, and only
providing the Adaboost algorithm with a representa-
tive set of features, that have been chosen based on
their classification power. This set of representative
candidate features is to be prepared by the GA before
the training of each stage in the final classifier. For
example if the final classifier is to have 10 stages the
added GA technique is to be repeated 10 times. The
stage training utilizes Adaboost technique to choose
multiple weak classifiers from the mentioned repre-
sentative set, in order to reach the desired false alarm
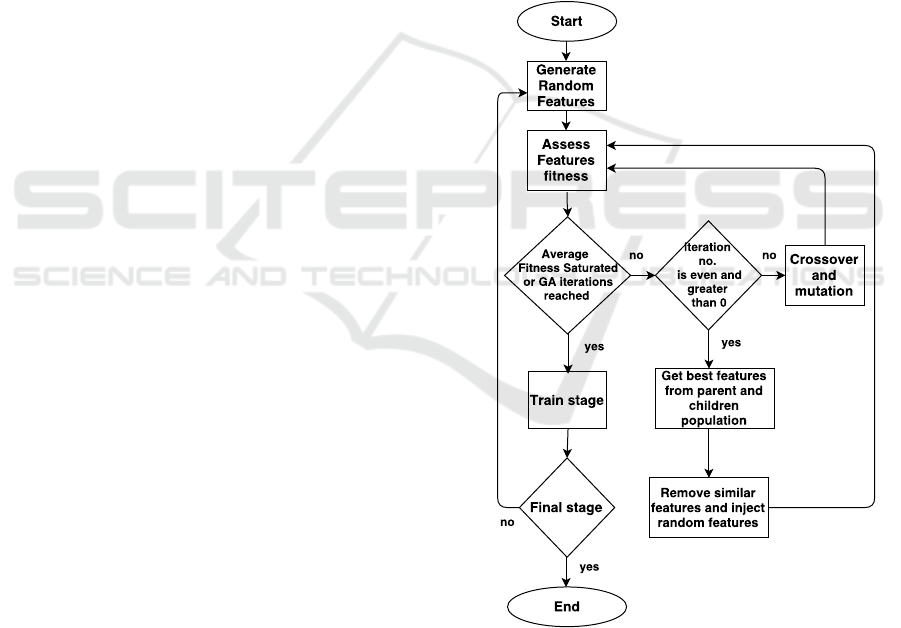
and hit rate preset for the stage. Figure 1 shows a
block diagram that explains the proposed GAdaBoost
technique.
Figure 1: GAdaBoost diagram.
On the first iteration the GAdaboost chooses a pre-
set number of features randomly to create the first
generation of the given population size. Those ran-
domly chosen features are marked so that they are not
to be used again when more random features are to
be generated. This is done to explore more of the
set of all possible features. In order to assess the
ECTA 2016 - 8th International Conference on Evolutionary Computation Theory and Applications
158
predictive power of these features, they are passed
to a learning algorithm. The way this has been im-
plemented is by creating a temporary (dummy) stage
where the features are trained in the same way the
original stage training works, i.e the dummy stage is
an Adaboost training algorithm. The number of weak
classifiers chosen by the Adaboost algorithm in the
dummy stage is a variable that is preset. The Ad-
aboost algorithm associates the features with scores
that are a representation of their predictive power. Af-
ter that the best features are then selected and have
mutation and crossover processes preformed on them
to get the next generation of an even better preforming
set of features. The new generation is then passed by
a dummy stage for scoring. The process is repeated
until the average fitness of the population saturates
or a predefined number of iterations is reached. As
a form of exploring more of the set of all possible
features, for each iteration with an even number (2nd,
4th, etc. generations) that is greater than zero, the best
set of parents and their children produced are chosen.
Then a spatial comparison is formed to remove the
redundant features, and random features are inserted
instead to complete the population size. The spatial
comparison is done using the pasacal criterion where
two features are considered of spatial similarity if the
ratio of the intersection of the two features over the
union of the two is greater than 0.4. This method is
described in more details in section 4.3. The use of
only even iterations entails that the spacial compari-
son is done on half the number of iterations (eg for 50
iterations, the spatial comparison is done 25 times).
The final set of features obtained by the GA is passed
through a real stage where the weak classifiers se-
lected by this stage are to be used in the resultant final
classifier. The afore mentioned technique ensures that
the Adaboost algorithm will only evaluate the popu-
lation size chosen instead of going through the whole
set of features when selecting the weak classifiers of
the resultant final stage classifier.
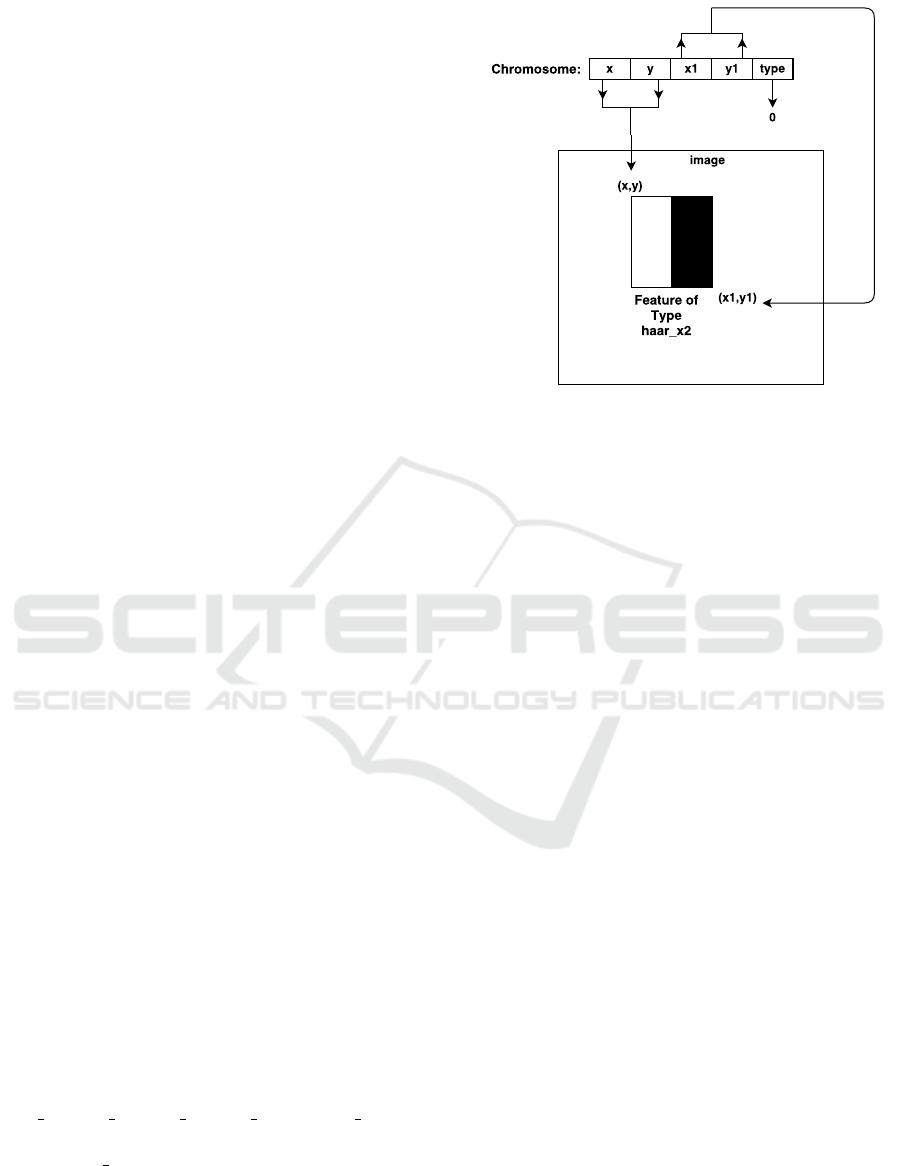
As for the Genetic Algorithm parameters, each
chromosome represents one Haar feature. The val-
ues of the chromosome are x, y, x1, y1, type, where x,
y are the upper left coordinates of the feature rectan-
gle, and x1, y1 are the lower right corner. The type
is a value from 0-4 where each number represents
one of the Haar Feature types used for upright frontal
faces detection. 0,1,2,3,4 represent the Haar types of
haar x2, haar y2, haar x3, haar y3, and haar x2y2 re-
spectively. Figure 2 explains the mapping of a feature
of type haar x2 to a chromosome in a given image.
As shown the chromosome carries decoded informa-
tion about the type of the feature and its orientation
in a given image, the way the chromosome is repre-
Figure 2: Chromosome to feature mapping.
sented facilitates the mutation and the crossover pro-
cesses which provides new features. The fitness func-
tion is a measure of how well this features splits be-
tween the negative and the positive images, or in other
words predictive power of this feature in classifying
the images correctly. The OpenCV implementation
uses decision stumps as weak classifiers, these deci-
sion stumps are Classification and Regression trees
(CART). In CART the regression trees best split qual-
ity is calculated by the minimization of Equation 1.
n
∑
i=1
(T R
i
− PR
i
)
2
(1)
Where TR is the ground truth of the image, PR
is the predicted responses by the decision stump and
n is the number of sample images. Yet, for simplicity
the OpenCV traincascade developer mentioned that in
implementation the minimization criteria is reduced
to equivalent simpler maximization ones (Dimashova,
2012). The fitness of the feature used is the split qual-
ity measure provided by OpenCV
0
s CVDTree class.
Thus, in the implementation the best feature is the
one the largest quality. The candidates to be used for
crossover and mutation are selected using a Roulette
Wheel selection method, so that those features with
higher fitness are more likely to be selected and have
the mutation and the crossover applied on them. A
simple one-point crossover is utilized at the lower
right corner of the two candidate features. In order
to reduce the time taken by validation of the correct-
ness of the feature, the mutation is designed to assign
the type to the feature according to how suitable this
type is, given the coordinates of this feature.
GAdaBoost: Accelerating Adaboost Feature Selection with Genetic Algorithms
159
4 EXPERIMENTS AND RESULTS
In this section we discuss our experimental work, its
setup, and the acquired results. It is divided into 3
subsections, each one describes an experiment setup
and discusses the results acquired. The first section
shows the fitness of the individual and the average
fitness of the population. The second one shows the
effects of varying the population size on the training
time. The final one shows the effect of varying the
number of iterations of GAdaBoost and comparing it
against the original brute force algorithm with respect
to the training time and accuracy. The testing was
performed on both the FDDB dataset, and Caltech
10,000 Web Faces dataset. All the training occurred
on the same computer with an Intel Core i7-4510U @
2.00GHz processor and 8 GB RAM.
The positive images used for training are the im-
ages provided by OpenCV for the upright frontal
faces training. The negative images were picked ran-
domly from the dataset of 101 objects developed at
Caltech (Fei-Fei et al., 2004). All the experiments
use the same settings of a 17 stage cascade classifier
with 500 positive images and 500 negative images per
stage, hit rate of 0.9 and a false alarm rate of 0.5 per
stage. Each dummy stage is trained for 3 weak clas-
sifiers and the sample image weights are carried on
between the dummy stages, with the exception of ex-
periments in section 4.1 where each dummy stage has
been trained for only one weak classifier, with no car-
rying on of the image weights between dummy stages,
and the check on the special proximity and its removal
wasn
0
t utilized.
4.1 Individual and Population Fitness
In this Experiment the GAdaBoost discussed in the
proposed method (section 3) has been used to train a
cascade classifier with the settings mentioned in the
beginning of this section. A population size of a 1000
and 50 iterations were the parameters set for the GAd-
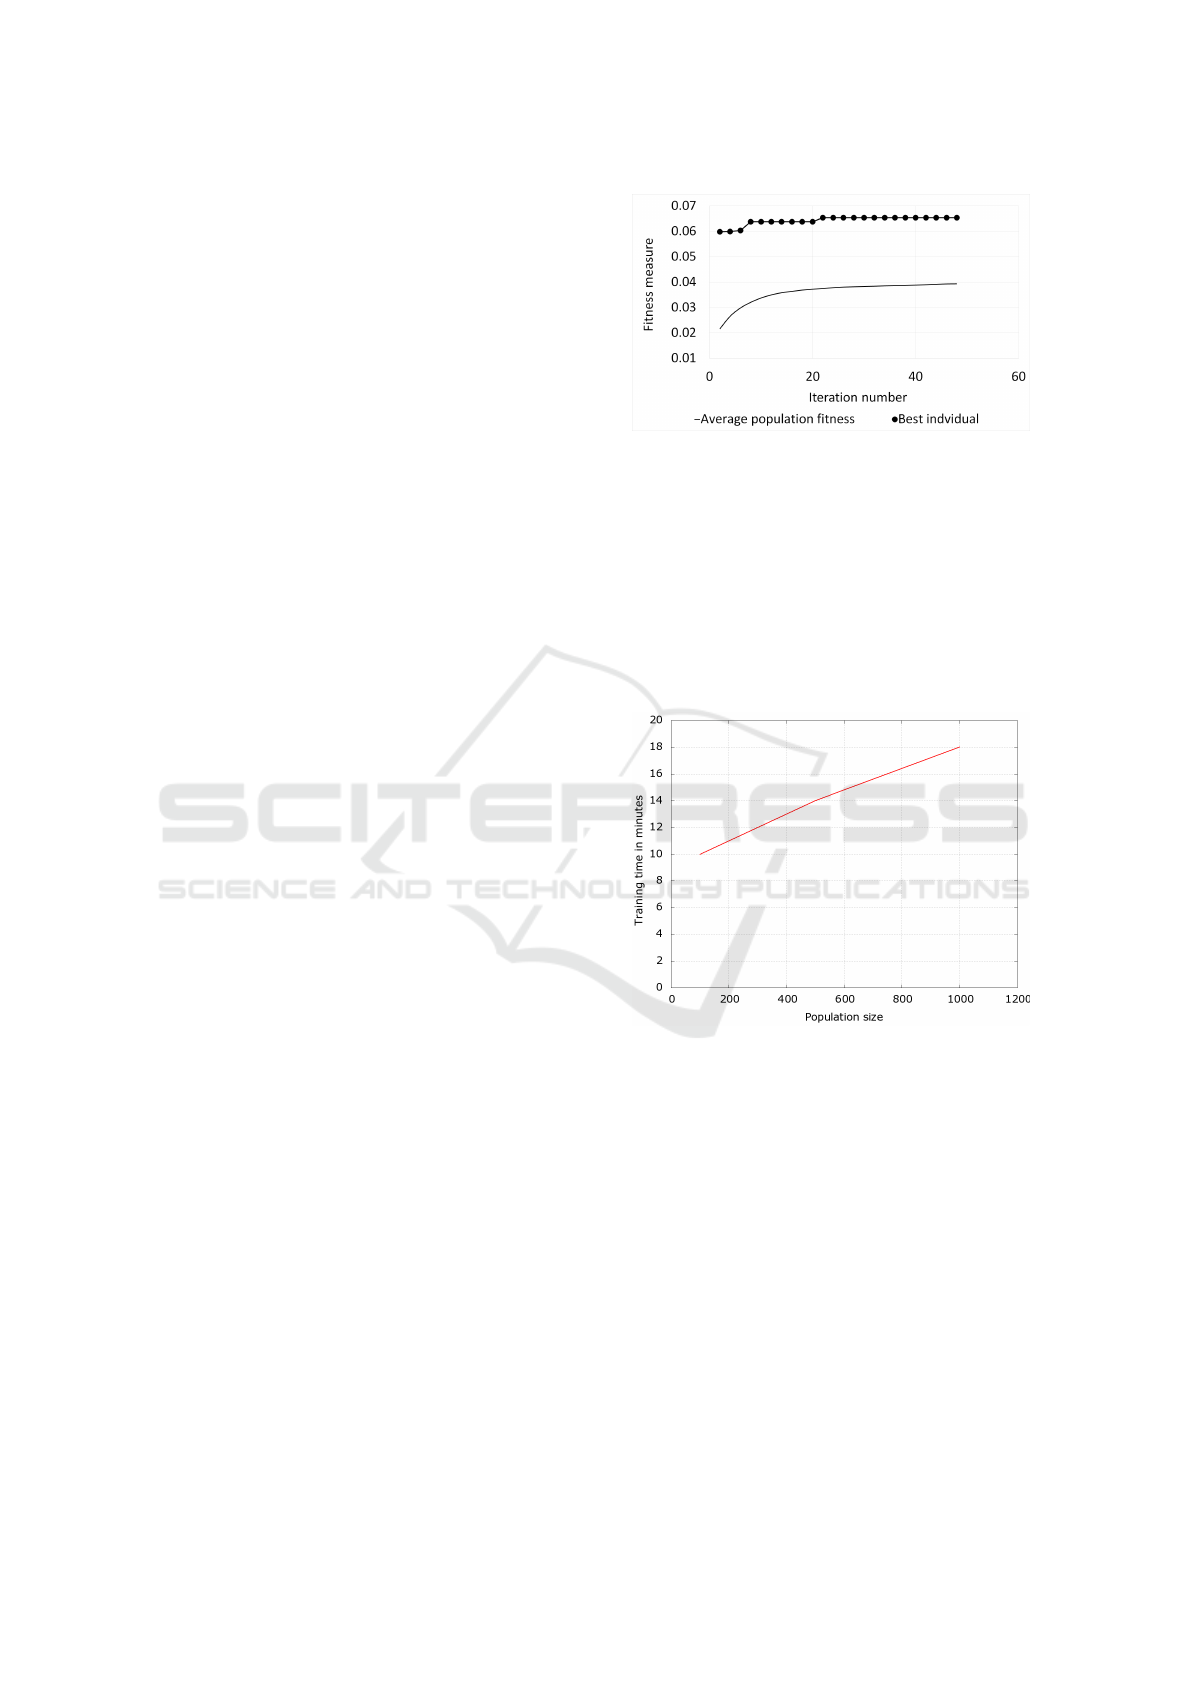
aBoost. Figure 3 shows the progress of the best indi-
vidual, and the average fitness of the population. They
are shown over the course of the 50 iterations of the
GA preformed before the 17th stage.
As shown from Figure 3, the average population
fitness increases fast in the first iterations then it starts
to saturate, while the fitness trend of best individual is
to increase then saturate and so on.
4.2 Population Size vs Training Time
In this Experiment 20 iterations is set for GAdaboost.
Each classifier has been trained multiple times and
Figure 3: Best individual fitness and average population fit-
ness over 50 iterations.
the average time taken has been calculated. Figure
4 shows the effect of varying the population size on
the training time.
From Figure 4 it is clear that the training time
increases as the population size increases. This
can be attributed to the fact that less mutations and
crossovers are done with a smaller population size,
and that the GA provides the Adaboost with a smaller
feature set to go through in a brute force manner.
Figure 4: Population size vs training time.
4.3 Training Speed Up vs. Accuracy
As a baseline a cascade classifier has been trained
using OpenCVs traincascade method using the same
settings. This classifier has been used as a base-
line to compare our algorithm with. We performed
our experiment on both the Face Detection Dataset
(FDDB)(Jain and Learned-Miller, 2010), and Caltech
10,000 Web Faces dataset (Angelova et al., 2005).
Face detection datasets were chosen since Haar fea-
tures were used originally to detect upright frontal
faces. The FDDB dataset is a benchmark dataset de-
signed for studying the unconstrained face detection
problem. This dataset has been used in many studies
and is considered one of the difficult datasets, due to
occlusions, out of focus faces and difficult poses (Jain
ECTA 2016 - 8th International Conference on Evolutionary Computation Theory and Applications
160
and Learned-Miller, 2010). This dataset contains an-
notations for 5171 faces in a set of 2845 images. In
this paper 290 images from this dataset has been used
for experimentation. For the evaluation of our detec-
tor on this dataset, we used the evaluation code pro-
vided by the authors of this dataset.
Caltech Web Faces is a dataset of human faces col-
lected from the web (Angelova et al., 2005). It is a
challenging dataset since it contains difficult exam-
ples such as extreme face orientations, occlusion like
hats and glasses and variable light conditions (An-
gelova et al., 2005). The Caltech Web Faces data
set consists of 10,524 annotated faces where the co-
ordinates of the mouth, eyes and nose are given. For
our experiments we randomly extracted 500 images
to test on. We used the given eye coordinates to set
a bounding square by assuming that the eye distance
is half the face width. For evaluation, we use the pas-
cal criteria shown in Equation 2 (Everingham et al.,
2010).
area(B
gt
∩ B
det
)
area(B
gt
∪ B
det
)
> 0.4 (2)
Where B
gt
is the ground truth bounding box and
B
det
is the detected bounding box. Thus the ratio of
the area of intersection between the two boxes to the
area of their union has to exceed 0.4 in order for the
detected box to be counted as a face.
To test our algorithm we examined two variations
of the GAdaBoost cascade classifier where we vary
the number of iterations. GAdaboost has been trained
using 20 and 50 iterations. Every experiment has been
run multiple times, and an average of the training time
and the performance of all the runs has been calcu-
lated. The speed of training vs accuracy of the two
GAdaboost variations have been compared against
the baseline.
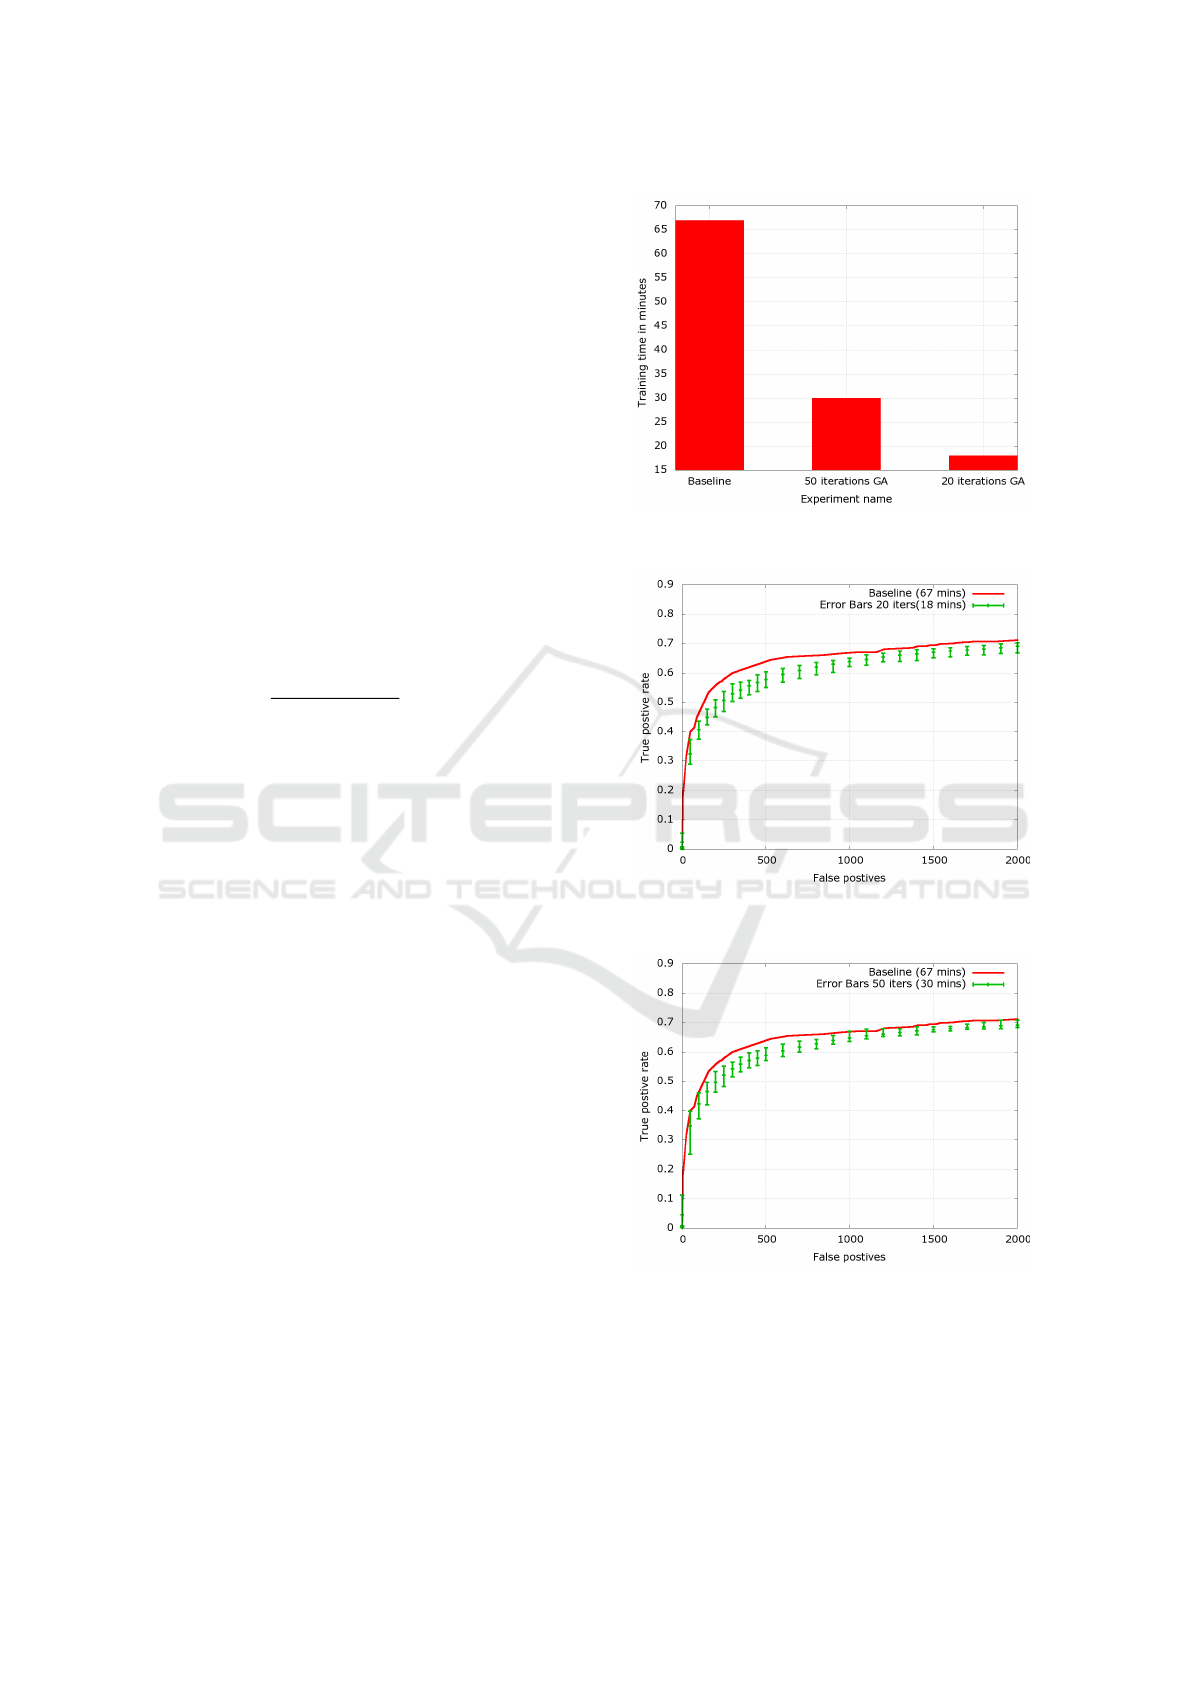
The obtained results show that training GAd-
aBoost in the two experiments took significantly less
time than training the baseline. Training our approach
with 20 and 50 iterations took about 26.8% and 44.7
% percent of the time taken to train the baseline re-
spectively. Figure 5 visually emphasizes the differ-
ence in training time taken by the baseline and both
algorithms.
Figures 6 and 7 provide the Y error bar graphs,
showing the maximum, minimum and average results,
for all the runs of both the 20 and the 50 iterations
GAdaBoost on FDDB dataset. Its clear from the fig-
ures that the 50 iterations GAdaboost preforms better.
It even has best case scenarios where the accuracy was
almost the same as the baseline, for certain numbers
of false positives.
From both Figures 6 and 7, by examining the av-
Figure 5: Training time in minutes of each of the experi-
ments.
Figure 6: Y error bars for all the runs of the 20 iterations
GAdaBoost on FDDB.
Figure 7: Y error bars for all the runs of the 50 iterations
GAdaBoost on FDDB.
erage point on the Y error bars it can be observed
that at 500 false positives the baseline true positive
rate is 64% and the GAdaBoost 20 and 50 iterations
achieved 58% 59% true positive rate respectively.
While at 1000 false positives the baseline achieved
GAdaBoost: Accelerating Adaboost Feature Selection with Genetic Algorithms
161
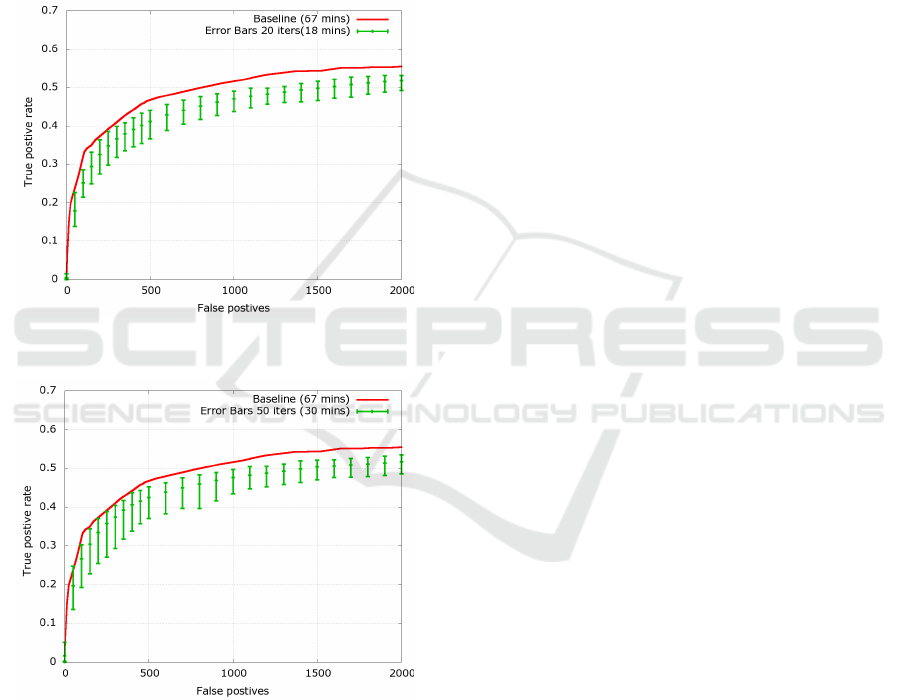
67% true positive rate versus about 64% and 65% for
the GA 20 and 50 iterations respectively. Collectively
from the provided figures, it can be noted that GAd-
aBoost with 50 iterations has performed slightly bet-
ter than the GAdaBoost with 20 iterations. It can also
be observed that at lower thresholds the GA provides
closer true positive rates compared with the baseline,
than it does at higher thresholds.
Figures 8 and 9 show the Y error bar graphs,
showing the maximum, minimum and average results,
for all the runs of both the 20 and the 50 iterations
GAdaBoost on Caltech Web Faces dataset.
Figure 8: Y error bars for all the runs of the 20 iterations
GAdaBoost on Caltech Web Faces.
Figure 9: Y error bars for all the runs of the 50 iterations
GAdaBoost on Caltech Web Faces.
From both Figures 8 and 9, by examining the av-
erage point on the Yerror bars we find that at 500 false
positives the baseline true positive rate is 46 % and the
GAdaboost 20 and 50 iterations achieved 41% , 43%
true positive rate respectively. While at 1000 false
positives the baseline achieved 51% true positive rate
versus about 47% and 48% for the GAdaBoost 20 and
50 iterations respectively. Collectively from the pro-
vided figures, it can be noted that GAdaboost with
50 iterations has performed slightly better than the
GAdaboost with 20 iterations. The decrease in per-
formance of both the baseline and GAdaboost can be
attributed to the fact that Caltech Web Faces dataset
includes occlusions and light variations as was men-
tioned at the beginning of this section.
5 CONCLUSIONS
We showed the effect of incorporating Genetic Algo-
rithms with the Viola-Jones Rapid object detector on
enhancing the training speed. Experiments to show
the progression of the best individual and the average
population fitness were provided. Other experiments
showed the speed up that can be gained by the re-
duction of the population size. Also, two variations
of the GAdaboost were examined, one with 20 iter-
ations and the other with 50 iterations. Both exper-
iments were run multiple times to observe the effect
of the number of iterations on the performance using
the FDDB and Caltech Web Faces dataset. We ex-
perienced that the training process became up to 3.7
times faster than the original algorithm with a mere
decrease of 3% to 4% in accuracy. We noted that the
50 iterations performed better than the 20 iterations,
and both had best case scenarios of almost reaching
the baseline accuracy at some thresholds.
The future extension of this contribution can be
done by experimenting with more GAdaboost param-
eters by varying the iteration numbers, or finding bet-
ter stopping criteria for the GA. The parallelizable na-
ture of the GA can be utilized to gain an even faster
training process.
REFERENCES
Angelova, A., Abu-Mostafa, Y., and Perona, P. (2005).
Pruning training sets for learning of object categories.
Proceedings of the IEEE Computer Society Confer-
ence on Computer Vision and Pattern Recognition,
1:494–501.
Chouaib, H., Terrades, O. R., Tabbone, S., Cloppet, F.,
and Vincent, N. (2008). Feature selection combin-
ing genetic algorithm and adaboost classifiers. In
Pattern Recognition, 2008. ICPR 2008. 19th Interna-
tional Conference on, pages 1–4.
Dezhen, Z. and Kai, Y. (2008). Genetic algorithm based
optimization for adaboost. In Computer Science and
Software Engineering, 2008 International Conference
on, volume 1, pages 1044–1047.
Dimashova, M. (2012). How is decision tree split quality
computed. http://answers.opencv.org/question/566/
how-is-decision-tree-split-quality-computed/.
ECTA 2016 - 8th International Conference on Evolutionary Computation Theory and Applications
162

Everingham, M., Gool, L. V., Williams, C. K. I., and Winn,
J. (2010). The P ASCAL Visual Object Classes ( VOC
) Challenge. International Journal, pages 303–338.
Fei-Fei, L., Fergus, R., and Perona, P. (2004). Learning
Generative Visual Models From Few Training Exam-
ples: An Incremental Bayesian Approach Tested on
101 Object Categories. In IEEE CVPR Workshop of
Generative Model Based Vision (WGMBV).
Ferri, F., Pudil, P., Hatef, M., and Kittler, J. (1994). Com-
parative study of techniques for large-scale feature se-
lection*. In GELSEMA, E. S. and KANAL, L. S.,
editors, Pattern Recognition in Practice IVMultiple
Paradigms, Comparative Studies and Hybrid Sys-
tems, volume 16 of Machine Intelligence and Pattern
Recognition, pages 403 – 413. North-Holland.
Freund, Y. and Schapire, R. (1995). A desicion-theoretic
generalization of on-line learning and an application
to boosting. Computational learning theory, 55:119–
139.
Itseez (2015). Open Source Computer Vision Library.
https://github.com/itseez/opencv.
Jain, V. and Learned-Miller, E. (2010). FDDB: A Bench-
mark for Face Detection in Unconstrained Settings.
Technical Report UM-CS-2010-009, University of
Massachusetts, Amherst.
Lienhart, R. and Maydt, J. (2002). An extended set of
Haar-like features for rapid object detection. Proceed-
ings. International Conference on Image Processing,
1:900–903.
Lillywhite, K., Lee, D. J., Tippetts, B., and Archibald, J.
(2013). A feature construction method for general ob-
ject recognition. Pattern Recognition, 46(12):3300–
3314.
Sun, Z., Bebis, G., and Miller, R. (2004). Object detection
using feature subset selection. Pattern Recognition,
37(11):2165–2176.
Tabassum, M. and Mathew, K. (2014). A Genetic Algo-
rithm Analysis towards Optimization solutions. Inter-
national Journal of Digital Information and Wireless
Communications (IJDIWC), 4(1):124–142.
Viola, P. and Jones, M. (2001). Rapid object detection using
a boosted cascade of simple features. Proceedings of
the 2001 IEEE Computer Society Conference on Com-
puter Vision and Pattern Recognition. CVPR 2001, 1.
Xue, B., Zhang, M., Member, S., and Browne, W. N.
(2015). A Survey on Evolutionary Computation Ap-
proaches to Feature Selection. 2007(September):1–
20.
GAdaBoost: Accelerating Adaboost Feature Selection with Genetic Algorithms
163
