
Classification and Regression of Music Lyrics:
Emotionally-Significant Features
Ricardo Malheiro
1,2
, Renato Panda
1
, Paulo Gomes
1
and Rui Pedro Paiva
1
1
Center for Informatics and Systems of the University of Coimbra (CISUC), Pólo II,
Pinhal de Marrocos 3030-290, Coimbra, Portugal
2
Miguel Torga Higher Institute, Largo Cruz de Celas 1, 3000-132, Coimbra, Portugal
Keywords: Music Information Retrieval, Lyrics Music Emotion Recognition, Lyrics Music Classification, Lyrics Music
Regression, Lyrics Feature Extraction.
Abstract: This research addresses the role of lyrics in the music emotion recognition process. Our approach is based
on several state of the art features complemented by novel stylistic, structural and semantic features. To
evaluate our approach, we created a ground truth dataset containing 180 song lyrics, according to Russell’s
emotion model. We conduct four types of experiments: regression and classification by quadrant, arousal
and valence categories. Comparing to the state of the art features (ngrams - baseline), adding other features,
including novel features, improved the F-measure from 68.2%, 79.6% and 84.2% to 77.1%, 86.3% and
89.2%, respectively for the three classification experiments. To study the relation between features and
emotions (quadrants) we performed experiments to identify the best features that allow to describe and
discriminate between arousal hemispheres and valence meridians. To further validate these experiments, we
built a validation set comprising 771 lyrics extracted from the AllMusic platform, having achieved 73.6% F-
measure in the classification by quadrants. Regarding regression, results show that, comparing to similar
studies for audio, we achieve a similar performance for arousal and a much better performance for valence.
1 INTRODUCTION
Music emotion recognition (MER) is gaining
significant attention in the Music Information
Retrieval (MIR) scientific community. In fact, the
search of music through emotions is one of the main
criteria utilized by users (Vignoli, 2004).
Real-world music databases from sites like
AllMusic or Last.fm grow larger and larger on a
daily basis, which requires a tremendous amount of
manual work for keeping them updated.
Unfortunately, manually annotating music with
emotion tags is normally a subjective process and an
expensive and time-consuming task. This should be
overcome with the use of automatic recognition
systems (Hu and Downie, 2010).
Most of the early-stage automatic MER systems
were based on audio content analysis (e.g., (Lu et
al., 2006)). Later on, researchers started combining
audio and lyrics, leading to bi-modal MER systems
with improved accuracy (e.g., (Hu and Downie,
2010), (Hu et al., 2009), (Laurier et al., 2008)). This
does not come as a surprise since it is evident that
the importance of each dimension (audio or lyrics)
depends on music style. For example, in dance
music audio is the most relevant dimension, while in
poetic music (like Jacques Brel) lyrics are key.
Several psychological studies confirm the
importance of lyrics to convey semantical
information. Namely, according to Juslin and
Laukka (2004), 29% of people mention that lyrics
are an important factor of how music expresses
emotions. Also, Besson et al. (1998) have shown
that part of the semantic information of songs
resides exclusively in the lyrics.
Despite the recognized importance of lyrics,
current research in Lyrics-based MER (LMER) is
facing the so-called glass-ceiling (Downie, 2008)
effect (which also happened in audio). In our view,
this ceiling can be broken with recourse to dedicated
emotion-related lyrical features. In fact, so far most
of the employed features are directly imported from
general text mining tasks, e.g., bag-of-words (BOW)
and part-of-speech (POS) tags, and, thus, are not
specialized to the emotion recognition context.
Namely, these state-of-the-art features do not
Malheiro, R., Panda, R., Gomes, P. and Paiva, R.
Classification and Regression of Music Lyrics: Emotionally-Significant Features.
DOI: 10.5220/0006037400450055
In Proceedings of the 8th International Joint Conference on Knowledge Discovery, Knowledge Engineering and Knowledge Management (IC3K 2016) - Volume 1: KDIR, pages 45-55
ISBN: 978-989-758-203-5
Copyright
c
2016 by SCITEPRESS – Science and Technology Publications, Lda. All rights reserved
45

account for specific text emotion attributes, e.g.,
how formal or informal the text language is, how the
lyric is structured and so forth.
To fill this gap we propose novel features,
namely:
Slang presence, which counts the number of
slang words from a dictionary of 17700
words;
Structural analysis features, e.g., the number
of repetitions of the title and chorus, the
relative position of verses and chorus in the
lyric;
Semantic features, e.g., gazetteers
personalized to the employed emotion
categories.
Additionally, we create a new, manually
annotated, (partially) public dataset to validate the
proposed features. This might be relevant for future
system benchmarking, since none of the current
datasets in the literature is public (e.g., (Laurier et
al., 2008)). Moreover, to the best of our knowledge,
there are no emotion lyrics datasets in the English
language that are annotated with continuous arousal
and valence values.
The paper is organized as follows. In section 2,
the related work is described and discussed. Section
3 presents the methods employed in this work,
particularly the proposed features and ground truth.
The results attained by our system are presented and
discussed in Section 4. Finally, section 5
summarizes the main conclusions of this work and
possible directions for future research.
2 RELATED WORK
The relations between emotions and music have
been a subject of active research in music
psychology for many years. Different emotion
paradigms (e.g., categorical or dimensional) and
taxonomies (e.g., Hevner, Russell) have been
defined (Hevner, 1936), (Russell, 1980) and
exploited in different computational MER systems.
Identification of musical emotions from lyrics is
still in an embryonic stage. Most of the previous
studies related to this subject used general text
instead of lyrics, polarity detection instead of
emotion detection. More recently, LMER has gained
significant attention by the MIR scientific
community.
Feature extraction is one of the key stages of the
LMER process. Previous works employing lyrics as
a dimension for MER typically resort to content-
based features (CBF) like Bag-Of-Words (BOW)
(Laurier et al., 2008), (Yang et al., 2008), (Hu et al.,
2009) with possible transformations like stemming
and stopwords removal. Other regularly used CBFs
are Part-Of-Speech (POS) followed by BOW (Hu et
al., 2009). Additionally, linguistic and text stylistic
features (Hu and Downie, 2010), are also employed.
Despite the relevance of such features and their
possibility of use in general contexts, we believe
they do not capture several aspects that are specific
of emotion recognition in lyrics. Therefore, we
propose new features, as will be described in Section
3.
As for ground truth construction, different
authors typically construct their own datasets,
annotating the datasets either manually (e.g., (Yang
et al., 2008)), or acquiring annotated data from sites
such as AllMusic or Last.fm (e.g., (Hu et al., 2009),
(Zaanen and Kanters, 2010)).
As for systems based on manual annotations, it is
difficult to compare them, since they all use different
emotion taxonomies and datasets. Moreover, the
employed datasets are not public. As for automatic
approaches, frameworks like AllMusic or Last.fm
are often employed. However, the quality of these
annotations might be questionable because, for
example in Last.fm, the tags are assigned by online
users, which in some cases may cause ambiguity. In
AllMusic, despite the fact that the annotations are
made by experts (Yang and Lee, 2009), it is not
clear whether they are annotating songs using only
audio, lyrics or a combination of both.
Due to the limitations of the annotations in
approaches like AllMusic and Last.fm and the fact
that the datasets proposed by other researchers are
not public, we decided to construct a manually
annotated dataset. Our goal is to study the
importance of each feature to the lyrics in a context
of emotion recognition. So, the annotators have been
told explicitly to ignore the audio during the
annotations to measure the impact of the lyrics in the
emotions. In the same way some researchers of the
audio’s area ask annotators to ignore lyrics, when
they want to evaluate models focused on audio (Hu
et al., 2007). In the future we intend to fuse both
dimensions and make a bimodal analysis.
Additionally, to facilitate future benchmarking, the
constructed dataset will be made partially public
(http://mir.dei.uc.pt/resources/MER_lyrics_dataset.z
ip), i.e., we provide the names of the artists and the
song titles, as well as valence and arousal values, but
we not give the song lyrics, due to copyright issues;
instead we provide the URLs from where each lyric
was retrieved.
KDIR 2016 - 8th International Conference on Knowledge Discovery and Information Retrieval
46
3 METHODS
3.1 Dataset Construction
As abovementioned, current MER systems either
follow the categorical or the dimensional emotion
paradigm. It is often argued that dimensional
paradigms lead to lower ambiguity, since instead of
having a discrete set of emotion adjectives, emotions
are regarded as a continuum (Yang et al., 2008). One
of the most well-known dimensional models is
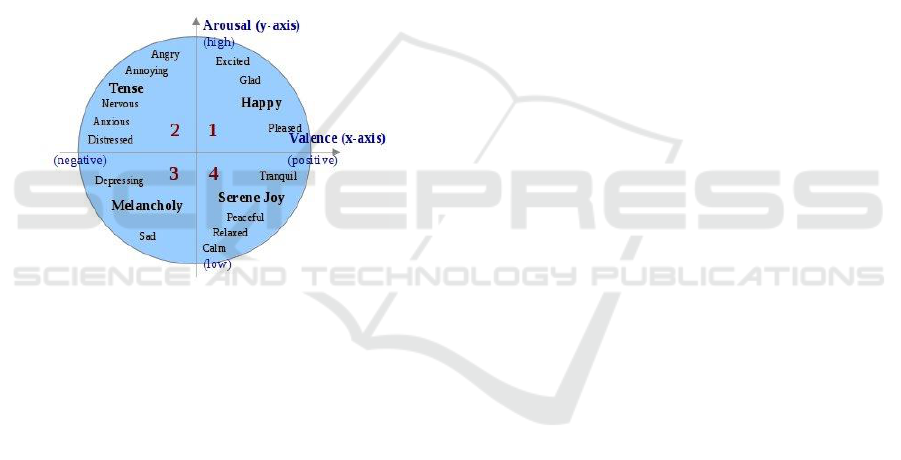
Russell’s circumplex model (Russell, 1980), where
emotions are positioned in a two-dimensional plane
comprising two axes, designated as valence and
arousal, as illustrated in Figure 1. According to
Russell (2003), valence and arousal are the “core
processes” of affect, forming the raw material or
primitive of emotional experience
Figure 1: Russell’s circumplex model (adapted from
(Yang et al., 2008)).
3.1.1 Data Collection
To construct our ground truth, we started by
collecting 200 song lyrics. The criteria for selecting
the songs were the following:
Several musical genres and eras (see Table 1);
Songs distributed uniformly by the 4 quadrants
of the Russell emotion model;
Each song belonging predominantly to one of
the 4 quadrants in the Russell plane.
To this end, before performing the annotation
study described in the next section, the songs were
pre-annotated by our team and were nearly balanced
across quadrants.
Next, we used the Google API to search for the
song lyrics. In this process, three sites were used for
lyrical information: lyrics.com, ChartLyrics and
MaxiLyrics.
The obtained lyrics were then pre-processed to
improve their quality. Namely, we performed the
following tasks:
Correction of orthographic errors;
Elimination of songs with non-English lyrics;
Elimination of songs with lyrics with less than
100 characters;
Elimination of text not related with the lyric
(e.g., names of the artists, composers,
instruments).
Elimination of common patterns in lyrics such
as [Chorus x2], [Vers1 x2], etc.;
Complementation of the lyric according to the
corresponding audio (e.g., chorus repetitions in
the audio are added to the lyrics).
To further validate our system, we have also
built a larger validation set. This dataset was built in
the following way:
1. First, we mapped the mood tags from AllMusic
into the words from the ANEW dictionary
(ANEW has 1034 words with values for
arousal (A) and valence (V)). Depending on the
values of A and V, we can associate each word
to a single Russell's quadrant. So, from that
mapping, we obtained 33 words for quadrant 1
(e.g., fun, happy, triumphant), 29 words for
quadrant 2 (e.g., tense, nervous, hostile), 12
words for quadrant 3 (e.g., lonely, sad, dark)
and 18 words for quadrant 4 (e.g., relaxed,
gentle, quiet).
2. Then, we considered that a song belongs to a
specific quadrant if all of the corresponding
AllMusic tags belong to this quadrant. Based
on this requirement, we initially extracted 400
lyrics from each quadrant (the ones with a
higher number of emotion tags), using the
AllMusic's web service.
3. Next, we developed tools to automatically
search for the lyrics files of the previous songs.
We used 3 sites: Lyrics.com, ChartLyrics and
MaxiLyrics.
4. Finally, this initial set was validated by three
people. Here, we followed the same procedure
employed by Laurier (2008): a song is
validated into a specific quadrant if at least one
of the annotators agreed with AllMusic's
annotation (Last.FM in his case). This resulted
into a dataset with 771 lyrics (211 for Q1, 205
for Q2, 205 for Q3, 150 for Q4). Even though
the number of lyrics in Q4 is smaller, the
dataset is still nearly balanced.
3.1.2 Annotations and Validation
The annotation of the dataset was performed by 39
people with different backgrounds. To better
Classification and Regression of Music Lyrics: Emotionally-Significant Features
47
understand their background, we delivered a
questionnaire, which was answered by 62% of the
volunteers. 24% of the annotators who answered the
questionnaire have musical training and, regarding
their education level, 35% have a BSc degree, 43%
have an MSc, 18% a PhD and 4% have no higher-
education degree. Regarding gender balance, 60%
were male and 40% were female subjects.
During the process, we recommended the
following annotation methodology:
1. Read the lyric;
2. Identify the basic predominant emotion
expressed by the lyric (if the user thought that
there was more than one emotion, he/she
should pick the predominant);
3. Assign values (between -4 and 4) to valence
and arousal; the granularity of the annotation is
the unit, which means that annotators could use
9 possible values to annotate the lyrics, from -4
to 4;
4. Fine tune the values assigned in 3) through
ranking of the samples.
To further improve the quality of the annotations,
the users were also recommended not to search for
information about the lyric neither the song on the
Internet or another place and to avoid tiredness by
taking a break and continuing later.
We obtained an average of 8 annotations per
lyric. Then, the arousal and valence of each song
were obtained by the average of the annotations of
all the subjects. In this case we considered the
average trimmed by 10% to reduce the effect of
outliers.
To improve the consistency of the ground truth,
the standard deviation (SD) of the annotations made
by different subjects for the same song was
evaluated. Songs with an SD above 1.2 were
excluded from the original set. As a result, 20 songs
were discarded, leading to a final dataset containing
180 lyrics. This leads to a 95% confidence interval
(Montgomery et al., 1998) of about ±0.4. We believe
this is acceptable in our -4.0 to 4.0 annotation range.
Finally the consistency of the ground truth was
evaluated using Krippendorff’s alpha (Krippendorff,
2004), a measure of inter-coder agreement. This
measure achieved, in the range -4 up to 4, 0.87 and
0.82 respectively for the dimensions valence and
arousal. This is considered a strong agreement
among the annotators.
One important issue to consider is how familiar
are the lyrics to the listeners. 13% of the respondents
reported that they were familiar with 12% of the
lyrics (on average). Nevertheless, it seems that the
annotation process was sufficiently robust regarding
the familiarity issue, since there was an average of 8
annotations per lyric and the annotation agreement
(Krippendorff’s alpha) was very high (as discussed
in the following chapters). This suggests that the
results were not skewed.
Although the size of the dataset is not large, we
think that is acceptable for experiments and is
similar to other datasets manually annotated (e.g.,
(Yang et al., 2008) has 195 songs).
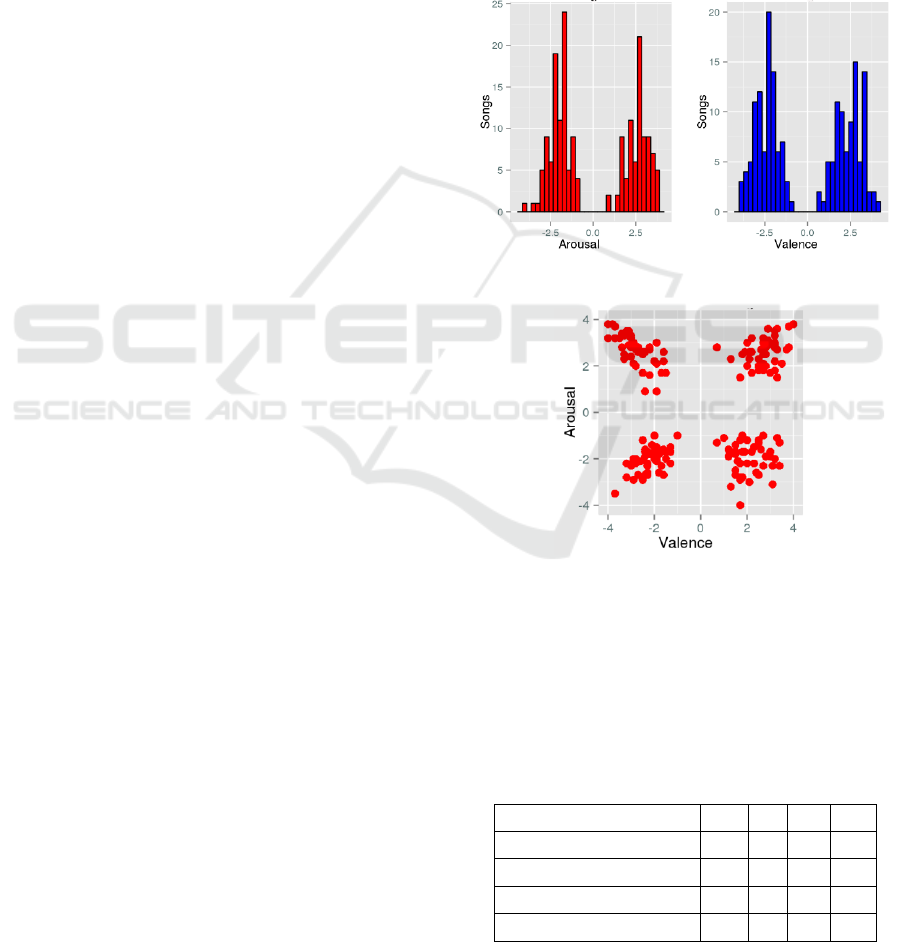
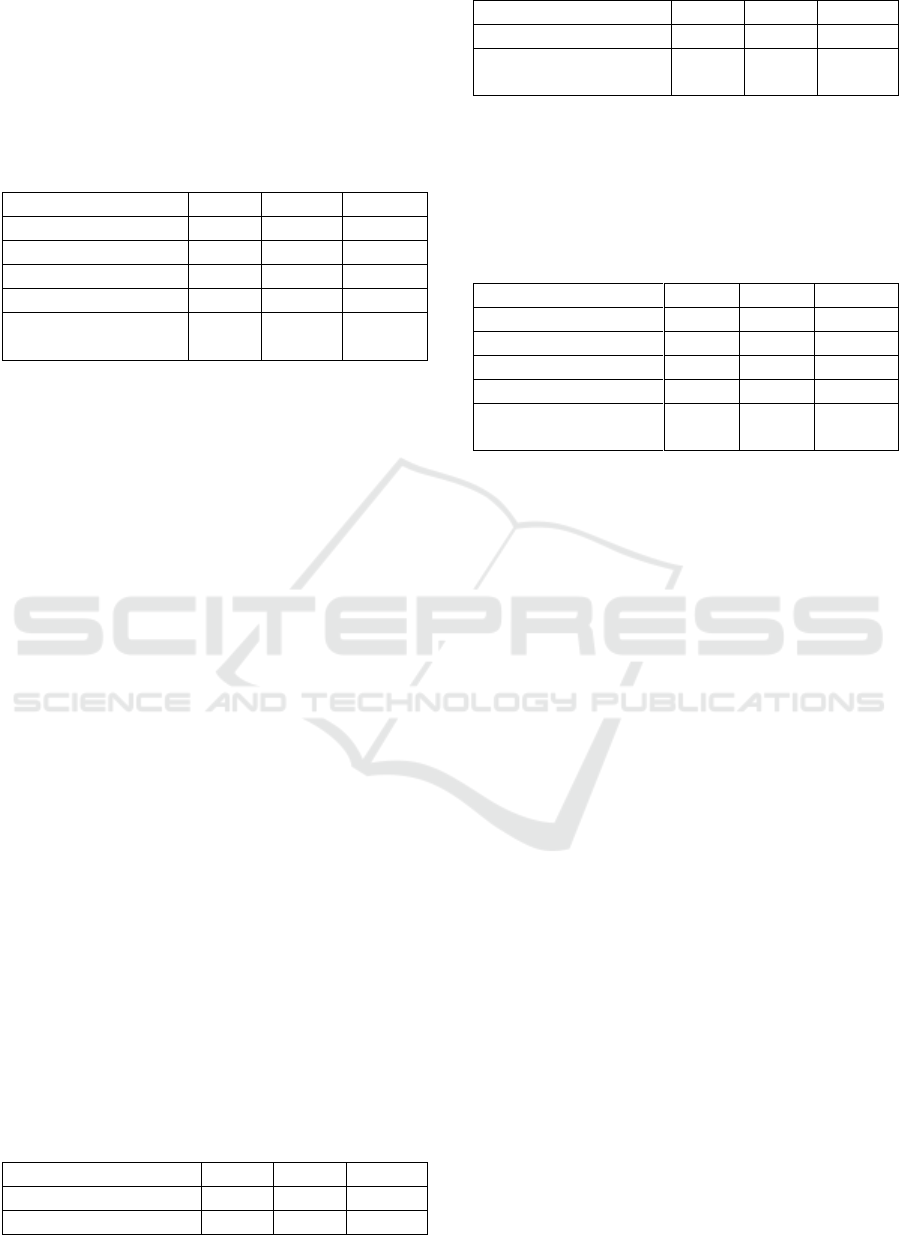
Figures 2 and 3 show the histogram for arousal
and valence dimensions as well as the distribution of
the 180 selected songs for the 4 quadrants.
Figure 2: Arousal and Valence histogram values.
Figure 3: Distribution of the songs for the 4 quadrants.
Finally, the distribution of lyrics across
quadrants and genres is presented in Table 1. We
can see that, except for quadrant 2 where almost half
of the songs belong to the heavy metal genre, the
other quadrants span several genres.
Table 1: Distribution of lyrics across quadrants and
genres.
Genre
Q1
Q2
Q3
Q4
Pop/Rock
6
1
15
11
Rock
5
13
13
1
Heavy-metal
0
20
1
0
Pop
1
0
10
6
KDIR 2016 - 8th International Conference on Knowledge Discovery and Information Retrieval
48

Table 1: Distribution of lyrics across quadrants and genres
(Cont.).
Jazz
2
0
3
11
R&B
12
0
4
0
Dance
16
0
0
0
New-age
0
0
1
14
Hip-hop
0
7
0
0
Country
1
0
4
1
Reggae
1
0
0
0
Total by Quadrant
44
41
51
44
3.1.3 Emotion Categories
Finally, each song is labelled as belonging to one of
the four possible quadrants, as well as the respective
arousal hemisphere (north or south) and valence
meridian (east or west). In this work, we evaluate
the classification capabilities of our system in the
three described problems.
According to quadrants, the songs are distributed
in the following way: quadrant 1 – 44 lyrics;
quadrant 2 – 41 lyrics; quadrant 3 – 51 lyrics;
quadrant 4 – 44 lyrics (see Table 1).
As for arousal hemispheres, we ended up with 85
lyrics with positive arousal and 95 with negative
arousal.
Regarding valence meridian we have 88 lyrics
with positive valence positive and 92 with negative
valence.
3.1.4 Emotion Categories
To further validate our system, we have also built a
larger validation set. This dataset was built in the
following way:
1. First, we mapped the mood tags from AllMusic
into the words from the ANEW (Affective
Norms for English Words) dictionary
(Bradley and Lang, 1999) (ANEW has 1034
words with values for arousal (A) and
valence (V)). Depending on the values of A
and V, we can associate each word to a
single Russell's quadrant. So, from that
mapping, we obtained 33 words for quadrant
1 (e.g., fun, happy, triumphant), 29 words for
quadrant 2 (e.g., tense, nervous, hostile), 12
words for quadrant 3 (e.g., lonely, sad, dark)
and 18 words for quadrant 4 (e.g., relaxed,
gentle, quiet).
2. Then, we considered that a song belongs to a
specific quadrant if all of the corresponding
AllMusic tags belong to this quadrant. Based
on this requirement, we initially extracted
400 lyrics from each quadrant (the ones with
a higher number of emotion tags), using the
AllMusic's web service.
3. Next, used again the Google API to search for
the song lyrics (using the same three sites).
4. Finally, this initial set was validated by three
people. Here, we followed the same
procedure employed by Laurier [5]: a song is
validated into a specific quadrant if at least
one of the annotators agreed with AllMusic's
annotation (Last.FM in his case). This
resulted into a dataset with 771 lyrics (211
for Q1, 205 for Q2, 205 for Q3, 150 for Q4).
Even though the number of lyrics in Q4 is
smaller, the dataset is still nearly balanced.
3.2 Feature Extraction
3.2.1 Content-based Features (CBF)
The most commonly used features in text analysis,
as well as in lyric analysis, are content-based
features (CBF), namely the bag-of-words (BOW)
(Sebastiani, 2002).
In this model, the text in question is represented
as a set of bags which normally correspond, in most
cases, to unigrams, bigrams or trigrams. The BOW
are normally associated to a set of transformations
which are applied immediately after the tokenization
of the original text, e.g., stemming and stopwords
removal.
Part-of-speech (POS) tags are another type of
state-of-art features. They consist in attributing a
corresponding grammatical class to each word. The
POS tagging is typically followed by a BOW
analysis. This technique was used in studies such as
(Mayer et al., 2008).
In our research we use all the combinations of
unigrams, bigrams and trigrams with the
aforementioned transformations. We also use n-
grams of POS tags from bigram to 5-grams.
3.2.2 Stylistic-based Features (StyBF)
These features are related to stylistic aspects of the
language. One of the issues related to the written
style is the choice of the type of the words to convey
a certain idea (or emotion, in our study). Concerning
music, those issues can be related to the style of the
composer, the musical genre or the emotions that we
intend to convey.
We use 36 features representing the number of
occurrences of 36 different grammatical classes in
the lyrics. We use the POS tags in the Penn
Classification and Regression of Music Lyrics: Emotionally-Significant Features
49

Treebank Project (Taylor et al., 2003) such as for
instance JJ (adjectives), NNS (noun plural), RB
(adverb), UH (interjection), VB (verb). Some of
these features are also used by authors like (Hu et
al., 2009).
We use two features related to the use of capital
letters: All Capital Letters (ACL), which represents
the number of words with all letters in uppercase and
First Capital Letter (FCL), which represents the
number of words initialized by an uppercase letter.
Finally, we propose a new feature: the number of
occurrences of slang words (abbreviated as #slang).
These slang words (17700 words) are taken from the
Online Slang Dictionary (American, English and
Urban Slang).
3.2.3 Song-Structure-based Features
(StruBF)
To the best of our knowledge, no previous work on
LMER employs features related to the structure of
the lyric. However, we believe this type of features
is relevant for LMER. Hence, we propose a few
novel features of this kind, namely:
1) #chorus, which stands for the number of times
the chorus is repeated in the lyric; 2) #title, which is
the number of times the title appears in the lyric; 3)
7 features based on the lyrical structure in verses (V)
and chorus (C): i) #VorC (total of sections - verses
and chorus - in the lyrics); ii) #V (number of verses);
iii) C... (the lyric starts with chorus – boolean); iv)
#V/Total (relation between Vs and the total of
sections); v) #C/Total (relation between C and the
total of sections); vi) >2CAtTheEnd (lyric ends with
at least two repetitions of the chorus – boolean); vii)
alternation between versus and chorus, e.g., VCVC
(verses and chorus are alternated), VCCVCC...
(between 2 verses we have at least 1 chorus),
VVCVC (between 2 chorus we have at least 1 verse).
3.2.4 Semantic-Based Features (SemBF)
These features are related to semantic aspects of the
lyrics. In this case, we used features based on
existing frameworks like Synesketch (8 features),
ConceptNet (8 features), LIWC (82 features) and GI
(182 features).
In addition to the previous frameworks, we use
features based on known dictionaries: DAL
(Whissell, 1989) and ANEW (Bradley and Lang,
1999). DAL stands for Dictionary of Affect in
Language and is composed by 8743 words annotated
in 3 dimensions: pleasantness, activation and
imagery. We extract 3 features which are the
average in lyrics of the 3 prior dimensions. ANEW
stands for Affective Norms for English Words and is
composed by 1034 words annotated in 3 dimensions:
valence, arousal and dominance. We extract 3
features which are the average in lyrics of the 3 prior
dimensions.
Additionally, we propose 14 new features based
on gazetteers, which represent the 4 quadrants of the
Russell emotion model. We constructed the
gazetteers according to the following procedure:
1. We define as seed words the 18 emotion terms
defined in Russell’s plane (see figure 1 in the
article).
2. From the 18 terms, we consider for the
gazetteers only the ones present in the DAL or
the ANEW dictionaries. In DAL, we assume
that pleasantness corresponds to valence, and
activation to arousal, based on (Fontaine et al.,
2013). We employ the scale defined in DAL:
arousal and valence (AV) values from 1 to 3. If
the words are not in the DAL dictionary but are
present in ANEW, we still consider the words
and convert the arousal and valence values
from the ANEW scale to the DAL scale.
3. We then extend the seed words through
Wordnet Affect (Strapparava and Valitutti,
2004), where we collect the emotional
synonyms of the seed words (e.g., some
synonyms of joy are exuberance, happiness,
bonheur and gladness). The process of
assigning the AV values from DAL (or
ANEW) to these new words is performed as
described in step 2.
4. Finally, we search for synonyms of the
gazetteer’s current words in Wordnet and we
repeat the process described in step 2.
Before the insertion of any word in the gazetteer
(from step 1 on), each new proposed word is
validated or not by two persons, according to its
emotional value. There should be unanimity between
the two annotators. The two persons involved in the
validation were not linguistic scholars but were
sufficiently knowledgeable for the task.
Overall, the resulting gazetteers comprised 132,
214, 78 and 93 words respectively for the quadrants
1, 2, 3 and 4.
The features extracted are: VinGAZQ1,
AinGAZQ1, VinGAZQ2, AinGAZQ2, VinGAZQ3,
AinGAZQ3, VinGAZQ4, AinGAZQ4, #GAZQ1,
#GAZQ2, #GAZQ3, #GAZQ4, VinGAZQ1Q2Q3Q4,
AinGAZQ1Q2Q3Q4. The names are exemplary, for
example VinGAZQ1 returns the average valence of
the words present in the lyrics that are also present
in the gazetteer of the quadrant 1.
KDIR 2016 - 8th International Conference on Knowledge Discovery and Information Retrieval
50

3.2.5 Feature Grouping
The proposed features are organized into four
different feature sets:
CBF. We define 10 feature sets of this type: 6
are BOW (1-gram up to 3-grams) after tokenization
with and without stemming (st) and stopwords
removal (sw); 4 are BOW (2-grams up to 5-grams)
after the application of a POS tagger without st and
sw. These BOW features are used as the baseline,
since they are a reference in most studies (Hu and
Downie, 2010).
StyBF. We define 2 feature sets: the first
corresponds to the number of occurrences of POS
tags in the lyrics after the application of a POS
tagger (a total of 36 different grammatical classes or
tags); the second contains only novel features and
represents the number of slang words (#Slang) and
the features related to words in capital letters (ACL
and FCL).
StruBF. We define one feature set with all the
structural features. This feature set contains only
novel features.
SemBF. We define 4 feature sets: the first with
the features from Synesketch and ConceptNet; the
second with the features from LIWC; the third with
the features from GI; and the last (containing novel
features) with the features from gazetteers, DAL and
ANEW.
We use the term frequency and the term
frequency inverse document frequency (TFIDF) as
representation values in the datasets.
3.3 Classification and Regression
For classification and regression, we use Support
Vector Machines (SVM) (Boser et al., 1992), since,
based on previous evaluations, this technique
performed generally better than other methods. A
polynomial kernel was employed and a grid
parameter search was performed to tune the
parameters of the algorithm. Feature selection and
ranking with the ReliefF algorithm (Robnik-Šikonja
and Kononenko, 2003) were also performed in each
feature set, in order to reduce the number of features.
In addition, for the best features in each model, we
analysed the resulting feature probability density
functions (pdf) to validate the feature selection that
resulted from ReliefF, as described below.
For both classification and regression, results
were validated with repeated stratified 10-fold cross
validation (Duda et al., 2000) (with 20 repetitions)
and the average obtained performance is reported.
4 RESULTS AND DISCUSSION
4.1 Regression Analysis
The regressors for arousal and valence were applied
using the feature sets for the different types of
features (e.g., SemBF). Then, after feature selection,
ranking and reduction with the ReliefF algorithm,
we created regressors for the combinations of the
best feature sets.
To evaluate the performance of the regressors the
coefficient of determination (Montgomery et al.,
1998) was computed separately for each dimension
(arousal and valence). This is a statistic that gives
information about the goodness of fit of a model.
The results were 0.61 (with 234 features) for arousal
and 0.64 (with 340 features) for valence. The best
results were achieved always with RBFKernel
(Keerthi and Lin, 2003).
Yang et al., (2008) made an analogous study
using a dataset with 195 songs (using only the
audio). He achieved a score of 0.58 for arousal and
0.28 for valence. We can see that we obtained
almost the same results for arousal (0.61 vs 0.58)
and much better results for valence (0.64 vs 0.28).
Although direct comparison is not possible, these
results suggest that lyrics analysis is likely to
improve audio-only valence estimation. Thus, in the
near future, we will evaluate a bi-modal analysis
using both audio and lyrics.
In addition, we used the obtained arousal and
valence regressors to perform regression-based
classification (discussed below).
4.2 Classification Analysis
We conduct three types of experiments for each of
the defined feature sets: i) classification by quadrant
categories; ii) classification by arousal hemispheres;
iii) and classification by valence meridians.
4.2.1 Classification by Quadrant Emotion
Categories
Table 2 shows the results of the combination of the
best models for each of the features categories. For
example C1Q is the combination of the CBF’s best
models, i.e., initially, for this category, we have 10
different models (see section 3.2.5). After feature
selection and reduction, the models are combined
(only the selected features) and the result is C1Q.
Then C1Q has 900 features and after feature
selection we got a result of 68.2% for F-Measure.
The classification process is analogous for the other
Classification and Regression of Music Lyrics: Emotionally-Significant Features
51
categories. In the table, #Feat represents the total of
features used in the model, Selected Features
(SelFeat) is the number of selected features and FM
(%) represents the results accomplished via the F-
measure metric.
Table 2: Classification by Quadrants: Combination of the
best models by categories.
Model ID
#Feat
SelFeat
FM (%)
C1Q (CBF)
900
812
68.2
C2Q (StyBF)
23
20
50.4
C3Q (StruBF)
11
11
33.8
C4Q (SemBF)
163
39
72.2
Mixed
C1Q+C2Q+C3Q+C4Q
1006
609
77.1
As we can see, the combination of the best
models of BOW (baseline) keep the results close to
70% (model C1Q) with a high number of features
selected (812). The results of the SemBF (C4Q) are
significantly better since we obtain a better
performance (72.20%) with much less features (39).
Finally the mixed classifier (77.1%) is significantly
better than the best classifiers by type of feature:
C1Q, C2Q, C3Q and C4Q (at p < 0.05). As for
statistical significance we use the Wilcoxon rank-
sum test.
Additionally, we performed regression-based
classification based on the above regression analysis.
An F-measure of 76.1% was achieved, which is
close to the quadrant-based classification (77.1%).
Hence, training only two regressor models could be
applied to both regression and classification
problems with reasonable accuracy.
Finally, we trained the 180-lyrics dataset using
the mixed C1Q+C2Q+C3Q+C4Q features, and
validated the resulting model using the new large
dataset (comprising 771 lyrics). We obtained 73.6%
F-measure, which shows that our model, trained in
the 180-lyrics dataset, generalizes reasonably well.
4.2.2 Classification by Arousal Hemispheres
Table 3 shows the combination of the best models
by Arousal Hemispheres (2 classes – AN, AP)
feature sets and the combination of the combinations
respectively.
Table 3: Classification by Arousal Hemispheres:
Combination of the best models by categories.
Model ID
#Feat
SelFeat
FM (%)
C1A (CBF)
1690
1098
79.6
C2A (StyBF)
26
26
75.5
C3A (StruBF)
8
8
67.8
C4A (SemBF)
163
39
81.1
Mixed
C1A+C2A+C3A+C4A
1196
377
86.3
4.2.3 Classification by Valence Meridians
Table 4 shows the combinations by feature sets and
the combination of the combinations respectively.
Table 4: Classification by Valence Meridians:
Combination of the best models by categories.
Model ID
#Feat
SelFeat
FM (%)
C1V (CBF)
1095
750
84.2
C2V (StyBF)
14
11
72.2
C3V (StruBF)
4
4
56.4
C4V (SemBF)
39
6
85.9
Mixed
C1V+C2V+C3V+C4V
771
594
89.2
In comparison to the previous studies (quadrants and
arousal), these results are better in general. We can
see this in the BOW experiments (baseline-84.2%)
where we achieved a performance close to the best
combination (C4V). The best results are also in
general achieved with less features as we can see in
C3V and C4V.
The mixed classifier (89.2%) is significantly
better than the best classifiers by type of feature:
C1V, C2V, C3V and C4V (at p < 0.05).
4.3 New Features: Comparison to
Baseline
Considering CBF as the baseline in this area, we
thought it would be important to assess the
performance of the models created when we add to
the baseline the new proposed features. The new
proposed features are contained in three categories:
StyBF (feature set M22), StruBF (feature set M31) e
SemBF (feature set M42). Next, we created new
models adding to C1* each one of the previous
feature sets in the following way: C1*+M22;
C1*+M31; C1*+M42; C1*+M22+M31+M42. In
C1*, ‘C1’ denotes a feature set that contains the
combination of the best Content-Based Features –
baseline and ‘1’ denotes CBF, as mentioned above;
“*” denotes expansion notation, indicating the
different experiments conducted: Q denotes
classification by quadrants, A by arousal
hemispheres and V by valence meridians. These
models were created for each of the 3 classification
problems seen in the previous section: Classification
by quadrants (see Table 5); classification by arousal
KDIR 2016 - 8th International Conference on Knowledge Discovery and Information Retrieval
52
(see Table 6); classification by valence (see Table
7).
Table 5: Classification by quadrants (baseline + new
features).
Model ID
Selected
Features
F-measure
(%)
C1Q+M22
384
68.9
C1Q+M31
466
68.4
C1Q+M42
576
74.5
C1Q+M22+M31+M42
388
79.8
The baseline model (C1Q) alone reached 68.2%
with 812 features selected (Table 2). We improve
the results with all the combinations but only the
models C1Q+M42 (74.5%) and C1Q+M22+M31+
M42 (79.8%) are significantly better than the
baseline model (at p < 0.05). However the model
C1Q+M22+M31+M42 is significantly better (at p <
0.05) than the model C1Q+M42. This shows that the
inclusion of StruBF and StyBF have improved
overall results.
Table 6: Classification by arousal (baseline + new
features).
Model ID
Selected
Features
F-measure
(%)
C1A+M22
652
80.6
C1A+M31
373
80.4
C1A+M42
690
83.3
C1A+M22+M31+M42
1307
83.3
The baseline model (C1A) alone reached an F-
measure of 79.6% with 1098 features selected
(Table 3). We improve the results with all the
combinations but only the models C1A+M42 and
C1A+M22+M31+M42 are significantly better than
the baseline model (at p < 0.05). This shows the
importance of the semantic features.
Table 7: Classification by valence (baseline + new
features).
Model ID
Selected
Features
F-measure
(%)
C1V+M22
679
83.7
C1V+M31
659
82.8
C1V+M42
493
85.8
C1V+M22+M31+M42
88
86.5
The baseline model (C1V) alone reached an F-
measure of 84.2% with 750 features selected (Table
4). The models C1V+M42 and C1V+M22+M31+
M42 are significantly better than the baseline model
(at p < 0.05), however C1V+M22+M31+M42 is not
significantly better than C1V+M42. This suggests
the importance of the SemBF for this task in
comparison to the other new features.
In general, the new StyBF and StruBF are not
good enough to improve significantly the baseline
score, however we got the same results with much
less features: for classification by quadrants we
decrease the number of features of the model from
812 (baseline) to 384 (StyBF) and 466 (StruBF). The
same happens for arousal classification (1098
features - baseline to 652 - StyBF and 373 – StruBF)
and for valence classification (750 features –
baseline to 679 – StyBF and 659 – StruBF).
However, the model with all the features is
always better (except for arousal classification) than
the model with only baseline and SemBF. This
shows a relative importance of the novel StyBF and
StruBF. It is important to highlight that M22 has
only 3 features and M31 has 12 features.
The new SemBF (model M42) seems important
because it can improve clearly the score of the
baseline. Particularly in the last problem
(classification by valence) it requires a much less
number of features (750 down to 88).
4.4 Arousal and Valence: Most
Discriminating Features
We determined in section 4.2 the classification
models with best performance for the several
classification problems. These models were built
through the interaction of a set of features (from the
total of features after feature selection). Some of
these features are possibly strong to predict a class
when they are alone but others are strong only when
combined with other features.
1Our purpose in this section is to identify the
most important features, when they act alone, for the
description and discrimination of the following
problem’s classes.
Arousal description – classes AN and AP
Valence description – classes VN and VP
In both situations we identify the 5 features that,
after analysis, seem the best features. This analysis
starts from the rankings (top 20) of the best features
extracted from the models of section 4.2, with
ReliefF. Next, to validate ReliefF’s ranking, we
compute for each feature the probability density
functions (pdf) (Montgomery et al., 1998) for each
of the classes of the previous problems. The smaller
the intersection of the curves for the classes, the
more discriminating is the feature. Table 8 shows the
Classification and Regression of Music Lyrics: Emotionally-Significant Features
53
best features for arousal discrimination.
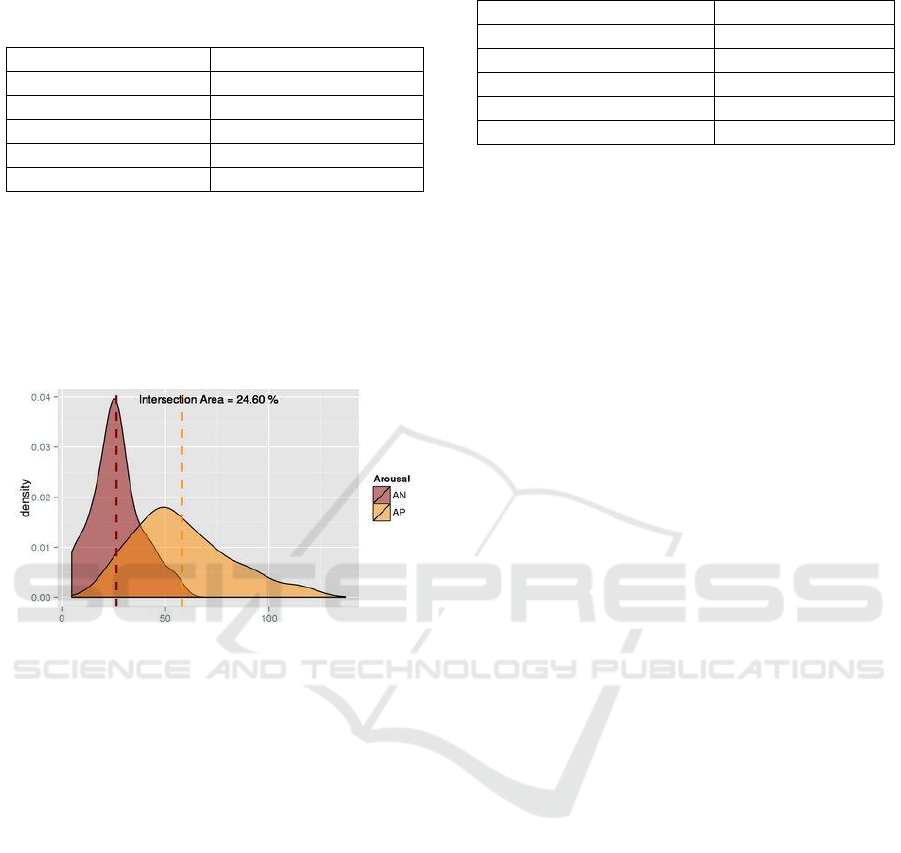
Table 8: Best features for arousal description.
Feature
Intersection Area
FCL (StyBF)
24.6%
#Slang (StyBF)
29%
active (SemBF)
33.1%
vb (StyBF)
34.2%
#Title (StruBF)
37.4%
As we can see, the two best features to
discriminate between arousal hemispheres are novel
features. FCL represents the number of words
started by a capital letter and it describes better the
class AP than the class AN, i.e., lyrics with FCL
greater than a specific value correspond normally to
lyrics from the class AP
Figure 4: PDFs for the feature FCL for the problem of
Arousal description.
For low values there is a mix between the 2
classes (Figure 4). The other 4 features: #Slang
(number of slang words – novel feature); #Title
(number of repetitions of the title into the lyric –
novel feature); active (words with active orientation
– feature from GI); vb (number of verbs in the base
form) have the same pattern of behaviour.
The best features for valence discrimination are
shown in Table 9.
The best features and not only the 5 shown into
the table, are essentially semantic features. The
feature VinDAL (novel feature) can describe both
classes: lower values are more associated to the class
VN and higher values to the class VP. The features
VinGAZQ1Q2Q3Q4 (novel feature), negativ (words
of negative outlook – feature from GI) and
VinANEW (novel feature) are better for
discrimination of the VN class. For the VP class
they are not so good. The feature posemo (number of
positive words – feature from LIWC) for example
describes better the VP class.
Table 9: Best features for valence description.
Feature
Intersection Area
posemo (SBF)
24.6%
negativ (SBF)
29%
VinDAL (SBF)
33.1%
VinGAZQ1Q2Q3Q4 (SBF)
34.2%
VinANEW (SBF)
37.4%
5 CONCLUSIONS
This paper investigates the role of lyrics in the MER
process. We proposed new stylistic, structural and
semantic features and a new ground truth dataset
containing 180 song lyrics, manually annotated
according to Russell emotion model. We used 3
classification strategies: by quadrants (4 categories),
by arousal hemispheres (2 categories) and by
valence meridian (2 categories). Comparing to the
state of the art features (CBF - baseline), adding the
other features included the novel features improved
the results from 68.2% to 77.1% for quadrant
categories, from 79.6% to 86.3% for arousal
hemispheres and from 84.2% to 89.2% for valence
meridians.
To further validate the classification by
quadrant’s experiment, we built a validation set
comprising 771 lyrics extracted from the AllMusic
platform, and validated by three volunteers. We
achieved 73.6% F-measure in the classification by
quadrants.
After the analysis of the best features, we
concluded that some of the novel StruBF, StyBF and
SemBF features are very important for the different
problems. For example #Slang and FCL in StyBF,
#Title in StruBF and VinGAZQ2 in SemBF.
In the future, we will continue with the proposal
of new features, particularly at a stylistic and
semantic level. Additionally, we plan to devise a bi-
modal MER approach. To this end, we will extend
our current ground truth to include audio samples of
the same songs in our dataset.
Moreover, we intend to study emotion variation
detection along the lyric to understand the
importance of the different structures (e.g. chorus)
along the lyric.
ACKNOWLEDGEMENTS
This work was supported by CISUC (Center for
Informatics and Systems of the University of
Coimbra).
KDIR 2016 - 8th International Conference on Knowledge Discovery and Information Retrieval
54

REFERENCES
Besson, M., Faita, F., Peretz, I., Bonnel, A., Requin, J.
1998. Singing in the brain: Independence of lyrics and
tunes, Psychological Science, 9.
Boser, B., Guyon, I., Vapnik, V. 1992. A training
algorithm for optimal margin classifiers. Proc. of the
Fifth Ann. Workshop on Computational Learning
Theory, pages 144–152.
Bradley, M., Lang, P. 1999. Affective Norms for English
Words (ANEW): Stimuli, Instruction Manual and
Affective Ratings. Technical report C-1, The Center
for Research in Psychophysiology, University of
Florida.
Downie, J. 2008. The music information retrieval
evaluation exchange (2005–2007): A window into
music information retrieval research. Acoustical
Science and Technology, vol. 29, no. 4, pp. 247–255.
Duda, R., Hart, P., Stork, D. 2000. Pattern Recognition.
New York, John Wiley & Sons, Inc.
Fontaine, J., Scherer, K., Soriano, C. 2013. Components of
Emotional Meaning. A Sourcebook. Oxford
University Press.
Hu, X., Downie, J., Laurier, C., Bay, M., Ehmann, A.
2008. The 2007 MIREX audio mood classification
task: Lessons learned. In Proc. of the Intl. Conf. on
Music Information Retrieval, Philadelphia, PA.
Hu, Y., Chen, X., Yang, D. 2009. Lyric-Based Song
Emotion Detection with Affective Lexicon and Fuzzy
Clustering Method. Tenth Int. Society for Music
Information Retrieval Conference.
Hu, X., Downie, J., Ehmann, A. 2009. Lyric text mining in
music mood classification. Proc. of the Tenth Int.
Society for Music Information Retrieval Conference
(ISMIR), Kobe, Japan, pages 411–416.
Hu, X., Downie, J. 2010. Improving mood classification in
music digital libraries by combining lyrics and audio.
Proc. Tenth Ann. joint conf. on Digital libraries, pp.
159-168.
Juslin, P., Laukka, P. 2004. Expression, Perception, and
Induction of Musical Emotions: A Review and a
Questionnaire Study of Everyday Listening. Journal of
New Music Research, 33 (3), 217–238.
Keerthi, S. and Lin, C. 2003. Asymptotic behaviors of
support vector machines with Gaussian kernel. Neural
Computation, 15(7):1667–1689.
Krippendorff, K. 2004. Content Analysis: An Introduction
to its Methodology. 2nd edition, chapter 11. Sage,
Thousand Oaks, CA.
Laurier, C., Grivolla, J., Herrera, P. 2008. Multimodal
music mood classification using audio and lyrics.
Proc. of the Int. Conf. on Machine Learning and
Applications.
Lu, C., Hong, J-S., Cruz-Lara, S. 2006. Emotion Detection
in Textual Information by Semantic Role Labeling and
Web Mining Techniques. Third Taiwanese-French
Conf. on Information Technology.
Mayer, R., Neumayer, R., Rauber, A. 2008. Rhyme and
Style Features for Musical Genre Categorization by
Song Lyrics. Proc. of the Int. Conf. on Music
Information Retrieval (ISMIR), pp. 337-342.
Montgomery, D., Runger G., Hubele, N. 1998.
Engineering Statistics. Wiley.
Robnik-Šikonja, M., Kononenko, I. 2003. Theoretical and
Empirical Analysis of ReliefF and RreliefF. Machine
Learning, vol. 53, no. 1–2, pp. 23–69.
Russell, J. 1980. A circumspect model of affect,” Journal
of Psychology and Social Psychology, vol. 39, no. 6,
p. 1161.
Russell, J. 2003. Core affect and the psychological
construction of emotion. Psychol. Review, 110, 1,
145–172.
Sebastiani, F. 2002. Machine learning in automated text
categorization. ACM Computing Surveys, 34(1):1–47.
Strapparava, C., Valitutti, A. 2004. Wordnet-affect: an
affective extension of wordnet. In Proceedings of the
4th International Conference on Language Resources
and Evaluation, pp. 1083-1086, Lisbon.
Taylor, A., Marcus, M., Santorini, B. 2003. The Penn
Treebank: an overview. Series Text, Speech and
Language Technology. Ch1. 20, 5-22.
Vignoli, F. 2004. Digital Music Interaction concepts: a
user study. Proc. of the 5th Int. Conference on Music
Information Retrieval.
Whissell, C., 1989. Dictionary of Affect in Language. In
Plutchik and Kellerman Emotion: Theory, Research
and Experience, vol 4, pp. 113–131, Academic Press,
NY.
Yang, Y., Lin, Y., Su, Y., Chen H. 2008. A regression
approach to music emotion recognition. IEEE
Transactions on audio, speech, and language
processing, vol. 16, No. 2, pp. 448–457.
Yang, D., and Lee, W-S. 2009. Music Emotion
Identification from Lyrics. Eleventh IEEE Int.
Symposium of Multimedia.
Zaanen, M., Kanters, P. 2010. Automatic Mood
Classification using tf*idf based on Lyrics. in J.
Stephen Downie and Remco C. Veltkamp, editors,
11th International Society for Music Information and
Retrieval Conference.
Classification and Regression of Music Lyrics: Emotionally-Significant Features
55
