
StorylineViz: A [Space, Time, Actors, Motion] Segmentation Method
for Visual Text Exploration
Iwona Dudek
and Jean-Yves Blaise
UMR CNRS/MCC 3495 MAP, Campus CNRS Joseph Aiguier, 31 chemin J. Aiguier, 13402, Marseille, France
Keywords: Visualisation, Knowledge Modelling, Sensemaking, Spatio-Temporal Data, Textual Content, Narratives.
Abstract: Supporting knowledge discovery through visual means is a hot research topic in the field of visual analytics
in general, and a key issue in the analysis of textual data sets. In that context, the StorylineViz study aims at
developing a generic approach to narrative analysis, supporting the identification of significant patterns
inside textual data, and ultimately knowledge discovery and sensemaking. It builds on a text segmentation
procedure through which sequences of situations are extracted. A situation is defined by a quadruplet of
components: actors, space, time and motion. The approach aims at facilitating visual reasoning on the
structure, rhythm, patterns and variations of heterogeneous texts in order to enable comparative analysis,
and to summarise how the space/time/actors/motion components are organised inside a given narrative. It
encompasses issues that are rooted in Information Sciences - visual analytics, knowledge representation –
and issues that more closely relate to Digital Humanities – comparative methods and analytical reasoning on
textual content, support in teaching and learning, cultural mediation.
1 INTRODUCTION
A broad picture of the evolution of information
sciences over the past decade shows that big data,
meaning here big volumes of data, dynamically
changing data, as well as high variety, highly
heterogeneous data, has paved its way to the top of
the research agenda. In parallel, availability of large
collections of non-structured textual content,
typically found in digital libraries, has fostered the
emergence of research works clearly intermingling
knowledge discovery issues with visualization
issues. Said briefly, there is a move towards bridging
the gap between on one hand linguistics-based
approaches – i.e. for instance spotting markers of
cause-effect relations in text corpora, as in
(Marshman et al. 2008) – and on the other hand
information visualisation approaches – i.e. for
instance tileBars for document visualisation
(Spence, 2001), or basic wordclouds. Hence
supporting text analysis through visual means has
become a hot research topic in the field of visual
analytics (VA), a field described in its early days by
Thomas and Cook as “focusing on analytical
reasoning facilitated by interactive visual
interfaces” (Thomas and Cook 2005).
In that context, the StorylineViz study builds on
the premise that a narrative can be segmented into
successive or parallel situations differentiated from
one another other basing on changes in time, space,
actors, or motion. Situations act as a semantic filter,
helping to analyse and compare heterogeneous texts
and collections of texts basing on common metrics.
(Figure 1)
Appropriate visualisations (in the sense of VA
end products) depicting sequences, rhythms,
alternations of situations can then help experts and
end users perform reasoning tasks on the narrative
structure of texts, ranging from stylistic profiling
(differences and similarities inside and across
writing genres, or inside an author’s works) to
comparative analysis (different recounts of the same
story for instance). (Figure 2)
The research unfolds in two sub-challenges a
knowledge modelling challenge (How can we spot
changes in space? What exactly makes a space to be
differentiated form another – a name, a size? Who
are actors - human beings only? ...) and a
visualisaton challenge (What visual solutions could
help underligning expected or unexpected patterns
inside or across texts?).
The paper is structured as follows: section 2
introduces the reason-to-be of this research, its
starting point. In section 3 we position our
contribution with regards to existing approaches in
the fields of visual analytics on one hand, and of text
Dudek, I. and Blaise, J-Y.
StorylineViz: A [Space, Time, Actors, Motion] Segmentation Method for Visual Text Exploration.
DOI: 10.5220/0006034600210032
In Proceedings of the 8th International Joint Conference on Knowledge Discovery, Knowledge Engineering and Knowledge Management (IC3K 2016) - Volume 1: KDIR, pages 21-32
ISBN: 978-989-758-203-5
Copyright
c
2016 by SCITEPRESS – Science and Technology Publications, Lda. All rights reserved
21
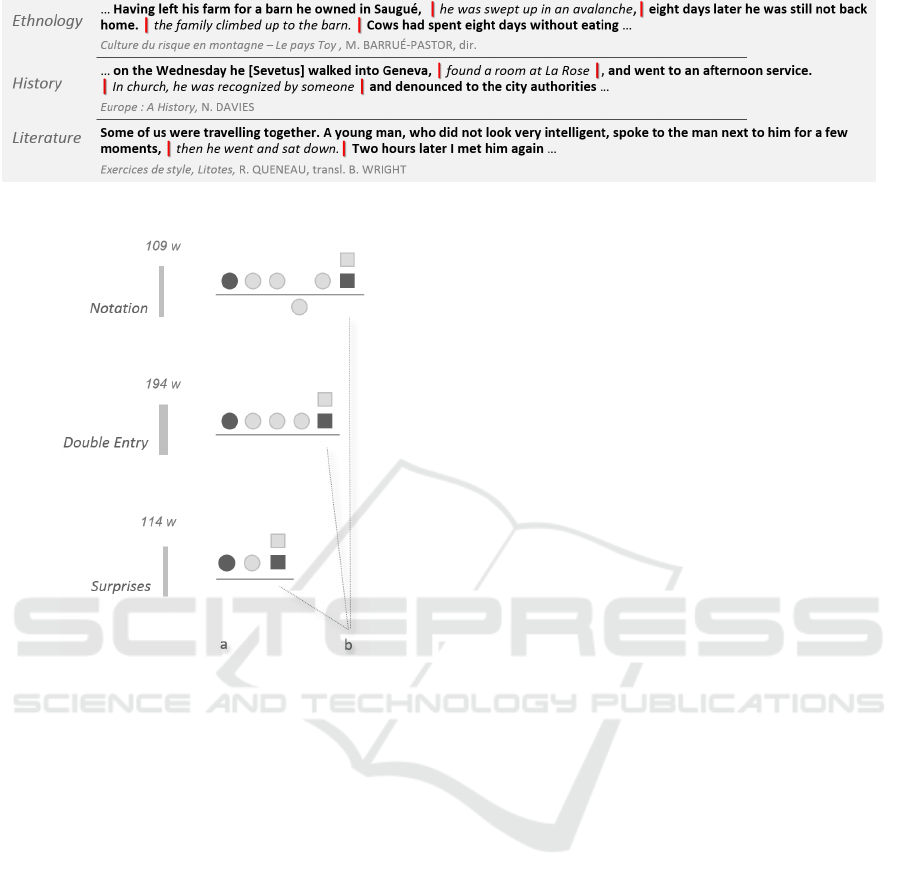
Figure 1: Identification of situations in heterogeneous texts.
Figure 2: A comparison of how situations unfold in time
and space in three recounts of the same story (from R.
Queneau’s Exercises in Style). Note for instance that only
situations (a, b, first and last symbols) remain
systematically the same across in these three versions.
analysis on the other hand. Section 4 details our
choices in terms of knowledge modelling, i.e. how
the space/time/actors/motion components are used in
the segmentation of textual content. Section 5 then
presents a series of experimental visualisations
aimed at demonstrating in what the whole approach
should be beneficial in terms of knowledge
discovery for text analysis. In section 6 we pinpoint
strengths and weaknesses of the approach, and in
particular challenges ahead if wanting to apply the
approach on a large scale. Finally, a short conclusion
sums up what we think can be considered as fruitful
feedbacks from this study.
2 RESEARCH ISSUE
There is naturally a large range of features
researchers may want to extract from text corpora,
and analyse through visual means. Some are clearly
structure-related, like in (Marshman et al. 2008b)’s
comparative analysis of lexical knowledge patterns.
Others by contrast focus on spotting topics like
Sabol’s topical-temporal maps (Sabol, 2012), a
visual metaphor allowing an interactive analysis of
how prominent topics in large collection of news
releases change over time.
So why did we choose to focus on extracting the
spatio-temporal content of textual data? The idea
came as a natural continuation of years of research
conducted on the architectural and urban heritage. A
significant part of the historical evidence we use is
extracted from texts, ranging from inventories to
travel diaries. At the end of the day hints are
recorded as relevant for a given place, a given time,
mentioning a given set of actors. But both place and
time are likely to be partially, when not poorly,
described (a document will for instance mention
something occurring “on street A at the beginning of
spring”). Neither space nor time are consistently
defined inside sources, and across sources (varying
precision, varying granularity).
The statement of need from which the
StorylineViz study originates can be summed up as
follows: can we represent in a systematic, synthetic
and universal form paths by their spatial and
temporal components? A ‘path’ is here understood
as a series of situations leading from an initial state
to a final state. This series is consistent or not in
terms of spatial scale or quality of the information
describing situations. It can be continuous or not (i.e.
including or not temporal breaks). The notion of
path can be used to interpret, and structure (i.e.
segment according to division consistent lines) a
variety of heterogeneous historical evidence: travel
diaries, witness reports, inventories, iconographic
material, etc.
But this notion of path could, when looking from
closer, act as a potential semantic filter far beyond
its initial field of concern - historical evidence. It is
obviously closer to the content of a narrative that to
highly structured data sets handled in route
calculations offered by GPS applications for
KDIR 2016 - 8th International Conference on Knowledge Discovery and Information Retrieval
22
instance. Hence the attempt we present in this paper
to try and see in what such an approach to text
segmentation could be fruitful, beyond its initial
context of emergence.
StorylineViz should be understood as a proof-of-
concept study that aims at developing a generic
approach to narrative analysis, supporting the
identification and visualisation of significant
patterns inside textual data, and ultimately
knowledge discovery and sensemaking.
Narratives as seen from that general point of
view are strongly heterogeneous (from whole texts
to just series of facts, from a book or collection to a
few paragraphs). In addition, they can be
contradictory or conflicting (different recounts of a
series of events) or transformed (typically by
translations). As of today they are often categorised
(a play, a travel diary, an eye-witness report) and
analysed from an expert’s point of view (linguistics,
literature, history, etc.) but hard to synthesize and to
compare to one another.
In this contribution we propose an approach in
which a narrative is segmented in a series of
situations in ordinal time (i.e. only the order of
appearance of situations is defined: situation A
occurs before situation B, but neither A nor B need
to be actually dated). A situation is differentiated
from another basing on the variation of one of four
parameters: time, space, actors, and motion.
Our approach’s core objective is to facilitate
visual reasoning on the structure, rhythm, patterns
and variations of texts in order to enable
comparative analysis and to summarise in a clear-cut
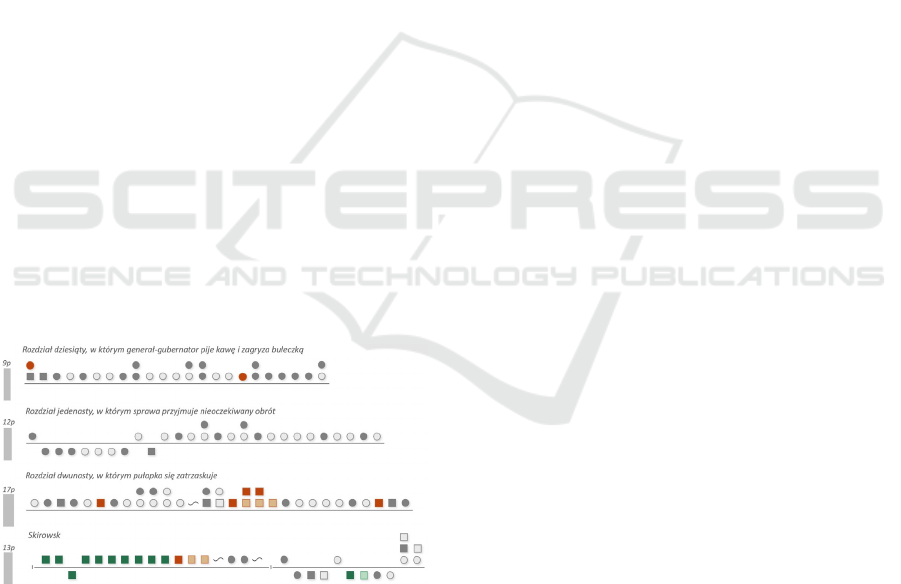
Figure 3: Visualisation of the spatio-temporal content of a
Fandorin mystery by Boris Akunin (partial view): each
line corresponds to a chapter, each situation is represented
by one or several symbol distributed along the line. Notice
similarities and differences between these four chapters
highlighted for example by the colour of graphic signs
(type of space – orange and green correspond to “large”
spaces – urban areas or open land whereas greys
correspond to spaces in and around a given building) or by
their shape (circles correspond to nested spaces, i.e. actors
are inside vehicles or objects that can move or be moved).
manner how the space/time/actors/motion
components are organised inside and across
narratives. (Figure 3).
Quantitative and qualitative parameters can then
be taken into account, allowing the association of
causal or contextual indicators. The segmentation
procedure is seen as a common ground between
varieties of narratives. It aims at facilitating
analytical focus+context views of complex
narratives, comparisons inside collections, and more
generally visual reasoning on structure, rhythm,
patterns and variations. If proven workable the
approach opens a number of application scenarios,
among which:
Comparing oral or written recounts of the same
series of events as made witnesses of the same
series of events.
Supporting the identification of trends and
patterns in writing genres in an edutainment-
like approach.
Combining the segmentation procedure and its
visualisation with a cartographic platform in
order to analyse emblematic "travel diaries".
Allowing for a synthetic and systematic
comparison of urban tracks, tourist routes, etc.
(type and number of situations on a particular
course, patterns of regular alternations or not,
etc.).
Analysing the changes over time of a route
from point A to point B (situations added,
retrieved or modified).
Uncovering differences in the interpretation of
texts by different readers.
At the end of the day, the approach can also be
seen as an attempt to step out of discipline-specific
frameworks so as to promote sort-of “universal”,
comparison-enhancing, metrics of narratives.
3 SCIENTIFIC CONTEXT
Open access to massive textual content, typically as
found in digital libraries, has fostered the emergence
of research works intermingling knowledge
management, visualization, and language processing
issues. In this contribution we focus on large non-
structured texts. Unlike when handling structured
data sets, working on large texts, today often made
available in large open access repositories such as
Gallica, introduces specific challenges. (Oelke,
2010) summarizes some of them: quantity (amount
of words), polysemy (of words, references, literary
imagery), flexibility (of rules in natural languages),
StorylineViz: A [Space, Time, Actors, Motion] Segmentation Method for Visual Text Exploration
23
interpretation (use of a predefined knowledge of the
world by humans).
Our study proposes an approach that centres on
semantic aspects, applicable across collections of
texts. It builds on the idea that visualisation can help
users explore, analyse and cross-examine textual
documents. This idea is backed by research works
covering a wide range of issues: (Oelke et al, 2010)
VisRA tool focuses on readability analysis, (Koch et
al, 2014) VarifocalReader focuses on multi-layer
visualisation/navigation and interactive annotation,
(Vuillemot et al, 2009) POSvis on relationships and
co-occurences in the flow of a text (Wanner et al,
2011) approach digs in the notion of opinion and
sentiment in book rating, ...
Those examples share a common mantra: human
analysis of textual content, sensemaking in large
and/or complex textual data sets, can be facilitated
by adapted abstract visualisations. They also share a
common statement: full automatic algorithms can
hit their limit when facing complex texts.
Accordingly, our study does relate to the above
research works in terms of scientific context, but it
clearly leaves aside the NLP (Natural Language
Processing) issues. We shall in this contribution
focus on the knowledge modelling step on one hand,
and on the visualisation step on the other hand.
Mainstream research works at the intersection of VA
and NLP have been investigating approaches that
strongly rely on a line per line, word per word
analysis of texts: statistical approaches (e.g.
occurrences of words, lengths, word types), Named
Entities Recognition (NER) related approaches (e.g.
user selections of words, ontologies, opinion
indicators), machine-learning approaches (e.g.
extraction of significant linguistic patterns). In all
these cases, language itself - i.e. the occurrences,
positions, lengths, relations of words and sentences -
is at the heart of a discipline specific analysis.
By contrast our approach builds on a
segmentation bias that is:
neutral - allowing for a discipline-independent
cross-examination of texts,
unrelated to text features such as lengths (a new
situation can occur inside one sentence, or
after three pages),
focusing on supporting visual comparisons of
rhythms and sequences, at user-chosen
aggregation levels.
As will be discussed in section 6, we do
acknowledge that the language processing step
remains at this stage of our research an unaddressed
issue. The segmentation of texts used in the study
has been done manually: it could be seen as a
weakness in terms of significance and reusability of
the approach.
We believe that before any attempt at
“automatizing” language processing it is key to
formalise a robust, insight-gaining, unambiguous
segmentation protocol, and to evaluate in what the
visualisations can be beneficial. Accordingly we
consider that our study can contribute to pinpointing
a new research path, at a time when the focus is
often put on the processing of massive data sets.
4 METHOD
We introduce a text analysis method that builds on
the identification of quadruplets of components:
actors, space, time and motion. These components
are used to segment a narrative and translate it into
sequences of situations in ordinal time (only the
order of events considered). (Figure 4)
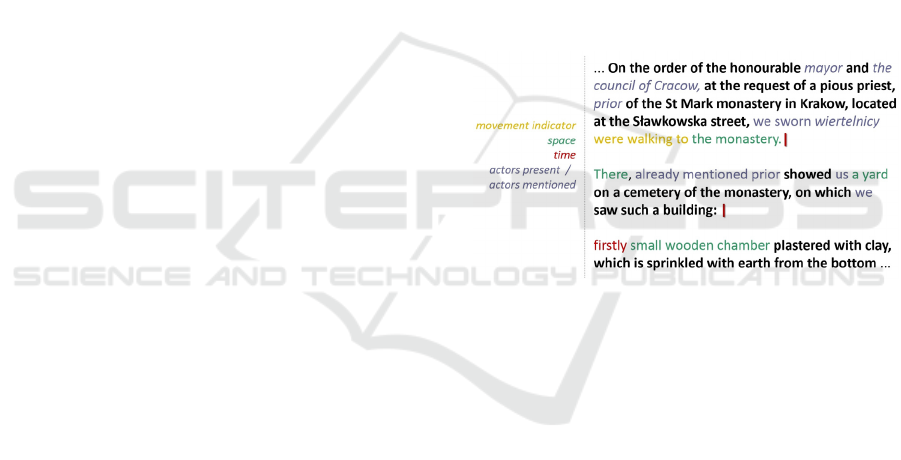
Figure 4: Segmentation into situations - four indicators
(Actum feria sexta ante Fabiani et Sebastiani [19I] anno
Domini 1596).
The way each component is defined and
structured is detailed in the following sub-sections.
At the end of the analysis phase the text under
scrutiny is entirely transformed into sequences of
situations as they occur in the narrative. Sequences
are then translated into a visual language.
4.1 The Concept of ‘Situation’
A situation is basically a sort-of token, resulting
from the segmentation procedure. However we are
here far from a segmentation at the word or sentence
level: situations are determined by changes of values
in a quadruplet of descriptors (space, time, actors,
and motion). A change of one of the four descriptors
introduces a new situation. (Figure 5)
Situations occurring in the past of the story (e.g.
reminiscences - narrating past experiences) are
differentiated from those occurring in the course of
the story.
KDIR 2016 - 8th International Conference on Knowledge Discovery and Information Retrieval
24
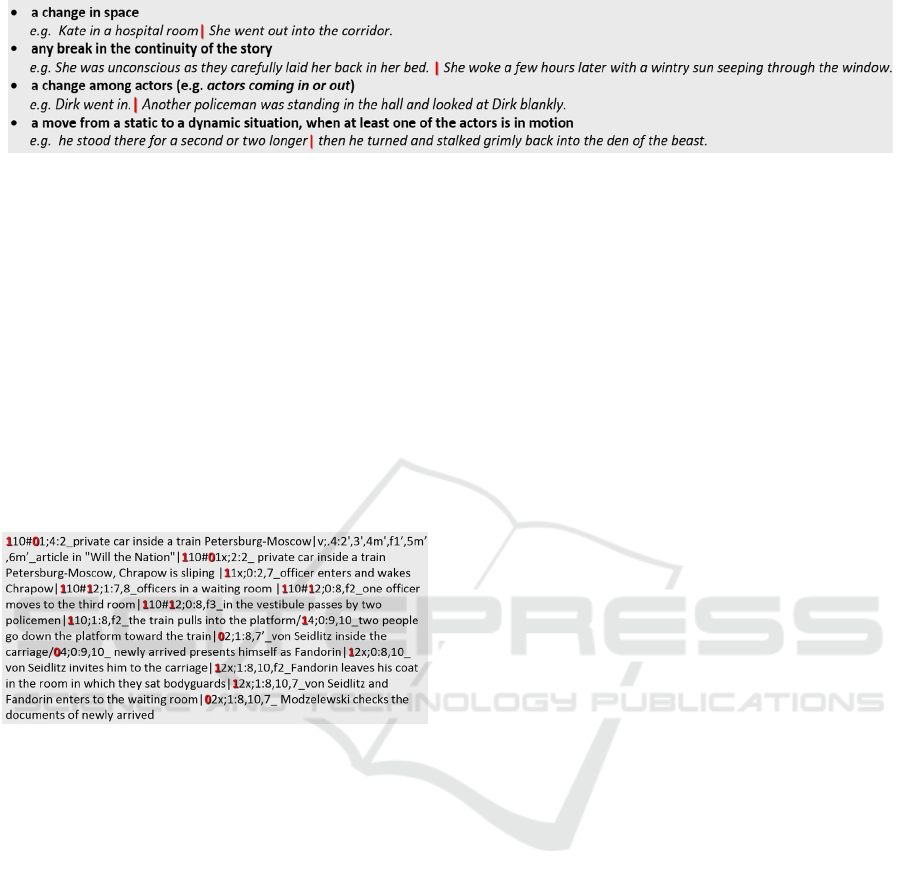
Figure 5: A segmentation procedure ending in the identification of independent situations basing on changes in space, time,
actors or motion: example of application to D. Adams’ The Long Dark Tea-Time of the Soul.
Situations are identified at this stage through a
manual annotation and segmentation process - a
dozen of texts ranging from literature to ethnology
have been tested, covering three languages. Each
situation is associated manually with a value for
each of the descriptors, and with a short paraphrase
summarising “what happens”. The four values are
translated into an alphanumeric code comprising
indicators for each of four parameters and separators
that allow for a processing of the information, i.e.
for a transfer into fields of an RBBMS dataset which
in return is queried in order to produce the
visualisations. (Figure 6)
Figure 6: Example of the alphanumeric code resulting
from the annotation phase (in red, the code corresponding
to the motion indicator - 0 static 1 dynamic – example
from The Death of Achilles by B. Akunin).
Situations can also be grouped by predefined
sequences such as chapters (or any other main
division of a document).
4.2 Space Parameter
The space parameter defines where the action takes
place (i.e. Where does the action begin? Does it
continue in the same location? Are the subsequently
cited places well identified or in vaguely mentioned
locations? Are there many quick changes of space?).
But ‘space’ as geographers, historians, architects, or
ethnologists picture it is far from being one and only
one notion. It can be described quantitatively
(positions, size, exact morphology) or qualitatively
(through linguistic indicators, or a relation to a
Named Entity, for instance a toponymy like in
(Kergosien et al., 2014).
In the context of this study we need to spot in the
flow of a narrative the moments when a change of
space occurs, and therefore leads to a new situation
(whether spaces are associated with a given named
entity - e.g. Paris, or are present in the flow of part-
of-speech – e.g. in the second cellar). Detecting such
changes implies defining unambiguous lines of
division between spaces. To do so, we reinterpret the
concept of scale, in accordance with previous
research on spatio-temporal information retrieval
(Blaise and Dudek, 2005, 2008, 2012). What is
meant by scale is not a map’s numerical ratio, but
the idea that spaces can be classified according to
alternative spatial granularities.
Our model of space includes 16 indicators (3
non-spatial descriptors and 13 scale identifiers). The
non-spatial descriptors concern the situations where
space is not clearly assessed (metaphorical
descriptions, undefined space, space is not present) –
in other words non-spatial descriptors help dealing
with incomplete, ill-defined, or simply missing
spatial information. The thirteen scale identifiers are
organised into six groups (e.g. in and around a
building, public spaces, open land). An additional
parameter is taken into consideration: primary vs.
nested spaces. Primary spaces correspond to
‘simple’ situations (e.g. Jane is in her room, Jane is
walking in the garden). Nested situations appear
when actors are inside vehicles or objects that can
move or be moved inside a primary space (e.g. Jane
is travelling by train.).
4.3 Time Parameter
The time parameter corresponds to the when
question: it explains the story’s development over
time (e.g. continuous progression from present to
future, regressive present-to-past development,
multiple changes of time, etc.). The time model
builds on the notion of ordinal time (Aigner et al.,
2011): situations are analysed from the point of view
of an order of appearance (before/after) in the flow
of the narration, but neither quantified nor anchored.
(Figure 7)
StorylineViz: A [Space, Time, Actors, Motion] Segmentation Method for Visual Text Exploration
25
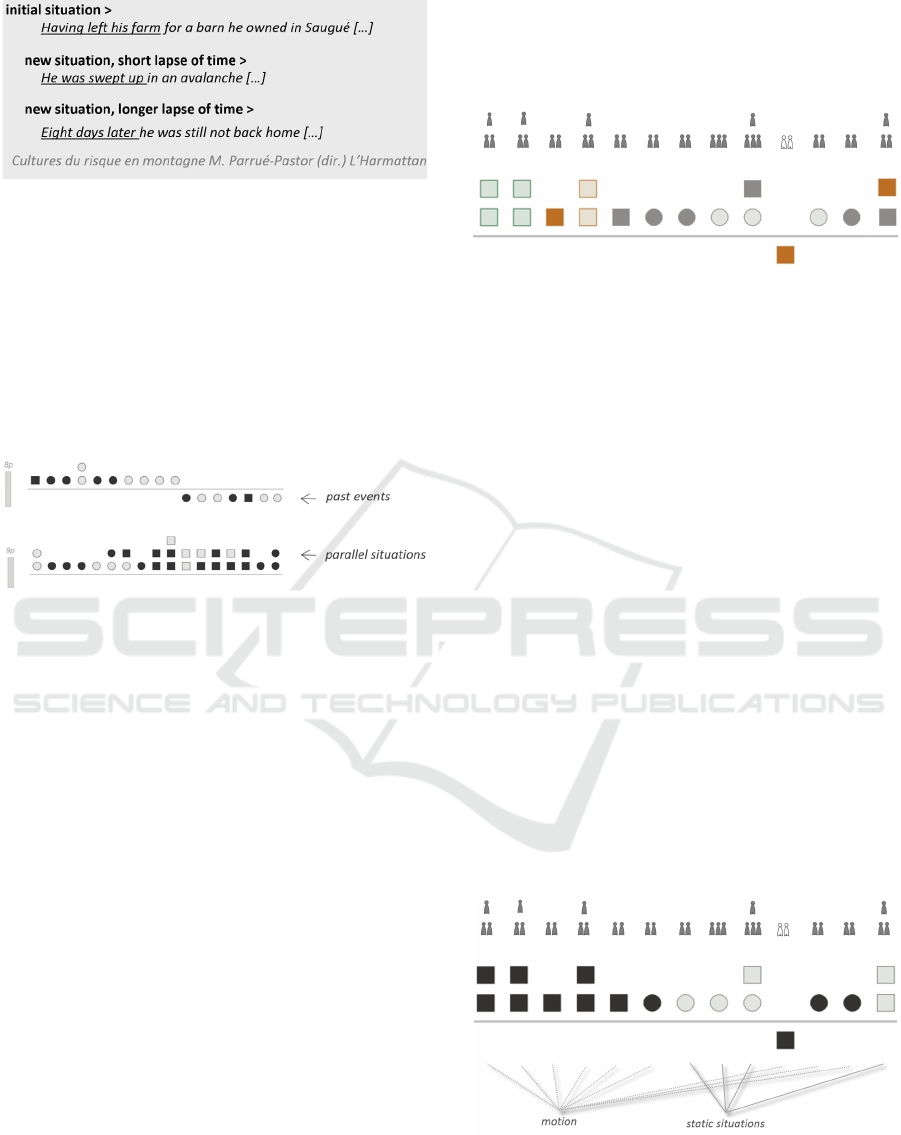
Figure 7: Change of situations - temporal disruptions.
A qualitative assessment of time continuity is
associated to each situation change (lapse of time
separating a situation from the next one).
Successive situations are identified in the order
of the narration (as the story unfolds) as belonging to
the present of the story or its past (things having
occurred “before the present of the story”).
Situations can also be tagged as being parallel
(occurring at the ‘same’ time). (Figure 8)
Figure 8: Top, past situations are represented below the
horizontal line. Bottom, parallel situations are represented
by graphic elements “piled” one over the other above the
horizontal line.
Additional indicators are used to further describe
parallel situations (actors mutually aware of one
another or not, typically), or to identify customary
behaviours (occurring repeatedly).
4.4 Actors
Actors are yet another trigger of situation change.
They may be individuals, well defined groups of
people, but can they also be indistinctly specified
groups (e.g. a crowd), things (e.g. thinking
machines), or animals? We here need to
disambiguate the very concept of actor: are ants
mentioned in B. Werber’s Empire of the ants actors?
Our strategy is to consider actors as a being or a
consistent group of beings, real or imaginary
creatures or entities, fitted with the ability to make
choices and to act. Actors may be human beings, but
also gods (e.g. Zeus, Dionysus), thinking machines,
androids, animals (e.g. the wolf in Little Red Riding
Hood), and so on. The description of actors is then
fine-tuned. Actors physically engaged in a situation
(i.e. present) are distinguished from actors that are
only mentioned (e.g. in a conversation, in thoughts),
individual actors are distinguished from consistent
groups either identified (e.g. the Celts) or not (e.g. a
crowd). (Figure 9)
Figure 9: Actors appearing in each situation of S. Lem’s
Trurl's Machine. Situations are read from left to right.
Here Trurl and Klapaucius, the two engineers (bottom part
of the lines showing actors as silhouettes) are being chased
by Trurl’s machine gone mad (top part of these lines, one
silhouette alone). A reference to past events is made
(orange square below the horizontal grey line), and that
past situation concerns two actors not present but
mentioned (white silhouettes).
Finally, major events concerning actors can also
open up on a situation change – a severe injury, or a
death of an actor needs to be reported.
4.5 Motion
Finally, motion is also a key element in the
definition of a situation (only the motion of actors is
considered). Motion is important to state since it
helps unveiling spatial and temporal continuities or
discontinuities in the narrative. An intensive use of
motion indicators in a text may characterise writing
genres (e.g. logbooks), may underline recurrent
stylistic elements (e.g. a speed chase with the
police), stylistic characteristics of an author,
differentiate acts inside one play, help understanding
changes in space, and so on.
Figure 10: A partial view of motion analysis visualisation
corresponding to S. Lem’s Trurl's Machine. Light grey
elements indicate static situations (e.g. the engineers
discuss with the mayor of a town in which they sought
refuge).
KDIR 2016 - 8th International Conference on Knowledge Discovery and Information Retrieval
26
Naturally we need to be clear on what we mean
by motion. The strategy is to focus on movements
that introduce a change of location but not
necessarily a change of space (e.g. someone is
walking down a street). From the point of view of
this criterion situations may then be classified as
static or dynamic. A dynamic situation implies the
motion of at least one of the actors, motion
understood as moving in space (e.g. walking,
marching, strolling, running, driving a car…).
(Figure 10)
5 VISUAL SOLUTIONS
Our approach bases on the idea that interactive
visual interfaces can help various target users
perform reasoning tasks in application fields ranging
from expert analysis to education or cultural
mediation. Accordingly visualisation, as defined by
R. Spence (i.e. a cognitive activity) is a key
component of the study, both in the understanding of
a given narrative’s “spatio-temporal profile” and in
fostering comparisons inside collections of texts.
Depending on the parameters a user may choose to
privilege (space/time/actors/motion), different
visualisations are proposed. We detail them in the
following sub-sections. All of these visualisations
share some common design principles:
Situations are represented one by one and
aligned as they occur in the original text (left
to right, or top-down).
Each situation is represented by an interactive
symbol (a multidimensional icon). Shape,
colour and position are used to transfer
visually the information on each situation.
A rephrasing of the actual text corresponding to
each situation is available on user demand.
Parallel situations, i.e. situations co-occurring
in time, are grouped and represented together.
Actors are visualised on user demand, with
colours differentiating the nature or type of
actors (actors present, mentioned, injured, or
groups of actors).
Situations are grouped by sequences (chapters or
other grouping mechanism adequate for a particular
writing genre) in order to grab more easily an
understanding of the text’s structural features.
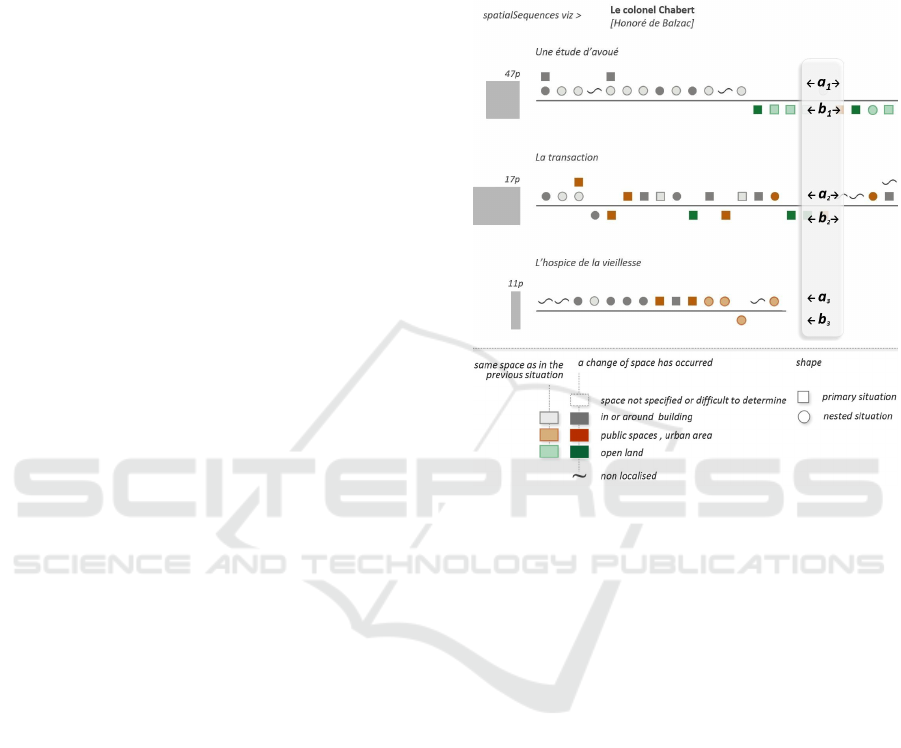
5.1 Spatial Sequences Visualisation
In the spatial sequences visualisation situations are
represented in ordinal time from left to right along
horizontal bars. Each horizontal bar corresponds to a
sequence of situations. All reminiscences are
situated below horizontal bars (Fig. 11 b
1
,b
2
,b
3
).
Colour and shapes are used to differentiate the
occurrences of various spatial scales.
Figure 11: Organisation and legend of the spatial
sequences visualisation. Bottom, legend of the
visualisation. Colours correspond to ranges of scales.
Squares and circles differentiate nested spatial
configurations (e.g. driving a car in a city) from primary
spatial configurations (e.g. walking in a city). Top, a
partial view of the spatial sequences visualisation
corresponding to Balzac’s Colonel Chabert. Note for
instance the contrast between spatial location of present
(a
1
) and past (b
1
) of the story in chapter one (colours), or
the quasi-absence of past events in chapter 3 (b
3
).
5.2 Motion Analysis Visualisation
The motion analysis visualisation uses the same
general organisation as the previous: situations are
represented in ordinal time from left to right along a
horizontal bar.
But here the focus is put on the motion
component of the model: colours and transparency
representing different types of space are replaced by
black-and-white motion indicators. This
visualisation is used to differentiate static and
dynamic situations, thereby better underlining in
particular rhythms inside a text. (Figures 10, 12)
StorylineViz: A [Space, Time, Actors, Motion] Segmentation Method for Visual Text Exploration
27
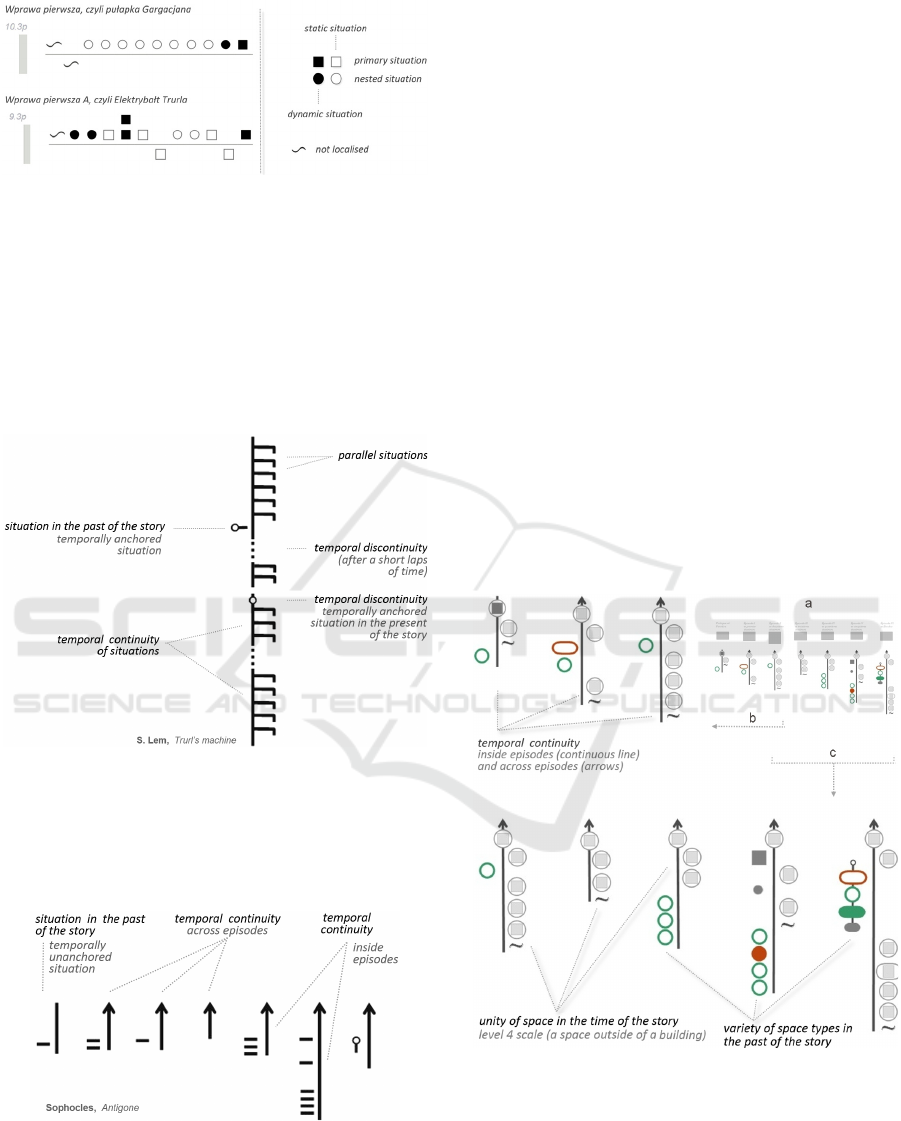
Figure 12: Organisation and legend of the motion analysis
visualisation. Left, a partial view of the visualisation
corresponding to S.Lem’s Cyberiad. Note for instance the
long sequence of static, nested situations in chapter 1.
Right, legend of the visualisation.
5.3 Temporal Continuity
The temporal continuity visualisation focuses on
assessing visually to which extent the story unfolds
without interruption in time. (Figure 13)
Figure 13: The temporal continuity visualisation applied to
S. Lem’s Trurl’s Machine. The visualisation shows an
intensive use of parallel situations, and spots three lapses
of time disrupting the temporal continuity.
A typical example of time continuity is the classical
unity of time rule for drama.
Figure 14: The temporal continuity visualisation applied to
Sophocles’ Antigone, the visualisation illustrates the unity
of time pattern.
Each sequence (i.e. chapter, episode, etc.) is here
represented as a vertical line. A line topped with an
arrow shows a temporal continuity with a previous
situation. Small horizontal lines distributed on the
left side of the vertical line correspond to situations
occurring in the past of the story. Parallel situations
are identified by symbols positioned on the right
side of the vertical line. The vertical line is disrupted
by various symbols in cases of temporal
discontinuity (different symbols are used to
represent short lapses of time, jumps in time,
temporally unanchored events, etc.).
5.4 Spatio-temporal Continuity
The spatio-temporal continuity visualisation builds
on the same design as the previous, but adds
symbols representing the space parameter. Whereas
in the spatial sequences visualisation (section 5.1)
we only deliver an indication about the group of
scales corresponding to a situation, we here allow
for a visual coding of each of the thirteen individual
scales. Fine-grain differences can be made for
instance to differentiate a situation occurring inside a
building from a situation occurring in a building’s
courtyard, or in a flat forming part of the building.
(Figure 15)
Figure 15: Spatio-temporal continuity visualisation
corresponding to Antigone of Sophocles (a – entire
visualisation, b,c - fragments). Note contrast in terms of
space between the past of the story (symbols on the left of
the vertical lines) and the present of the story (symbols
situated on the vertical time-line and on the right of it).
Note also that in the present of the story space remains
unchanged (in front of the palace).
KDIR 2016 - 8th International Conference on Knowledge Discovery and Information Retrieval
28

5.5 Implementation and Evaluation
The approach has been tested on different types of
text: a play (Sophocles), crime stories (A.Christie,
B.Akunin), science fiction and fantasy (S.Lem,
T.Pratchett, D.Adams), French literature (H.Balzac,
R.Queneau), reports of interviews (e.g. ethnological
research) or historical texts (e.g. 16th century textual
building inventories).
The corpus includes textual content written in
English, French and Polish. One of the reasons of
this choice was to check that the approach is
workable in different languages. Another reason was
to test the impact of a given natural language - i.e.
test if the segmentation of a given textual content,
once translated into another language, remains fully
consistent with the original.
As mentioned in section 4.1 the annotation step
results in alphanumeric codes associated to each
situation. These codes, along with bibliographic data
and other general information concerning the texts,
are stored in an RDBMS structure. They are
interpreted on the fly (Perl scripts) to produce SVG
(Scalable Vector Graphic) interactive visualisations
available inside standard web browsers.
5.6 Evaluation
An early “feasibility” evaluation was carried out
with a group of non-experts (twelve students in
mechanical engineering) in order to get a first
feedback on the knowledge modelling bias
(segmentation into sequences of situations). We
asked testers to depict an everyday series of actions,
such as their home to work routine, using the
graphical codes. We then asked then to complement
the description of each individual situation with one
or several qualitative parameters of their choice.
Some recurrent parameters emerged, such as sound,
amount of light, mood, etc. What this evaluation
procedure did usefully underline is that the logic
behind the segmentation protocol is easily
understood, and somewhat intuitive.
Yet there is a clear difference between asking
testers to analyse one of their own everyday routine
in terms of series of situations and having them
uncover these situations from a textual content using
predefined segmentation rules. In a second round we
therefore implemented a more demanding evaluation
setup, with this time eight testers from different
countries (Marie Curie fellows focusing on reality-
based 3D modelling – no native speakers of English)
working on two extracts from novels written in
English. The testers were first introduced to the
approach, and shown the whole set of segmentation
rules. Following, they were asked to work on a first
text that they had to segment under supervision. This
step was needed to make sure that the protocol was
clear enough for them. These two phases lasted for
an hour and a half. Testers were then left for one
hour with a 1000 words text that they had to
segment on their own, i.e. on one hand they had to
spot situation changes and on the other hand they
had to qualify each situation with regards to space
(what scale?) to time (any disruption?) actors (who
is concerned?) and motion (do actors move?).
Before analysing the results, it has to be said
clearly that the length of the text, the amount of
testers, and the time devoted to the evaluation (two
hours and a half all included) are certainly not
sufficient in order to draw firm conclusions. This
evaluation, however, did help us spotting significant
trends (including weaknesses) and ultimately helps
understanding where to go next.
A central issue we wanted to raise was whether
or not situations, can easily and unambiguously be
differentiated from one another. We analysed both
the raw, quantitative results (number of situations
spotted, types of scales identified, quantity of
switches between static and dynamic situations, etc.)
and the oral remarks made by the testers at the end
of the evaluation.
Results show that generally speaking the concept
of situation is quite easy to use – testers had no
particular difficulty in spotting different situations
and tagging them with values for the four
parameters. But if the mechanism was found clear,
we spotted a number of ambiguities deriving from
two different issues: comprehension and individual
interpretation of the segmentation rules on one hand,
and inherent “fuzziness” of texts on the other hand.
5.6.1 Comprehension Issues
The evaluation showed us that the testers had some
difficulties with time discretisation and scale
identification. Although testers globally understood
the rules, they did not have enough time to get
familiar with them before the test - they somehow
discovered them as they progressed in the
segmentation of the text.
We also noticed different individual interpret-
tations of the segmentation rules: e.g. what does
‘after an instant’ really mean? Testers disagreed on
this very notion. What kind of space is ‘a railway
station’? A building, a building and its surroundings,
an inside, an outside? Here again each tester pictured
what ‘a railway station’ is his own way.
StorylineViz: A [Space, Time, Actors, Motion] Segmentation Method for Visual Text Exploration
29

A certain number of segmentation rules as we
had verbalised them turned out to be either too
loosely defined, or too interpretative – typically the
notion of parallel situations that encompasses
someone spying on others from behind a window to
a phone call connecting two people located in
different parts of the world. One type of parallel
situations appeared as particularly confusing, when
several groups of people are in the same space but
act independently of one another - in this case the
rule itself needs rethinking.
Finally, some testers questioned the segmen-
tation rules themselves when the rules, according to
them, did not let them stick close enough to the text.
In the text proposed Kate is driven to the airport in a
taxi – but no mention is made of the taxi driver in
the initial situation. Those testers considered that
putative actors – here the taxi driver – should be
mentioned, although according the segmentation
rules they were given only actors mentioned in the
text should be specified.
Briefly speaking, the evaluation showed that
segmentation rules and definitions of scales,
temporal disruptions, motion and actors need to be
further clarified and illustrated by examples in order
to pin down the concepts and reduce existing
ambiguities. More generally the above compre-
hension issues underline the fact that more time
should be spent on explaining the segmentation rules
prior to the evaluation itself. Moreover applying
correctly the segmentation rules requires a thorough
understanding of how space and time are discretised
– which implies a steep learning curve.
At this stage the approach requires from readers
and annotators a good understanding of the
segmentation rules, but also keeping a certain
“distance” with the text in order to avoid confusing
what is really written, with what one may deduce,
understand or imagine. What we asked the testers to
do – segmenting of a text into an alphanumeric code
using a set of segmentation rules and of discrete
values – requires from annotators skills and
capabilities. It is a demanding task that limits the
circle of people who can be expected to carry out the
annotation step. What remains to be verified is the
level of readability of the visualisation we proposed.
5.6.2 Inherent Fuzziness of Texts
There are a number of factors that impact the way
space, time, actors and motion are verbalised by
authors. Texts are written with a significant amount
of unsaid, or half-said elements – voluntary
omission of details, figures of speech, etc.
Consider this yet straightforward example: “She
set off in search of first a newspaper and then some
coffee. She was then unable to find a working
phone”. Should the reader here consider time as
continuous, or as interrupted for a short while, for a
long while? The author does not say openly whether
there is a time disruption or not. The same can
happen when mentioning spaces, actors, or even
motion. Texts are the way they are, and readers will
anyway interpret and understand them differently,
whatever semantic-based segmentation rules one
may write – a feature of what Alfred Korzybski
named verbal levels (Korzybski, 1951).
The evaluation showed the inherent fuzziness of
texts can be seen as an obstacle, but can also be seen
as a potential object of study, an opportunity for
instance to use the segmentation rules in order to
localise areas where readers interpret a text
differently.
Interpreting the evaluation’s results should
however be done with caution. The segmentation’s
learning curve is definitely steep: further evaluation
efforts are therefore clearly needed (for example
finding a match between a text and a visualisation in
a setup where several possibilities are shown). It also
underlined unexpected potential benefits of the
approach, in its current state of development:
It helps comparing how different people
understand and interpret the spatio-temporal
content of a text.
It enhances debate, and helps uncovering
precisely (in the flow of the text) where
alternative interpretations occur, and why.
It facilitates the communication by one
individual of his own understanding of a text
by supporting (through visual means) his
discourse on rhythms of a narrative in a context
+ focus manner;
It could be used to weigh and compare the level
of interpretation required from readers
depending on the text or author.
6 LIMITATIONS AND
PERSPECTIVES
As mentioned in the introduction, we report in this
paper a proof-of-concept study that aims at
developing a generic approach to narrative analysis.
Accordingly there are a number of limitations that
we can quote, but that we will not detail, and notably
the following:
KDIR 2016 - 8th International Conference on Knowledge Discovery and Information Retrieval
30

We consider that the corpus of texts used as test
cases is representative in terms of variety,
heterogeneity, but it definitely is a partial
corpus.
The evaluation phase should clearly be
deepened – notably with regards to fine-tuned
usage scenarios.
The comprehensibility of the segmentation
rules for a wider public should be better
assessed, as well as the learning curve.
The implementation is a robust one, but it
certainly could be rethought or improved.
But beyond these general remarks, there are two
major lines of development, discussed hereafter, that
we think need to be mentioned and that somehow
underline potential perspectives.
6.1 Visual Reasoning: Still a Challenge
Our approach bases on the idea that the combination
of a non-standard segmentation procedure with
appropriate visualisations can offer users new
opportunities to perform reasoning tasks, and
uncover pieces of knowledge inside textual content.
But such a statement can only be corroborated (or
invalidated) if the experimental setup proposed to
testers is fully satisfactory. The visualisations we
ended on do show the idea is worth exploring, but
the implementation is at this stage not fully
satisfactory. For instance support for a visual cross-
examination of texts “within the eyespan” (Tufte,
2001) needs to be improved. Accordingly we
consider that our study needs to be extended and
deepened in order to state without doubt that the
approach is indeed, generic, workable across various
types of texts, and fruitful in terms of knowledge
discovery.
6.2 The Impact of Manual Annotation
Even more significant in terms of limitation of the
research’s potential impact is the fact that the
annotation process - i.e. the segmentation of texts –
is to this day a manual process. This clearly
undermines perspectives of application of such an
approach on a large scale. But on the other hand it
also opens a clear perspective (and challenge) for
this research. The approach hits the limits of existing
NLP based methods. Hence rounds of discussion we
are at this stage having with VA and NLP partners to
try and investigate how the approach could be
developed on a large scale. Even if a fully automated
annotation process would turn out to be out of reach,
working on semi-automatic procedures in the
context of the emergent crowdsourcing paradigm
would clearly open tangible large-scale application
perspectives. Furthermore, human annotation is by
itself a meaningful activity, opening perspectives, as
mentioned in section 5, in terms of communication
and comparative analysis of text interpretation. Both
going towards more automation in the segmentation
process, and sticking to a human process, can
therefore be considered as lines of development of
the approach.
His contribution introduces a generic approach to
narrative analysis: the approach’s main claim is that
extracting the spatio-temporal content of a narrative
and visualising it in ordinal time as a series of
situations can help spotting and exploring
significant patterns, trends, exceptions across
various types of texts.
It builds on a knowledge modelling effort and on
explorative visual analyses. The approach should
lead to a multipurpose visualisation framework
helping to reshape the way we understand,
summarise, and explain a narrative.
Our approach encompasses issues that are rooted
in Information Sciences - Visual Analytics,
Knowledge Representation – and issues that more
closely relate to Digital Humanities – comparative
methods and analytical reasoning on textual content,
support in teaching and learning, time and space
perception modelling, etc.
Although the corpus on which the approach has
been tested remains partial, the experimentation does
show the approach is workable across various types
of texts, and in each case does uncover patterns
suitable for comparison. The evaluation carried out
paved the way towards usage scenarios that would
focus more on assessing differences between reading
experiences than on the “automatization” of the
segmentation.
Beyond the segmentation issue, the approach
investigates the potential services of visualisation as
a non-verbal means to communicate an under-
standing of a text, in particular of how space and
time unfold inside narratives. A number of the
patterns unveiled are somehow expected (e.g. the
rigorous storyline of Sophocles’ Antigone - unity of
action, time and place, or a recurrent element in
Agatha Christie’s crime stories – a concluding
chapter with all actors in one space discussing the
whole sequence of past events that lead to the
crime.) Finer-grained findings revealed a number of
other characteristics for example varying proportion
of elements situated in the past of narration in
various texts, specific motion characteristics of
StorylineViz: A [Space, Time, Actors, Motion] Segmentation Method for Visual Text Exploration
31

chapters, authors using extensively parallel situa-
tions as a mean to reinforce the suspense, and so on.
In all cases
To conclude, visualisations produced until now
show an interesting interpretative potential. They
could be used for example to support teaching and
learning activities, helping learners to quickly get a
hold on patterns, trends, exceptions, and to carry out
comparative analyses across texts (for instance using
the approach in order to support pupils with learning
disabilities such as dyslexia). We consider that, at
this stage, the approach has proven workable, but
will need further improvement loops (more case
studies, more rounds of evaluation) before becoming
fully operable.
REFERENCES
Marshman, E., L’Homme, M.C., Surtees, V., 2008.
“Verbal markers of cause-effect relations across
corpora.” In Managing ontologies and lexical
resources, edited by Madsen B.N, Thomsen H.E, 159-
174. Copenhagen: Internationale Sprogstudier og
Vidensteknologi, Litera.
Spence, R., 2001. Information Visualization. Pearson
Addison-Wesley ACM Press: Harlow.
Thomas, J. J., Cook, K. A., 2005. Illuminating the Path:
The Research and Development Agenda for Visual
Analytics. IEEE CS Press.
Marshman, E., Van Bolderen, P., 2008b. “Interlinguistic
variation and lexical knowledge patterns.” In
Managing ontologies and lexical resources, edited by
B.N Madsen, H.E Thomsen, 263-278. Copenhagen:
Internationale Sprogstudier og Vidensteknologi,
Litera.
Sabol, V., 2012. “Visual Analysis of Relatedness in
Dynamically Changing Repositories”. Paper presented
at the MOVE-REAL 2012 thematic school, Fréjus,
October 08-12.
Oelke, D., 2010. “Visual document analysis: Towards a
semantic analysis of large document collections”. PhD
dissertation, University of Konstanz.
Oelke, D., Spretke, D.; Stoffel, A.; Keim, D., 2010.
“Visual readability analysis: How to make your
writings easier to read”. In IEEE Symposium on
Visual Analytics Science and Technology (VAST),
2010, 123 - 130.
Koch, S., John, M., Wörner, M., Müller, A., Ertl T., 2014.
“VarifocalReader – In-Depth Visual Analysis of Large
Text Documents”. In IEEE Transactions on
Visualisation and computer graphics Vol2. N.12:
1723-1732.
Vuillemot, R., Clement, T., Plaisant, C., Kumar, A. 2009.
“What's being said near 'Martha'? Exploring name
entities in literary text collections”. In IEEE
Symposium on Visual Analytics Science and
Technology (VAST) 107-114.
Wanner, F., Fuchs, J., Oelke, D., Keim, D.A., 2011. “Are
my Children Old Enough to Read these Books? Age
Suitability Analysis”. In Polibits: research journal on
computer science and computer engineering with
applications 43: 93-100.
Kergosien, E., Laval, B., Roche, M., Teisseire, M. 2014.
“Are opinions expressed in land-use planning
documents?” In International Journal of Geographical
Information Science vol. 28, issue 4: 739-762.
Blaise, J.Y., Dudek, I., 2005. “Using abstraction levels in
the visual exploitation of a knowledge acquisition
process” In Proceedings of I-Know 2005, Graz,
Austria, 543-552.
Blaise, J.Y., Dudek, I., 2008. “Profiling artefact changes: a
methodological proposal for the classification and
visualisation of architectural transformations” In
Digital Heritage, Proceedings of VSMM 2008 -
Virtual Systems and Multimedia, Archeolingua, 349-
356.
Blaise, J.Y., Dudek, I., 2012. “Analyzing Alternative
Scenarios of Evolution in Heritage Architecture:
Modelling and Visualization Challenges.” In Journal
of Multimedia Processing and Technologies, Vol. 3,
no. 1: 29-48.
Aigner, W., Miksch, S., Schumann, H., Tominski, C.,
2011. Visualization of Time-Oriented Data
. Human-
Computer Interaction Series Springer-Verlag: London.
Korzybski, A., 1951. “The role of language in the
perceptual processes”, In Perception: An Approach To
Personality, edited by Blake R., Ramsey G., 170-205.
New York: The Ronald Press Company.
Tufte, E.R., 2001. Envisioning information. Graphics
Press : Cheshire.
KDIR 2016 - 8th International Conference on Knowledge Discovery and Information Retrieval
32
