
Classification Confusion within NEFCLASS Caused by Feature Value
Skewness in Multi-dimensional Datasets
Jamileh Yousefi
1
and Andrew Hamilton-Wright
1,2
1
School of Computer Science (SOCS), University of Guelph, Guelph, Ontario, Canada
2
Department of Mathematics and Computer Science, Mount Allison University, Sackville, NB, Canada
Keywords:
Fuzzy, Discretization, Neurofuzzy, Classification, Skewness, NEFCLASS.
Abstract:
This paper presents a model for the treatment of skewness effects on the accuracy of the NEFCLASS classifier
by changing the embedded discretization method within the classifier. NEFCLASS is a common example of the
construction of a neuro-fuzzy system. The popular NEFCLASS classifier exhibits surprising behaviour when
the feature values of the training and testing data sets exhibit significant skew. As skewed feature values are
commonly observed in biological data sets, this is a topic that is of interest in terms of the applicability of such
a classifier to these types of problems. From this study it is clear that the effect of skewness on classification
accuracy is significant, and that this must be considered in work dealing with skewed data distributions. We
compared accuracy of NEFCLASS classifier with two modified versions of NEFCLASS embedded with MME
and CAIM discretization methods. From this study it is found the CAIM and MME discretization methods
results in greater improvements in the classification accuracy of NEFCLASS as compared to using the original
EQUAL-WIDTH technique NEFCLASS uses by default.
1 INTRODUCTION
Data distributions in machine learning, when they are
discussed at all, are generally expected to have a sym-
metric distribution, with a central tendency, if not ac-
tually being normally distributed. When the feature
values of data are skewed, however, issues arise hav-
ing to do with the relative scarcity of sample values in
the tails of the distribution relative to the abundance
of data near the median.
Several studies (Chittineni and Bhogapathi, 2012;
Liu et al., 2008; Mansoori et al., 2007; Tang and Chiu,
2004; Au et al., 2006; Peker, 2011; Changyong et al.,
2014; Qiang and Guillermo, 2015) have examined the
question of transforming the data when incorporat-
ing the distribution of input data into the classifica-
tion system in order to more closely approximate nor-
mally distributed data. Very few studies (Mansoori
et al., 2007; Liu et al., 2008; Zadkarami and Rowhani,
2010; Hubert and Van der Veeken, 2010) addressed
these issues while focusing on some alternative to a
data transformation approach.
Data transformation is a common preprocessing
step to treat the skewness and improve dataset nor-
mality. However, in the biological and biomedical
domain, data transformation interferes with the trans-
parency of the decision making process, and can lead
to the exclusion of important information from the de-
cision making process, and affect the system’s ability
to correctly classify the case. Therefore, rather than
transformation of the data to achieve a more normally
distributed input, in this paper we directly investigate
and report the NEFCLASS classifier’s behaviour when
dealing with distribution of data with skewed feature
values.
The choice of discretization technique is known
to be one of the important factors that might af-
fect the classification accuracy of a classifier. NEF-
CLASS classifiers use an EQUAL-WIDTH discretiza-
tion method to divide the observed range of continu-
ous values for a given feature into equally sized fuzzy
intervals, overlapping by half of the interval width.
EQUAL-WIDTH discretization does not take the class
information into account, which, as we show here, re-
sults in a lower classification accuracy for NEFCLASS
classifier than other techniques, especially when the
feature values of the training and testing data sets ex-
hibit significant skew. Dealing with skewness without
performing a transformation will provide greater clar-
ity in interpretation, and by extension better classifi-
cation transparency, as the projection incurred by the
transformation does not need to be taken into account
Yousefi, J. and Hamilton-Wright, A.
Classification Confusion within NEFCLASS Caused by Feature Value Skewness in Multi-dimensional Datasets.
DOI: 10.5220/0006033800210029
In Proceedings of the 8th International Joint Conference on Computational Intelligence (IJCCI 2016) - Volume 2: FCTA, pages 21-29
ISBN: 978-989-758-201-1
Copyright
c
2016 by SCITEPRESS – Science and Technology Publications, Lda. All rights reserved
21
in interpretation.
We provide a study based on an easily repro-
ducible synthetic data distributions, in order to allow
deeper insights into the data analysis. We argue that
the skewed data, in terms of feature value distribu-
tion, cause a higher misclassification rate in classi-
fication learning algorithms. We further argue that
distribution sensitive discretization methods such as
CAIM and MME result in greater improvements in
the classification accuracy of the NEFCLASS classi-
fier as compared to using the original EQUAL-WIDTH
technique.
The next section of this paper contains a short re-
view of the NEFCLASS classifier and three discretiza-
tion methods that will be used to perform the clas-
sification task is presented. Section 3 describes the
methodology of our study, and in section 4 the ex-
perimental results and statistical analysis are given.
Finally, conclusions are presented.
2 BACKGROUND
2.1 Discretization
A discretization process divides a continuous numeri-
cal range into a number of covering intervals where
data falling into each discretized interval is treated
as being describable by the same nominal value in
a reduced complexity discrete event space. In fuzzy
work, such intervals are then typically associated with
the support of fuzzy sets, and the precise placement in
the interval is mapped to the degree of membership in
such a set.
Discretization methods are categorized into super-
vised and unsupervised algorithms. EQUAL-WIDTH
intervals (Chemielewski and Grzymala-Busse, 1996),
EQUAL-FREQUENCY intervals, such as k-means
clustering (Monti and Cooper, 1999), and Marginal
Maximum Entropy (Chau, 2001; Gokhale, 1999) are
examples of algorithms for unsupervised discretiza-
tion. Maximum entropy (Bertoluzza and Forte, 1985),
ChiMerge (Kerber, 1992), CAIM (Kurgan and Cios,
2004), and URCAIM (Cano et al., 2016) are some ex-
amples of supervised algorithms that take class label
assignment in a training data set into account when
constructing discretization intervals.
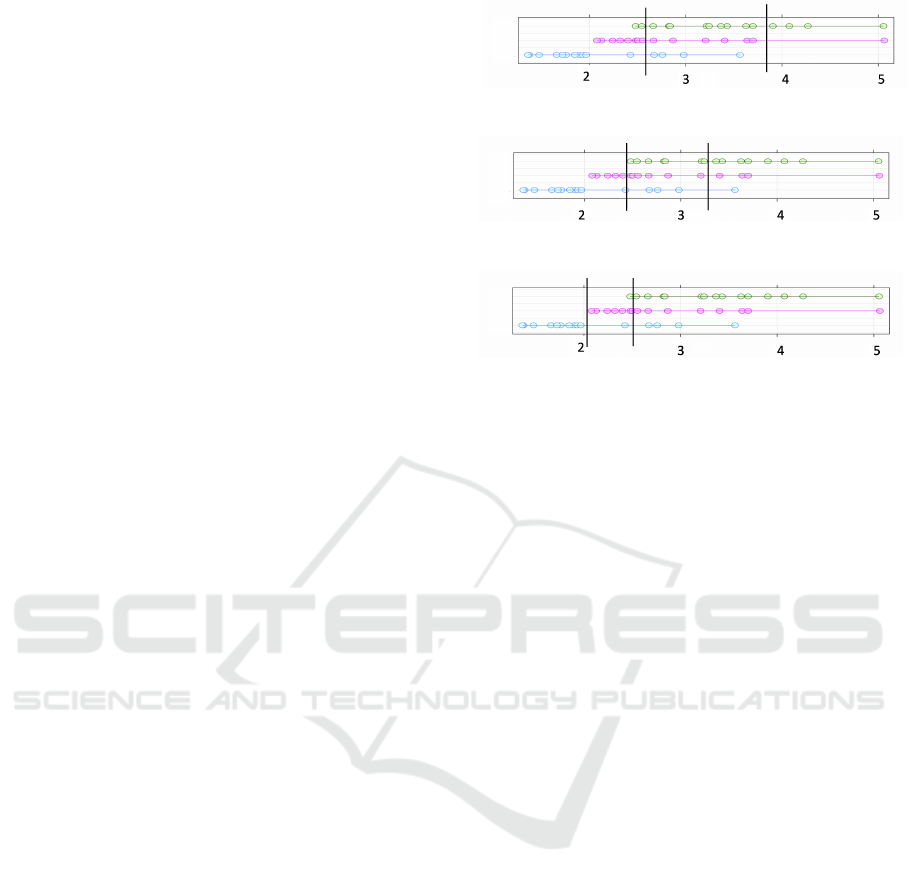
In the following discussion, the three discretiza-
tion methods, that we have chosen for the experi-
ments are described. To demonstrate the partitioning
we used a skewed dataset with 45 training instances
and three classes, with sample discretizations shown
Fig. 1. The subfigures within Fig. 1 each show the
same data, with the green, red and blue rows of dots
(a) EQUAL-WIDTH
(b) MME
(c) CAIM
Figure 1: Three discretization techniques result in different
intervals produced on the same three-class data set.
(top, middle and bottom) within each figure describ-
ing the data for each class in the training data.
2.1.1 EQUAL-WIDTH
The EQUAL-WIDTH discretization algorithm divides
the observed range of continuous values for a given
feature into a set number of equally sized intervals,
providing a simple mapping of the input space that is
created independent of both the distribution of class
and of the density of feature values within the input
space (Kerber, 1992; Chemielewski and Grzymala-
Busse, 1996).
Fig. 1a demonstrates the partitioning using
EQUAL-WIDTH intervals; note that there is no clear
relation between classes and intervals, and that the in-
tervals shown have different numbers of data points
within each (21, 19 and 5 in this case).
2.1.2 MME
Marginal Maximum Entropy, or MME, based dis-
cretization (Chau, 2001; Gokhale, 1999) divides the
dataset into a number of intervals for each feature,
where the number of points is equal for all of the
intervals, under the assumption that the information
of each interval is expected to be equal. Fig. 1b
shows the MME intervals for the example three-class
dataset. Note that the intervals in Fig. 1b do not
cover the same fraction of the range of values (i.e., the
widths differ), being the most dense in regions where
there are more points. The same number of points
(15) occur in each interval.
FCTA 2016 - 8th International Conference on Fuzzy Computation Theory and Applications
22
2.1.3 CAIM
CAIM (class-attribute interdependence maximiza-
tion) discretizes the observed range of a feature into
a class-based number of intervals and maximizes
the inter-dependency between class and feature val-
ues (Kurgan and Cios, 2004). CAIM discretiza-
tion algorithm divides the data space into partitions,
which leads to preserve the distribution of the original
data (Kurgan and Cios, 2004), and obtain decisions
less biased to the training data.
Fig. 1c shows the three CAIM intervals for our
sample data set. Note how the placement of the dis-
cretization boundaries is closely related to the points
where the densest portion of the data for a particular
class begins or ends.
2.2 NEFCLASS Classifier
NEFCLASS (Nauck et al., 1996; Nauck and Kruse,
1998; Klose et al., 1999) is a neuro-fuzzy classifier
that tunes a set of membership functions that describe
input data and associates these through a rule set with
a set of potential class labels. Training is done in a
supervised fashion based on a training data set.
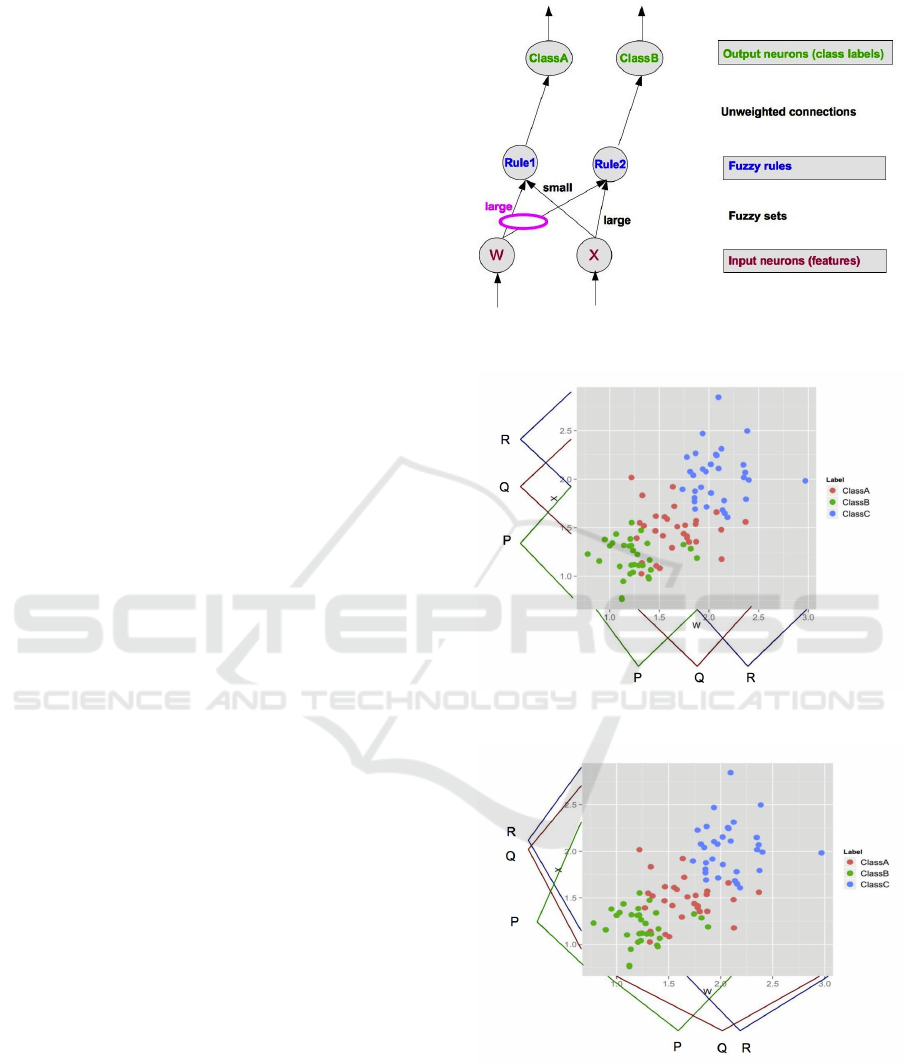
Fig. 2 shows a NEFCLASS model that classifies
input data with two features into two output classes
by using three fuzzy sets and two fuzzy rules. In-
put features are supplied to the nodes at the bottom
of the figure. These are then fuzzified, using a num-
ber of fuzzy sets. The sets used by a given rule are
indicated by linkages between input nodes and rule
nodes. If the same fuzzy set is used by multiple rules,
these links are shown passing through an oval, such
as the one marked “large” in Fig. 2. Rules directly
imply an output classification, so these are shown
by unweighted connections associating a rule with
a given class. Multiple rules may support the same
class, however that is not shown in this diagram. Rule
weightings are computed based on the degree of asso-
ciation between an input fuzzy membership function
and the rule (calculated based on the degree of associ-
ation in the training data), as well as the level of acti-
vation of the fuzzy membership function, as is typical
in a fuzzy system (Mendel, 2001, Chapter 1).
In Fig. 3a, a set of initial fuzzy membership func-
tions describing regions of the input space are shown,
here for a two-dimensional problem in which the
fuzzy sets are based on the initial discretization pro-
duced by the EQUAL-WIDTH algorithm. As will be
demonstrated, NEFCLASS functions work best when
these regions describe regions specific to each in-
tended output class, as is shown here, and as is de-
scribed in the presentation of a similar figure in the
Figure 2: A NEFCLASS model with two inputs, two rules,
and two output classes.
(a) Initial fuzzy set membership functions in NEFCLASS, pro-
duced using EQUAL-WIDTH discretization
(b) Results of tuning the above membership functions to bet-
ter represent class/membership function information
Figure 3: Fuzzy membership functions before and after
training data based tuning using the NEFCLASS algorithm.
classic work describing this classifier (Nauck et al.,
1996, pp. 239).
As is described in the NEFCLASS overview pa-
Classification Confusion within NEFCLASS Caused by Feature Value Skewness in Multi-dimensional Datasets
23

per (Nauck and Kruse, 1998, pp. 184), a relationship
is constructed through training data based tuning to
maximize the association of the support of a single
fuzzy set with a single outcome class. This implies
both that the number of fuzzy sets must match the
number of outcome classes exactly, and in addition,
that there is an assumption that overlapping classes
will drive the fuzzy sets to overlap as well.
Fig. 3a shows the input membership functions as
they exist before membership function tuning, when
the input space is partitioned into EQUAL-WIDTH
fuzzy intervals.
Fig. 3b demonstrates that during the fuzzy set tun-
ing process, the membership function is shifted and
the support is reduced or enlarged, in order to better
match the coverage of the data points belonging to
the associated class, however as we will see later, this
process is strongly informed by the initial conditions
set up by the discretization to produce the initial fuzzy
membership functions.
3 METHODOLOGY
This paper has two objectives. The first is to char-
acterize how the NEFCLASS classification accuracy
degrades as data skewness increases. The second
is to evaluate alternative discretization methods to
counteract the performance problems in skewed data
domains. To support this second goal we will
evaluate maximum marginal entropy (MME) (Chau,
2001; Gokhale, 1999) and the supervised, class-
dependent discretization method CAIM (Kurgan and
Cios, 2004).
We carried out two different set of experiments. In
the first experiment, denoted as the effect of skewness
of feature values, we evaluate unmodified NEFCLASS
behaviour when dealing with different level of skew-
ness.
In the second experiment, denoted as the effect of
discretization, we investigate the classification accu-
racy of a modified NEFCLASS classifier upon employ-
ing the three different discretization techniques. The
MME and CAIM methods are not part of the stan-
dard NEFCLASS implementation, therefore we im-
plemented two modified versions of NEFCLASS clas-
sifier, each utilizing one of these two discretization
methods. Experiments were then performed on syn-
thesized datasets with different levels of feature val-
ues skewness.
Results from the experiments are presented in
terms of misclassification rates, which are equal to the
number of misclassified data instances divided by the
total number of instances in the testing dataset.
3.1 Datasets
Three synthesized datasets were used for experi-
ments. All the synthesized data sets used describe
classification problems within a 4-dimensional data
space containing distributions of data from three sep-
arate classes.
Our data was produced by randomly generating
numbers following the F-distribution with different
degrees of freedom chosen to control skew. The F-
distribution (Natrella, 2003) has been chosen as the
synthesis model because the degree of skew within
an F-distribution is controlled by the pairs of degrees
of freedom specified as a pair of distribution control
parameters. This allows for a spectrum of skewed
data distributions to be constructed. We designed
the datasets to present different levels of skewness
with increasing skew levels. Three pairs of degrees
of freedom parameters have been used to generate
datasets with different levels of skewness, including
low, medium, and high-skewed feature values. After
initial experiments datasets with degrees of freedom
(100, 100) was chosen to provide data close to a nor-
mal distribution, (100, 20) provides moderate skew,
and (35, 8) provides high skew.
A synthesized data set consisting of 1000 ran-
domly generated examples consisting of four-feature
(W , X , Y , Z) F-distribution data for each of three
classes was created. The three classes (ClassA,
ClassB and ClassC) overlap, and are skewed in the
same direction. The size of datasets were designed to
explore the effect of skewness when enough data is
available to clearly ascertain data set properties. Ten-
fold cross validation was used to divide each dataset
into training (2700) and testing (300 point) sets in
which an equal number of each class is represented.
We have taken care to ensure that all datasets used
have a similar degree of overlap, and same degree of
variability.
Fig. 4 shows the skewness of each dataset for
each feature. From these figures one can see that the
LOW-100,100 data is relatively symmetric, while the
MED-100,20 and HIGH-35,8 data show an increas-
ing, and ultimately quite dramatic, skew.
4 RESULTS AND DISCUSSION
4.1 The Effect of Skewness on
Classification Accuracy
In this section, we discuss how feature value skewness
affects the classification accuracy of the NEFCLASS
FCTA 2016 - 8th International Conference on Fuzzy Computation Theory and Applications
24
W X Y Z
Skewness Value
0 1 2 3 4
ClassA
ClassB
ClassC
(a) LOW-100,100
W X Y Z
Skewness Value
0 1 2 3 4
ClassA
ClassB
ClassC
(b) MED-100,20
W X Y Z
Skewness Value
0 1 2 3 4
ClassA
ClassB
ClassC
(c) HIGH-35,8
Figure 4: Skewness by label and feature for the three syn-
thetic datasets.
classifier. We begin by applying the NEFCLASS clas-
sifier to the synthesized datasets with our three differ-
ent levels of skewness: low, medium, and high. Our
null hypothesis is that the misclassification rate ob-
served for NEFCLASS are equal in all three datasets.
As mentioned earlier, NEFCLASS will attempt to
tune the fuzzy membership functions provided by the
initial EQUAL-WIDTH discretization to associate the
support of each fuzzy set unambiguously with a single
class. As our skewed data sets overlap substantially,
this is a difficult task for the NEFCLASS classifier.
Figs. 5 and 6 show the relationship between the
distribution of input data values in feature X, and the
placement of the final membership function by the
NEFCLASS classifier when using the EQUAL-WIDTH
discretization method for the three datasets LOW-
100,100, MED-100,20 and HIGH-35,8.
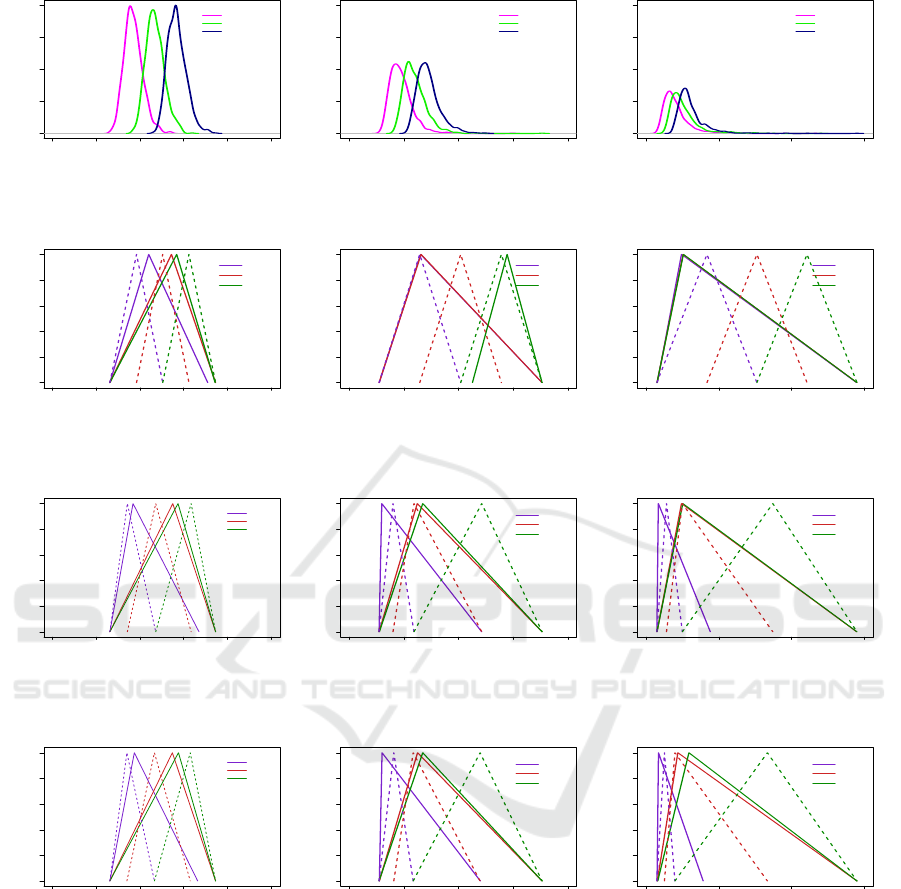
Figs. 5a, 5b, and 5c illustrate the density functions
for the LOW-100,100, MED-100,20 and HIGH-35,8
data sets, respectively. As can be seen in 5a, the fea-
ture values in this case are centrally tended and gen-
erally symmetric, providing an approximation of a
Normal distribution, though observable skew is still
present, as shown in Fig. 4a. In Fig. 5b, tails are ob-
servable as the mean of feature values are pulled to-
wards the right while the median values remain sim-
ilar to those in 5a, for a moderately skewed distribu-
tion. In Fig. 5c, the feature values exhibit longer tails
than normal, indicating a highly skewed distribution.
Fig. 5 and 6 allows comparison between a data
distribution and the representation of fuzzy sets for
this feature in this distribution, displayed immediately
below. For example, Fig. 5a can be compared with
Fig. 6a. Similar vertical comparisons are able to be
made for Figs. 5b and 5c.
Fig. 6a illustrates the placement of initial fuzzy
sets and final membership functions with the EQUAL-
WIDTH discretization method for dataset LOW-
100,100. As can be seen, the same number of fuzzy
sets with equal support are constructed, and after tun-
ing the membership functions are shifted and the sup-
ports are reduced or enlarged, in order to better match
the distribution of class-specific feature values. The
dotted line indicates the initial fuzzy sets and the solid
line indicates the final placement of the fuzzy sets.
Fuzzy sets have been given the names “P”, “Q”
and “R” in these figures, rather than more tradi-
tional linguistic labels such as “small”, “medium” and
“large” because of the placement associations with
the classes, and the assignment of class names to
fuzzy sets lies within the NEFCLASS training algo-
rithm, and is not under user control. For this reason,
it is not possible to assign names a priori that have any
linguistic meaning. The choices NEFCLASS makes in
terms of which fuzzy set is used to represent a partic-
ular class is part of the underlying performance issue
explored in this paper, as will be shown.
As one can see in comparing Fig. 6a with 5a,
NEFCLASS has chosen to associate fuzzy set P with
ClassB, set Q with ClassA, and fuzzy set R with
ClassC based on this EQUAL-WIDTH initial dis-
cretization. The associations are not as clear with data
exhibiting higher skew, as shown in Figs. 6b and 6c, in
which NEFCLASS is attempting to set two, and then
three, fuzzy membership functions to essentially the
Classification Confusion within NEFCLASS Caused by Feature Value Skewness in Multi-dimensional Datasets
25
0 1 2 3 4 5
0.0 0.5 1.0 1.5 2.0
ClassA
ClassB
ClassC
(a) LOW-100,100
0 2 4 6 8
0.0 0.5 1.0 1.5 2.0
ClassA
ClassB
ClassC
(b) MED-100,20
0 5 10 15
0.0 0.5 1.0 1.5 2.0
ClassA
ClassB
ClassC
(c) HIGH-35,8
Figure 5: Density plots for feature X for all datasets.
0 1 2 3 4 5
0.0 0.2 0.4 0.6 0.8 1.0
P
Q
R
(a) LOW-100,100
0 2 4 6 8
0.0 0.2 0.4 0.6 0.8 1.0
P
Q
R
(b) MED-100,20
0 5 10 15
0.0 0.2 0.4 0.6 0.8 1.0
P
Q
R
(c) HIGH-35,8
Figure 6: Fuzzy Sets and Membership Functions constructed by EQUAL-WIDTH for feature X of all datasets.
0 1 2 3 4 5
0.0 0.2 0.4 0.6 0.8 1.0
P
Q
R
(a) LOW-100,100
0 2 4 6 8
0.0 0.2 0.4 0.6 0.8 1.0
P
Q
R
(b) MED-100,20
0 5 10 15
0.0 0.2 0.4 0.6 0.8 1.0
P
Q
R
(c) HIGH-35,8
Figure 7: Fuzzy Sets and Membership Functions constructed by MME for feature X of all datasets.
0 1 2 3 4 5
0.0 0.2 0.4 0.6 0.8 1.0
P
Q
R
(a) LOW-100,100
0 2 4 6 8
0.0 0.2 0.4 0.6 0.8 1.0
P
Q
R
(b) MED-100,20
0 5 10 15
0.0 0.2 0.4 0.6 0.8 1.0
P
Q
R
(c) HIGH-35,8
Figure 8: Fuzzy Sets and Membership Functions constructed by CAIM for feature X of all datasets.
same support and with the same central peak. This,
of course, limits or entirely destroys the information
available to the rule based portion of the system, and
is therefore unsurprisingly correlated with a higher
number of classification errors.
The analysis of fuzzy sets and memberships for
feature X in dataset LOW-100,100 shows that all of
three fuzzy sets are expanded in terms of their sup-
port. As shown in Fig. 6a, the support of fuzzy sets
Q and R share identical support, as defined by the ob-
served range of the training data. In addition, sets
Q and R are defined by a nearly identical maximum
point, rendering the distinction between them moot.
Similarly, in Fig. 6b, we observe identical maxima
and support for sets P and Q, however R is set apart
with a different, but substantially overlapping, sup-
port and a clearly distinct maxima.
This confusion gets only more pronounced as the
degree of skew increases, as is clear in Fig. 6c, rep-
resenting the fuzzy sets produced for HIGH-35,8, in
which all fuzzy sets P, Q and R share identical sup-
port defined by the range of the observed data. In
FCTA 2016 - 8th International Conference on Fuzzy Computation Theory and Applications
26

Table 1: Mean and standard deviation of misclassification rates and median of number of rules for each classifier trained on
three synthesized dataset.
Discretization Dataset
LOW-100,100 MED-100,20 HIGH-35,8
Mean and SD for
Misclassification Rates
EQUAL-WIDTH 22.63 ± 1.07 65.30 ± 3.38 63.07 ± 6.77
MME 25.67 ± 1.85 33.73 ± 1.64 42.30 ± 2.78
CAIM 24.13 ± 2.72 34.30 ± 1.52 42.37 ± 3.08
Median for
Number of Rules
EQUAL-WIDTH 49.00 34.50 15.00
MME 44.00 50.00 46.00
CAIM 53.50 51.50 45.00
Table 2: M-W-W results comparing the misclassification rates based on level of skew.
LOW-100,100 MED-100,20
Discretization vs. vs.
MED-100,20 HIGH-35,8 HIGH-35,8
EQUAL-WIDTH 2.9 × 10
−11
∗ 2.9 × 10
−11
∗ .9300
MME 2.9 × 10
−11
∗ 2.9 × 10
−11
∗ .0001∗
CAIM 2.9 × 10
−11
∗ 2.9 × 10
−11
∗ .0001∗
* significant at 99.9% confidence (p < .001)
addition, all the fuzzy sets in this example are defined
by a nearly identical maximum point.
It is perhaps surprising that difference in the pro-
portion of data in the tails of the distribution are not
represented more directly here, however this is largely
due to the fact that the EQUAL-WIDTH discretization
technique is insensitive to data density, concentrating
instead purely on range.
Table 1 reports the misclassification rates (as mean
± standard deviation), as well as the median number
of fuzzy rules obtained by each classifier, using each
discretization technique, and for each dataset. The re-
sults have been calculated over the 10 cross-validation
trials. As shown in Table 1, LOW-100,100 achieved
the lowest misclassification rate and the lowest vari-
ability. The results also show considerably larger
variability in the misclassification rate of HIGH-35,8,
compared to MED-100,20. The decrease in the
number of rules produced using the EQUAL-WIDTH
method shows that less information is being captured
about the data set as skewness increases. As there
is no reason to assume that less information will be
required to make a successful classification, this de-
crease in the number of rules is therefore an contribut-
ing cause for the increase in the misclassification rate
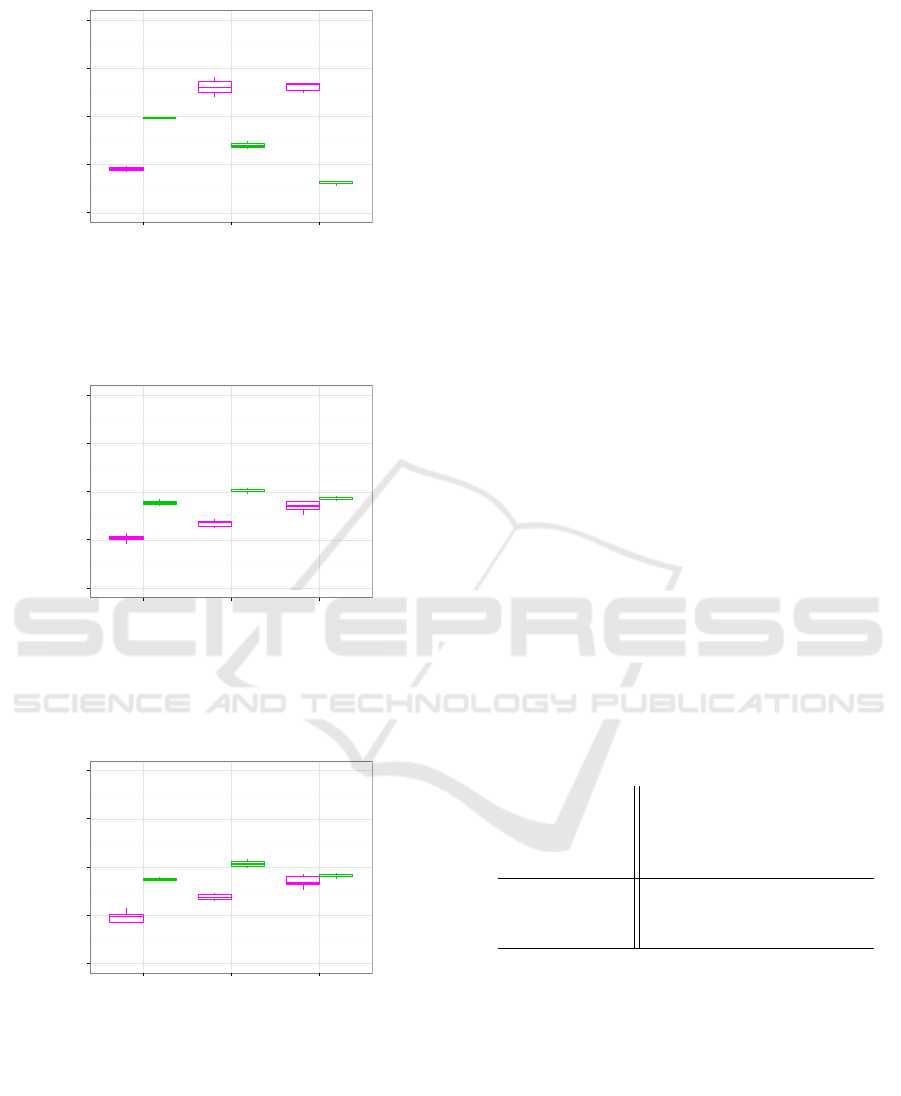
noted for EQUAL-WIDTH in Figs 9a.
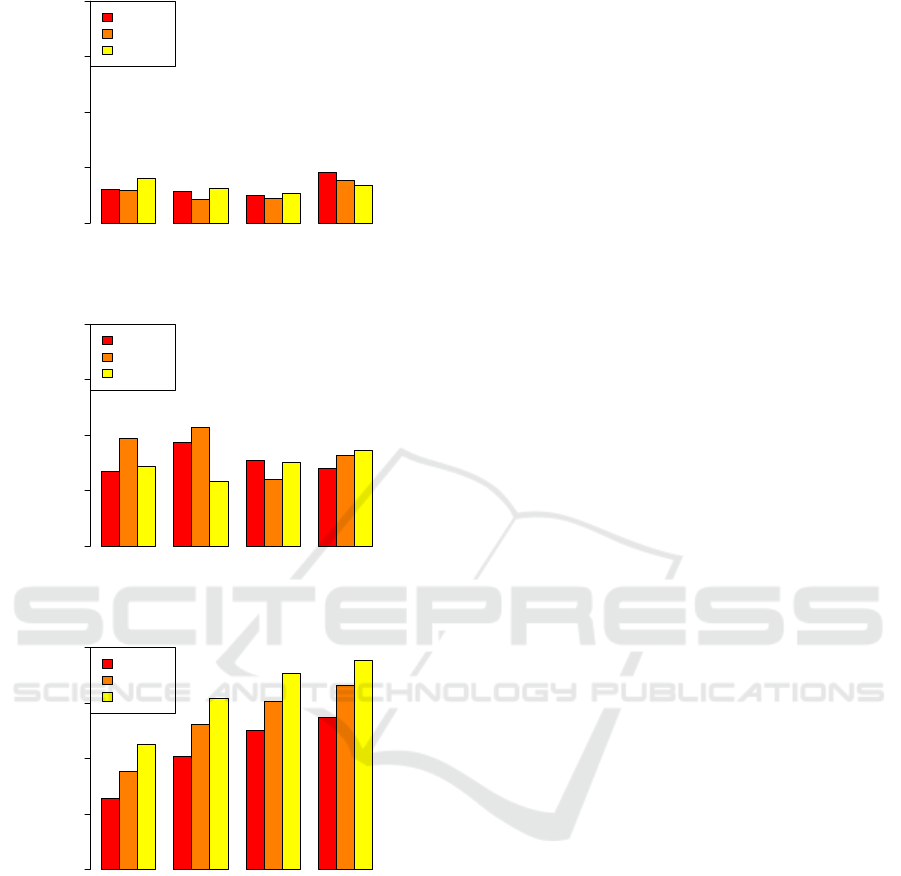
Fig. 9 shows a graphical summary of the differ-
ences between the misclassification rates and number
of rules observed for each discretization method.
An exploration of the normality of the distribu-
tion of misclassification rates using a Shapiro-Wilks
test found that a non-parametric test was appropri-
ate in all cases. To explore the statistical validity
of the differences between observed misclassification
rates of NEFCLASS classifiers for different data sets
and using different discretization techniques, Mann-
Whitney-Wilcoxon (M-W-W) tests were performed.
By running a M-W-W test on the misclassifica-
tion rates for each pair of skewed data sets, the results
shown in Table 2 were obtained. The M-W-W test re-
sults shows that there is a significant difference for al-
most all levels of skewness, the only exceptions being
the MED-100,20 and HIGH-35,8 distributions when
the EQUAL-WIDTH discretization method has been
used. We therefore reject the null hypothesis and con-
clude that the NEFCLASS classification accuracy was
significantly affected by feature value skewness in the
majority of cases.
4.2 The Effect of Discretization
Methods
In this section, we investigate how the choice of dis-
cretization method affects the classification accuracy
of a NEFCLASS based classifier, when dealing with
datasets with various degrees of skew. We compare
the results for our new NEFCLASS implementations
using MME and CAIM with the results of the de-
fault EQUAL-WIDTH discretization strategy. The null
hypothesis is that there will be no difference in the ob-
served misclassification rates.
Fig. 7 illustrates the placement of initial fuzzy sets
and final membership functions when using the MME
discretization method for each of the three datasets.
As can be seen in this figure, the same number of
Classification Confusion within NEFCLASS Caused by Feature Value Skewness in Multi-dimensional Datasets
27
●
●
●
●●
●
●
0
25
50
75
100
1. Low−100_100
2. Medium−100_20
3. High−35_8
(a) EQUAL-WIDTH
0
25
50
75
100
1. Low−100_100
2. Medium−100_20
3. High−35_8
(b) MME
●●
●
0
25
50
75
100
1. Low−100_100
2. Medium−100_20
3. High−35_8
(c) CAIM
Figure 9: Summary of misclassification rates and number
of rules for EQUAL-WIDTH, MME and CAIM.
fuzzy sets with unequal support are constructed. Sim-
ilarly, in Fig. 8, the fuzzy membership functions pro-
duced using CAIM discretization are shown. The
CAIM algorithm constructed three fuzzy sets for all
features for our test data, however as the algorithm
is free to choose a differing number of discretiza-
tion intervals based on the observed data (Kurgan and
Cios, 2004), for other applications this may vary from
feature to feature. All fuzzy sets generated had dis-
tinct support, range, and a different centre value defin-
ing the triangular membership functions, though there
was still a strong degree of similarity between some
sets, as shown in the representative data displayed in
Fig. 8.
As shown in Figs. 7 and 8, the final placement
of support for fuzzy the first membership function,
P, is different from the support for Q and R, in con-
trast with the very similar fuzzy set definitions of
EQUAL-WIDTH shown in Fig. 6. This will preserve a
greater degree of differentiation between the informa-
tion captured in each fuzzy set. A comparison be-
tween the results for MME and CAIM for HIGH-
35,8 (not shown graphically in the paper) indicated
that the choice of the triangular membership functions
produced by CAIM for HIGH-35,8 were slightly dif-
ferent, but the choice of the triangular membership
functions produced by MME were nearly identical.
As the difference between the support of the fuzzy
membership functions and the centre points increases,
the learning phase is more able to create meaningful
new rules. This therefore leads to a lower number
of classification errors. The larger number of rules
generated by MME and CAIM for MED-100,20 and
HIGH-35,8 is summarized in Table 1.
Table 3: M-W-W results comparing the misclassification
rates based on discretization method.
EQUAL-WIDTH MME
Dataset vs. vs.
MME CAIM CAIM
LOW-100,100 .0020∗ .2500 .1600
MED-100,20 .0001∗ .0001∗ .5000
HIGH-35,8 .0001∗ .0001∗ .9100
* significant at 99.9% confidence (p < .001)
As shown in Table 3, M-W-W results identify
the significance of the difference in misclassification
rates for EQUAL-WIDTH versus MME and CAIM at
medium and high skew, where very low p values are
computed. In the case of LOW-100,100, a signifi-
cant difference is observed when comparing EQUAL-
WIDTH to MME, however with a significantly greater
p value (.002). Note that there is no significant differ-
ence in misclassification performance between MME
and CAIM.
FCTA 2016 - 8th International Conference on Fuzzy Computation Theory and Applications
28

5 CONCLUSIONS
The results of this study indicate that the NEFCLASS
classifier performs increasingly poorly as data feature
value skewness increases. Further, this study indi-
cates that the choice of initial discretization method
affects the classification accuracy of NEFCLASS clas-
sifier, and that this effect is very strong in skewed data
sets. Utilizing MME or CAIM discretization meth-
ods in the NEFCLASS classifier improved classifica-
tions accuracy.
ACKNOWLEDGEMENTS
The authors gratefully acknowledge the support of
NSERC, the National Sciences and Engineering Re-
search Council of Canada, for ongoing grant support.
REFERENCES
Au, W., Chan, K., and Wong, A. (2006). A fuzzy approach
to partitioning continues attributes for classification.
IEEE Transactions on Knowledge and Data Engineer-
ing, 18:715–719.
Bertoluzza, C. and Forte, B. (1985). Mutual dependence of
random variables and maximum discretized entropy.
The Annals of Probability, 13(2):630–637.
Cano, A., T., N. D., Ventura, S., and Cios, K. J. (2016).
urcaim: improved caim discretization for unbalanced
and balanced data. Soft Computing, 33:173–188.
Changyong, F., Hongyue, W., Naiji, L., Tian, C., Hua, H.,
Ying, L., and Xin, M. (2014). Log-transformation and
its implications for data analysis. Shanghai Arch Psy-
chiatry, 26(2):105–109.
Chau, T. (2001). Marginal maximum entropy partition-
ing yields asymptotically consistent probability den-
sity functions. IEEE Transactions on Pattern Analysis
and Machine Intelligence, 23(4):414–417.
Chemielewski, M. R. and Grzymala-Busse, J. W. (1996).
Global discretization of continuous attributes as pre-
processing for machine learning. International Jour-
nal of Approximate Reasoning, 15:319–331.
Chittineni, S. and Bhogapathi, R. B. (2012). A study on the
behavior of a neural network for grouping the data.
International Journal of Computer Science, 9(1):228–
234.
Gokhale, D. V. (1999). On joint and conditional entropies.
Entropy, 1(2):21–24.
Hubert, M. and Van der Veeken, S. (2010). Robust classi-
fication for skewed data. Advances in Data Analysis
and Classification, 4:239–254.
Kerber, R. (1992). ChiMerge discretization of numeric at-
tributes. In Proceedings of AAAI-92, pages 123–12,
San Jose Convention Center, San Jose, California.
Klose, A., N
¨
urnberger, A., and Nauck, D. (1999). Im-
proved NEFCLASS pruning techniques applied to a
real world domain. In Proceedings Neuronale Netze
in der Anwendung, University of Magdeburg. NN’99.
Kurgan, L. A. and Cios, K. (2004). CAIM discretization al-
gorithm. IEEE Transactions on Knowledge and Data
Engineering, 16:145–153.
Liu, Y., Liu, X., and Su, Z. (2008). A new fuzzy approach
for handling class labels in canonical correlation anal-
ysis. Neurocomputing, 71:1785–1740.
Mansoori, E., Zolghadri, M., and Katebi, S. (2007). A
weighting function for improving fuzzy classifica-
tion systems performance. Fuzzy Sets and Systems,
158:588–591.
Mendel, J. M. (2001). Uncertain Rule-Based Fuzzy Logic
Systems. Prentice-Hall.
Monti, S. and Cooper, G. (1999). A latent variable model
for multivariate discretization. In The Seventh Interna-
tional Workshop on Artificial Intelligence and Statis-
tics, pages 249–254, Fort Lauderdale, FL.
Natrella, M. (2003). NIST SEMATECH eHandbook of Sta-
tistical Methods. NIST.
Nauck, D., Klawonn, F., and Kruse, R. (1996). Neuro-Fuzzy
Systems. John Wiley and Sons Inc., New York.
Nauck, D. and Kruse, R. (1998). NEFCLASS-X – a soft
computing tool to build readable fuzzy classifiers. BT
Technology Journal, 16(3):180–190.
Peker, N. E. S. (2011). Exponential membership func-
tion evaluation based on frequency. Asian Journal of
Mathematics and Statistics, 4:8–20.
Qiang, Q. and Guillermo, S. (2015). Learning transforma-
tions for clustering and classification. Journal of Ma-
chine Learning Research, 16:187–225.
Tang, Y. and Chiu, C. (2004). Function approximation via
particular input space partition and region-based ex-
ponential membership functions. Fuzzy Sets and Sys-
tems, 142:267–291.
Zadkarami, M. R. and Rowhani, M. (2010). Application of
skew-normal in classification of satellite image. Jour-
nal of Data Science, 8:597–606.
Classification Confusion within NEFCLASS Caused by Feature Value Skewness in Multi-dimensional Datasets
29
