
Performance Analysis of Basketball Referees by Machine Learning
Techniques
Sheng-Wei Wang
1
and Wen-Wei Hsieh
2
1
Department of Applied Informatics, Fo Guang University, No. 160, Linwei Rd., Jiaoshi Township, Yilan, Taiwan, R.O.C.
2
Office of Physical Education, National Tsing Hua University,
No. 1, Section 2, Kuang-Fu Rd., East District, Hsinchu City, Taiwan, R.O.C.
Keywords:
Basketball Referee, Performance Analysis, Machine Learning, Pocket Algorithm.
Abstract:
Basketball referees are important in a basketball game. In this paper, we analyze the performance of basketball
referees in a game from history data and using the machine learning techniques. The data are collected from
Taiwan Super Basketball League games. Wefirst observed that the teamwork is a key factor to the performance
of referee teams. Furthermore, the degree of teamwork are more important than the personal capabilities.
Then, we derived some classifiers by machine learning algorithms to further analyze the data set. Among the
three classifiers, a classifier named linear classifier using pocket algorithm, which is able to classify the data
points with most correct rate, performs better than the other two classifiers. The classifier also proved the
importance of teamwork is much larger than that of personal capability. In the future, the classifier can be
used to predict the performance of a referee team in a basketball game.
1 INTRODUCTION
Basketball is very popular all over the world. In order
to make the basketball games all over the world be
understood, the International Basketball Federation
(FIBA) published a set of documents for governing
the basketball sport. Among the documents publised
by FIBA, the Official Basketball Rules(FIBA, 2014)
is used to identify and deal with all situations in a bas-
ketball game.
In a basketball game, the referees play an impor-
tant role in officiating the game based on the basket-
ball rules. Originally, there are two referees being as-
signed to a basketball game. The two referees follow
the two men officiating mechanism described in refer-
ees’ manual to administrate a basketball game. How-
ever, when the game becomes faster and more intense,
there are some blind sides when the game is covered
by only two referees.
In 2000, FIBA started using three person offici-
ating(FIBA, 2010b) in the official tournament. Us-
ing three person officiating mechanism may decrease
some blind sides and make the game fairer. However,
some problems may occur because the three referees
may not work well with each other. For example, in a
body contact, the probability that one referee calls the
charging foul and the other calls the block foul will be
larger than that in two persons officiating.
In this paper, we discuss the performance of the
referees in a game with three referees. Intuitively,
three referees with good personal capability may im-
prove the referee team’s performance. However,
good personal capabilities does not necessarily re-
sult in good referees’ performance in a basketball
game(Lazarov, 2007; Carron, 1988). For example,
even though the referees who are selected to Olympic
Games are top FIBA referees whose personal capa-
bilities are definitely best among all referees in the
world, many disputes still occur in Olympic Games.
The main reason is that the referees are from different
countries and not familiar with each other so that they
cannot work together well.
This paper focused on how the degree of team-
work, in this paper we called teamwork capability,
affects the referee team’s performance. We use the
history data to analyze the importance of teamwork
and personal capabilities. Observations are first made
to the raw data and found that the referee team’s per-
formance depends on the teamwork capability very
much. Then, we use the machine learning algorithms
to find some classifiers which are able to classify the
collected data set into good or bad performance. One
Wang, S-W. and Hsieh, W-W.
Performance Analysis of Basketball Referees by Machine Learning Techniques.
DOI: 10.5220/0006031501650170
In Proceedings of the 4th International Congress on Sport Sciences Research and Technology Support (icSPORTS 2016), pages 165-170
ISBN: 978-989-758-205-9
Copyright
c
2016 by SCITEPRESS – Science and Technology Publications, Lda. All rights reserved
165
classfier name linear classifier using pocket algorithm
is able to classify the data with correct rate 68.6%.
The classifier is an evidence that the teamwork ca-
pabilities are more important than the personal capa-
bilities in referee team’s performance. Prediction of
referee’s performance in future games is also an ap-
plication of the classifiers.
The reminder of this paper is organized as follows.
Next section reviews some previous works on how to
improve the teamwork in different areas. Observa-
tions of data are made in Section 3. We then applied
the machine learning techniques to make a classifier
for referee’s performance in Section 4. Finally, some
concluding remarks and applications of this paper are
given.
2 PREVIOUS WORKS
To improve a referee team’s performance, improving
personal capabilities and improving teamwork capa-
bilities are both important. Most previous literatures
only discussed how to improve the personal capabili-
ties of a referee(Helsen and Bultynck, 2004; Hoseini
et al., 2011; Feinstein, 2009; Stern, 2010; Nevill et al.,
2002; Mirjamali et al., 2013; Wang et al., 2013; Stew-
art and Ellery, 2004; Leicht, 2008; Serkan, 2014;
Balmer et al., 2007; Guill´en and Feltz, 2011). On
the other hand, some research efforts have been pro-
posed to improve the teamwork capabilities in differ-
ent areas(Gladstein, 1984; Magyar et al., 2004; Heuze
et al., 2006; Tjosvold, 1988; Austin, 2003). Lazarov
points out the importance of teamwork in officiating
a basketball game (Lazarov, 2007).
In order to improve the teamwork of referees in
a basketball game, FIBA proposes some solutions to
make games proceed fluently without disputes:
• FIBA publishes the referees manual to let referees
all around the world use the same mechanisms in
officiating(FIBA,2010b). By obeyingthe manual,
the referees are able to identify their coverage area
and the dual calls will be reduced.
• FIBA conducts many referees camps and clinics
throughout the world. In the camps and clinics,
new rules and mechanisms are introduced for the
referees.
• In a referees clinic, the candidate of FIBA referees
must pass the English test to become a FIBA ref-
eree(FIBA, 2010a). By English test, the referees
who hope to become a FIBA referee must learn
English so as to communicate with other referees
and the teams which is able to reduce the disputes
and misunderstandings.
1 1.5 2 2.5 3 3.5 4 4.5 5
1
1.5
2
2.5
3
3.5
4
4.5
5
Average Personal Capability (AVG
p
)
Average Teamwork Capability (AVG
t
)
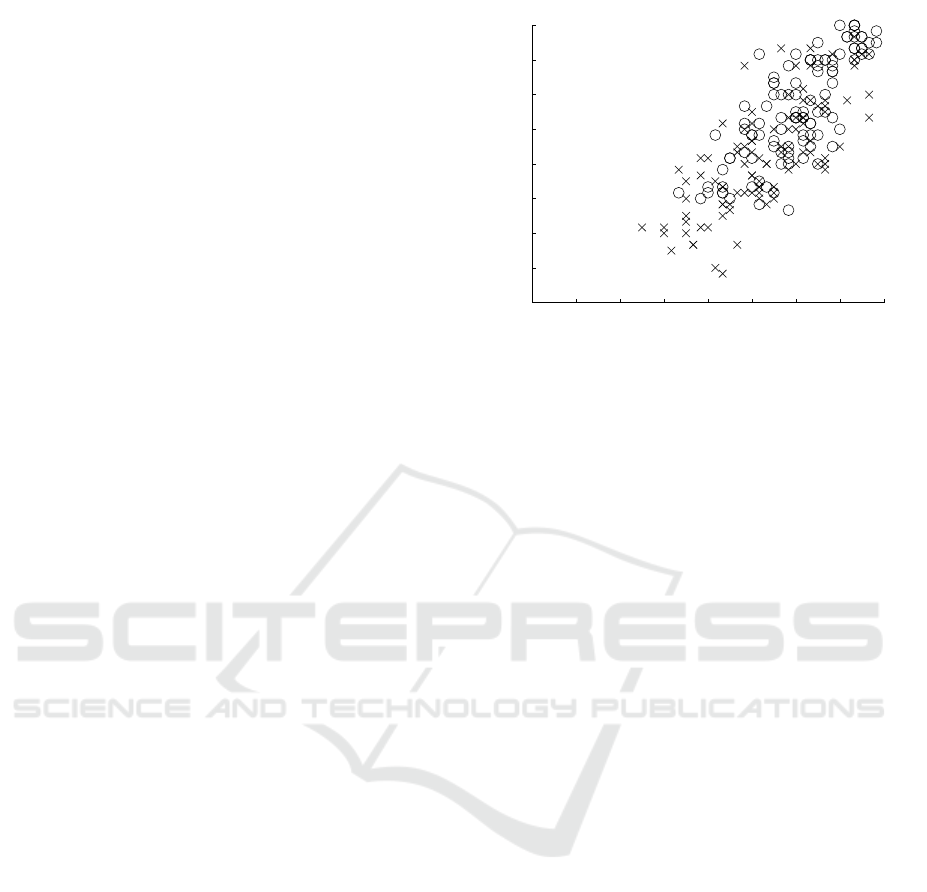
Figure 1: The collected data from 207 Super Basketball
League games in Taiwan.
3 THE HISTORIC DATA
In this section, we first introduce the basic parameters
of the collected data. From the data, we can make
some interesting observations.
3.1 Background Information
In this paper, the data is collectd from the Super Bas-
ketball Leagues in Taiwan from 2013 to 2015 (2 sea-
sons). The number of referees and the number of
games are 49 and 207 respectively. The 49 referees
are top referees in Taiwan and 26 of them are active
or former FIBA referees. A personal capability value
is associated with each referee. The value is from
1 to 5 and is the average of four scores obtained by
4 technical committee members in Taiwan. A team-
work capability value is associated with each pair of
two referees. The value ranges also from 1 to 5 and is
the average of values scored by the same 4 technical
committee members.
In each game, a score is given to each referee
and the score ranges from 1 to 3. Normalization is
applied to the data because different scores may be
given by different committees on the same game. Af-
ter normalization, the average of the scores in each
game is calculated. By our definition, we said a ref-
eree team performs good if the average performance
is larger than or equal to 2.3. The reason we se-
lecting 2.3 as the threshold is that in the 207 games,
the games with good referees performance is approxi-
mately 50%. The referee teams which do not perform
good performanceis said that their performences need
improvement.
We then analyze the referee capabilities in each
game. For each game, the average personal capablity
icSPORTS 2016 - 4th International Congress on Sport Sciences Research and Technology Support
166
2.0~2.5 2.5~3.0 3.0~3.5 3.5~4.0 4.0~4.5 4.5~5.0
0
10
20
30
40
50
60
70
80
Average Personal/Teamwork Capabilities
Percentage of number of games
with good performance
Average Personal Capability
Average Teamwork Capability
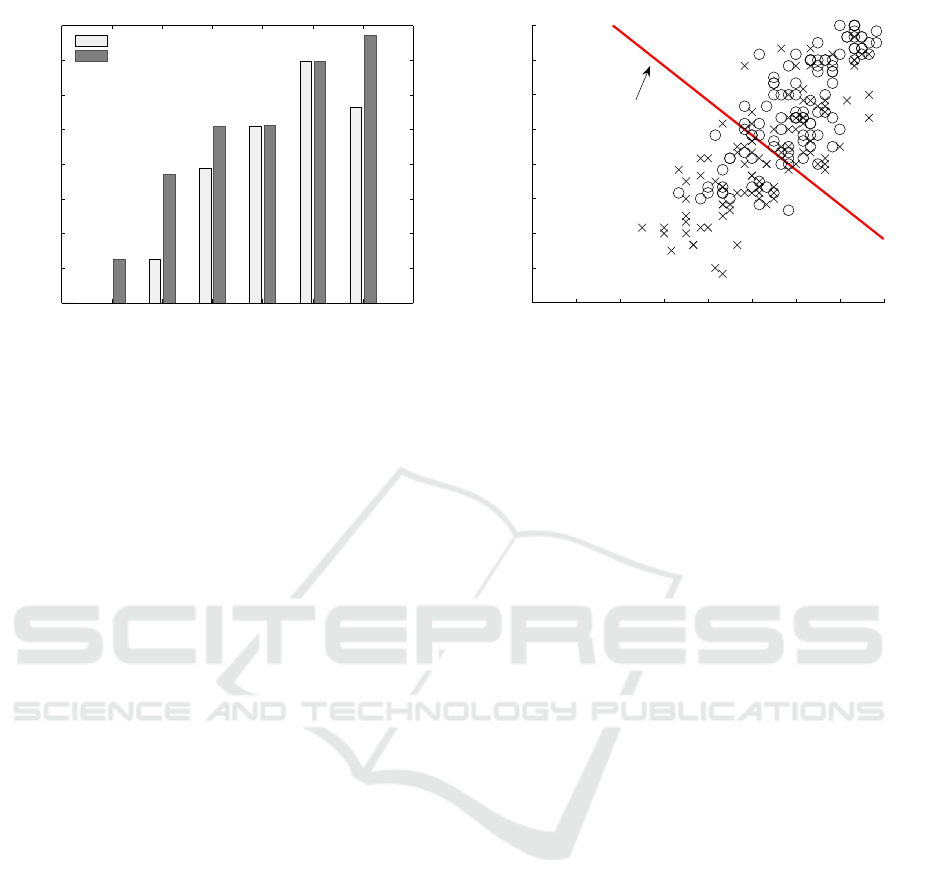
Figure 2: Percentages of games with good performance.
AVG
p
and the average teamwork capability AVG
t
are
calculated. The relationships between the referees
performance and the referees capabilities is shown in
Fig. 1.
3.2 Observations
We plot the collected data in fig.1. The X-axis and
Y-axis are the average personal capabilities and the
average teamwork capabilities respectively. The data
with “o” label are the game with good performance
while the data with “x” label are the game with per-
formances needed improvement. From this figure, we
can make the following observations:
• The data can not be separated clearly. The per-
formances with the same AVG
p
and AVG
t
val-
ues are not necessarily the same. This is because
that there are some other factors affect the perfor-
mance of referees. For example, the both teams of
a gaem, the physical, psycological preparation of
the referees, and etc.
• The relationship between the average personal ca-
pability and the average teamwork capability is
dependent. From the figure, we found that when
a referee team’s average personal capability high,
it probably has high teamwork capability. Even
though the two capabilities is dependent, we hope
to find the degree of the dependence and how they
affect the referees’ performance.
In order to understand how the two capabilities af-
fect the performances of the referee teams, we calcu-
late the percentages of number of games with good
performance when the value of capabilities is between
a range. Fig. 2 shows the relationships and we can
make the following observations:
• The relationship between the average teamwork
capability and the percentage of games with good
1 1.5 2 2.5 3 3.5 4 4.5 5
1
1.5
2
2.5
3
3.5
4
4.5
5
Average Personal Capability (AVG
p
)
Average Teamwork Capability (AVG
t
)
AVG
p
+AVG
t
=6.9167
Figure 3: Linear classifier with equal weight.
performance is an increasing function. When the
referees work together well, the performance will
be better.
• The relationship between the average personal ca-
pability and the performance is not an increasing
function. When the average personal capability is
high, the percentage of games with good perfor-
mance is not as high as expected. After analyz-
ing the raw data, we found that the reason that the
teamwork capabilities are small in these games.
We have already known that the teamwork is very
important to the performance of referees in a game.
Next, we hope to use the data for future analysis and
applications.
4 CLASSIFIERS OF REFEREE
TEAM’S PERFORMANCE
The data can also be used for further analysis of ref-
eree team’s performance. In this section, we use ma-
chine learning techniques(Abu-Mostafa et al., 2012;
Gallant, 1990) to find some classifiers which can
which can separate the data with minimum errors.
When a classifier is obtained, we can use the clas-
sifier to predict referees’ performance in the future.
Also, we can analyze the performance in a mathemat-
ical manner.
4.1 Linear Classifier with Equal Weight
The assumption of linear classifier with equal weights
assumes that the personal capability and the team-
work capability are equally important. The classifier
is to find a line whose slope is −1. The equation of
Performance Analysis of Basketball Referees by Machine Learning Techniques
167
1 1.5 2 2.5 3 3.5 4 4.5 5
1
1.5
2
2.5
3
3.5
4
4.5
5
Average Personal Capability (AVG
p
)
Average Teamwork Capability (AVG
t
)
radius=3.4771
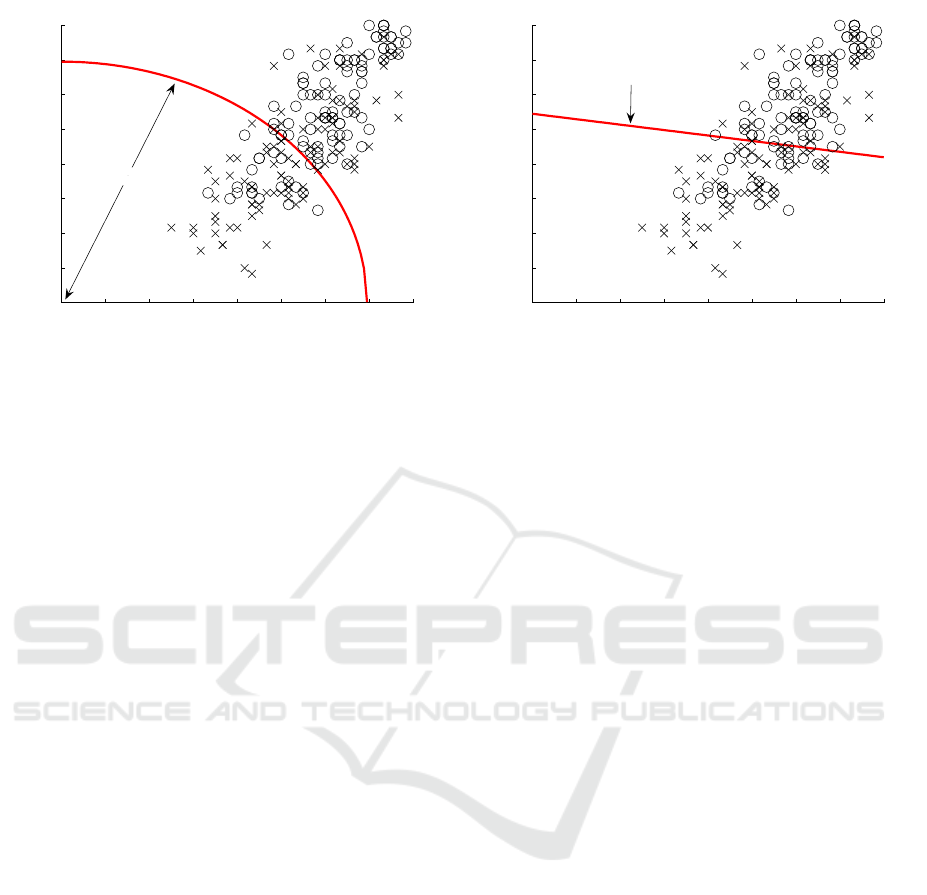
Figure 4: Circle classifier with equal weight
this line can be written as follows where c is a con-
stant.
AVG
p
+ AVG
t
= c (1)
The value of c is determined by a linear search tech-
nique such that the number of data points which is not
classified correctly is minimum. Fig. 3 shows the re-
lationship of the data set and the linear classifier with
equal weights. In our data set, the value of c with
minimum error points is 6.9167 and the number of er-
ror classified data points is 72 (Correct rate: 65.2%).
That is, if AVG
p
plus AVG
t
of a referee team in a game
is larger than 6.9167, the performance is expected to
be good based on this classifier.
4.2 Circle Classifier with Equal Weight
Circle classifier with equal weights uses the same as-
sumption as the linear classifier with equal weights
except that the classifier is a quadrant. The center of
the circle is set to (1, 1) and the radius is a constant r.
The equation of the circle is as follow.
(AVG
p
− 1)
2
+ (AVG
t
− 1)
2
= r
2
(2)
The value of r is also determined by linear search
and the number of incorrectly classified data points
is minimum. In the data set, the value of r is 3.4771
and the number of incorrectly classified data points is
73 (Correct rate: 64.7%). That is, if AVG
2
p
plus AVG
2
t
of a referee team in a game is larger than 3.4771
2
,
the performance is expected to be good based on this
classifier. The classifier is shown in fig. 4.
4.3 Linear Classifier using Pocket
Algorithm
The two previous classifiers both assume that the
personal capability and the teamwork capability are
1 1.5 2 2.5 3 3.5 4 4.5 5
1
1.5
2
2.5
3
3.5
4
4.5
5
Average Personal Capability (AVG
p
)
Average Teamwork Capability (AVG
t
)
1.33325 AVG
p
+8.5001 AVG
t
=33
Figure 5: Linear classifier using pocket algorithm
equally important to the referee team’s performance.
However, in the observations shown in Section 3, the
teamwork capability seems more important than the
personal capability. A data point d can be represent
by a two-tuple X
d
= (AVG
p
(d), AVG
t
(d)) and the per-
formance of d, denoted as y
d
, is set to be 1 if the per-
formance is good; otherwise, it is set to be −1.
Generally, the linear classifier can be written as
follows.
w
1
× AVG
p
+ w
2
× AVG
t
+ w
0
= 0 (3)
where w = w
0
, w
1
.w
2
is the vector of coefficients.
For simplicity for computation, we extend X
d
to be
a three-tuple X
′
d
= (1, AVG
p
(d), AVG
t
(d)) and the
equation of the classifier can be written as follows.
w· X
′
= 0 (4)
In order to find the vector (w
0
, w
1
, w
2
) such
that the number of incorrectly classified data points
is minimum, pocket algorithm(Abu-Mostafa et al.,
2012; Gallant, 1990; Rosenblatt, 1958) is used. Pro-
cedure of the pocket algorithm works as follows.
Step 1. Initially, let (w
0
.w
1
.w
2
) equals to (1, 1, 1).
Calculate the number of incorrectly classified data
points and let N
err
be the number of incorrectly
classified data points.
Step 2. Randomly choose a data point d which is in-
correctly classified. The new weight w
′
can be
calculated as follow
w
′
← w+ y
d
× X
′
d
(5)
Step 3. Calculate the number of incorrectly classified
data points N
′
err
based on the new weight w
′
. If
N
′
err
is less than N
err
, let N
err
= N
′
err
and remember
the weight w
′
.
icSPORTS 2016 - 4th International Congress on Sport Sciences Research and Technology Support
168

Step 4. If the number of repeated computation is less
than the predefined value, go to Step. 2; other-
wise, the algorithm terminates. In our program,
the value is set to 10
6
.
After applying the pocket algorithm, the equation of
the classifier applied on the data set is as follows and
the slope is −0.157.
1.33325AVG
p
+ 8.5001AVG
t
− 33 = 0 (6)
That is, if (1.33325AVG
p
+ 8.5001AVG
t
− 33) value
of a referee team in a game is larger than 33, the per-
formance is expected to be good based on this clas-
sifier. Fig. 5 shows the relationship between the data
points and the classifier. The number of incorrectly
classified data points is 65 (Correct rate: 68.6%).
From the equation and figure, we have following ob-
servations:
• The slope of the classifier is larger than -1 and still
less than 0. This means that the performance of a
referee team is affected by both the average per-
sonal capability and the average teamwork capa-
bility. The teamwork capability is more important
than the personal capability.
• From equation (6), we found that if the value
AVG
t
is large enough, performance of a referee
team will be probably good. However, if the value
of AVG
p
is high but the value of AVG
t
is not large
enough, the performance may need improvement.
• When applying the algorithm to the data set, the
equation will be different if the random incor-
rectly classified data points chosen in Step. 2 of
the algorithm are different. Even though the equa-
tions are different, they all yield the same mini-
mum number of incorrectly classified data points.
The equations are close to each other. There-
fore, the observations described above can also be
made from the different equations.
5 CONCLUSIONS
In this paper, we analyze the performance of basket-
ball referee teams in a game. In the past, only per-
sonal capabilities of the referees are considered. We
also consider the teamwork capabilities between the
referees in addition to their personal capabilities.
The data from Taiwan Super Basketball League
are analyzed. We first observed that the teamwork ca-
pability is a key factor to the performance of referee
teams. Furthermore, the teamwork capabilities are
more important than the personal capabilities. Then,
we derived three classifiers to further analyze the data
set. Among the three classifiers, a classifier named
linear classifier using pocket algorithm performs bet-
ter than the other two classifiers. The linear classifier
using pocket algorithm is able to classify the data set
with 68.6% correct rate. The classifier also proved
the importance of teamwork is much larger than that
of personal capability.
The classifiers may change with more and more
input data. This paper provides an approach to ana-
lyze the referee team’s performance in different coun-
tries or different tournaments. If more and more
data can be obtained from different countries or FIBA
games, this research can be applied to these referees
and games. Therefore, the classifier for the games
can be derived and some concluding remarks can be
made.
In the future, this research can be extended as fol-
lows.
• The classifiers have been derived and they can be
used as a predictor to the referee team’s perfor-
mance in the future games. The predictor can be
used and the correctness can be computed.
• The personal capability of a referee and the
teamwork capability between two referees may
change. In the future, a feedback mechanism af-
ter a game should be devised. If a game ends
with good referees’ performance, the personal ca-
pabilities of the three referees and the teamwork
capabilities between the three referees should be
increased; otherwise, they should be decreased.
In the meantime, the parameters of the classifier
should be recalculated to fit the new data.
• When the database of referees personal capabil-
ities and teamwork capabilities has been estab-
lished, a recommend system can be designed. In
a tournament, the selection and assignment of the
referees can recommended by the system in order
to maximize the number of games with good per-
formance.
ACKNOWLEDGEMENTS
This research was supported by the Ministry of
Science and Technology, Taiwan, under grant
MOST104-2221-E-431-001.
REFERENCES
Abu-Mostafa, Y. S., Magdon-Ismail, M., and Lin, H.-T.
(2012). Learning from data. AMLBook.
Austin, J. R. (2003). Transactive memory in organizational
groups: The effects of content, consensus, specializa-
Performance Analysis of Basketball Referees by Machine Learning Techniques
169

tion and accuracy on group performance. Journal of
Applied Psychology, 88(5):866–878.
Balmer, N.J., N., A.M., L., A.M., W., P., W. M., and S.H.,
F. (2007). Influence of crowd noise on soccer referee-
ing consistency in soccer. Journal of Sports Behavior,
30:130–145.
Bandura, A. (97). Self-Efficacy: The Exercise of Control.
New York: Freeman.
Carron, A. V. (1988). Group dynamics in sport. London:
Spodym.
Feinstein, J. (2009). Sometimes an apology is the right call.
Sporting News, 233(76).
FIBA (2010a). FIBA Internal Regulations. FIBA.
FIBA (2010b). Referee´s Manual for Three-Person Officiat-
ing. FIBA.
FIBA (2014). Official Basketball Rules 2014. FIBA,
SpainBarcelona.
Gallant, S. (1990). Perceptron-based learning algorithms.
Neural Networks, IEEE Transactions on, 1(2):179–
191.
Gladstein, D. L. (1984). Groups in context: A model of task
group effectiveness. Administrative Science Quar-
terly, 29:499–517.
Guill´en, F. and Feltz, D., L. (2011). A conceptual model of
referee efficacy. Front Psychology, 2(25):1–5.
Hair, J. F. (2006). Multivariate data analysis, volume 6.
Helsen, W. F. and Bultynck, J. (2004). Physical and
perceptual-cognitive demands of top-class refereeing
in association football. Journal of Sports Sciences,
22:179–189.
Heuze, J. P., Sarrazin, P., M., M., Raimbault, N., and
Thomas, J. P. (2006). Relationships of perceived mo-
tivational climate to cohesion and collective efficacy
in elite female teams. Journal of Applied Sport Psy-
chology, 18:201–218.
Hoseini, S. H., Aslankhani, M. A., Abdoli, B., and Moham-
madi (2011). The relationship between the number
of crowds with anxiety and the function of the soccer
premier leagues referees. Procedia-social and Behav-
ioral Sciences, 30:2374–2378.
Lazarov, V. (2007). Concepts of modern officiating. FIBA
Assist Magazine, 24(30-33).
Leicht, A. S. (2008). Physiological demands of basketball
refereeing during international competition. Journal
of Science and Medicine, 11:357–360.
Magyar, T. M., Feltz, D. L., and Simpson, I, P. (2004). In-
dividual and crew level determinants of collective ef-
ficacy in rowing. Journal of Sport & Exercise of Psy-
chology, 26:136–153.
Mirjamali, E., Ramzaninezhad, R., Rahmaninia, F., and
Reihani, M. (2013). A study of stress in international
and national referees of soccer, volleyball, basketball
and handball in iran. World Journal of Sport Sciences,
6(4):347–354.
Nevill, A., Balmer, N., and Williams, A. (2002). The influ-
ence of crowd noise and experience upon refereeing
decisions in football. Psychology of Sport and Exer-
cise, 3:261–272.
Novikoff, A. B. (1962). On convergence proofs on percep-
trons. Symposium on the Mathematical Theory of Au-
tomata, 12:615–622.
Orme, J. G. and Combs-Orme, T. (2009). Multiple regres-
sion with discrete dependent variables. Oxford Univ.
Press, USA.
Rosenblatt, F. (1958). The perceptron: a probabilistic model
for information storage and organization in the brain.
Psychological review, 65(6):386.
Serkan, H. (2014). Indoor sports incurred by referee mob-
bing behavior evaluation. Journal of Physical Educa-
tion and Sport, 14(4):626–631.
Smid, P. (2014). Analysis of teamwork in officiating in bas-
ketball. 9th INSHS International Christmas Sport Sci-
entific Conference.
Smith, R. M. and Spinks, W. L. (1995). Discriminant
analysis of biomechanical differences between novice,
good and elite rowers. Journal of Sports Science,
13:377–385.
Stern, J. (2010). You’ve kicked the call: Now what? Ref-
eree, 35:64–65.
Stewart, M. J. and Ellery, P. (2004). Sources and magni-
tude of perceived psychological stress in high school
officials. Perceptual and Motor Skill, 87:1275–1287.
Tjosvold, D. L. (1988). Cooperative and competitive in-
terdependence: Collaboration between departments to
serve customers. Group and Organization Studies,
13(3):274–289.
Wang, J.-L., Wang, Y., and Ma, J.-L. (2013). Training of
basketball referees in basketball game based on com-
puter simulation. Journal of Theoretical and Applied
Information Technology, 48(2):850–856.
icSPORTS 2016 - 4th International Congress on Sport Sciences Research and Technology Support
170
