
A Novel Histogram-based Network Anomaly Detection
Christian Callegari
1,2
, Michele Pagano
2
, Stefano Giordano
2
and Fabrizio Berizzi
1,2
1
RaSS National Laboratory – CNIT, Pisa, Italy
2
Dept. of Information Engineering, University of Pisa, Pisa, Italy
Keywords:
Anomaly Detection, Histogram, Euclidean Distance, Kullback–Leibler Divergence, Jansen–Shannon Diver-
gence.
Abstract:
The ability of capturing unknown attacks is an attractive feature of anomaly-based intrusion detection and it
is not surprising that research on such a topic represents one of the most promising directions in the field
of network security. In this work we consider two different traffic descriptors and evaluate their ability in
capturing different kinds of anomalies, taking into account three different measures of similarity in order to
discriminate between the normal network behaviour and the presence of anomalies. An extensive performance
analysis, carried out over the publicly available MAWILab dataset, has highlighted that a proper choice of
the relevant traffic descriptor and the similarity measure can be particularly efficient in the case of unknown
attacks, i.e. those attacks that cannot be detected by standard misuse-based systems.
1 INTRODUCTION
The ever growing use of the Internet for all kinds of
activities and transactions is unavoidably connected
to the development of novel (and more sophisticated)
network attacks, that cannot be detected by traditional
signature-based (also known as misuse-based) Intru-
sion Detection Systems (IDS), at least until the cor-
responding “rules” are detected and the users update
their software tools. The ability of capturing
unknown
attacks is the key motivation for research in the field
of anomaly-based IDS: in a nutshell, a normal behav-
ior of the network traffic is identified and
significant
deviations from it are tagged as attacks.
In spite of the simple rationale behind anomaly
detection, the design of efficient IDSs is an open re-
search issue at least for two reasons: the identifica-
tion of suitable traffic descriptors and the definition
of a quantitative measure for the deviation from the
normal behavior. In this paper we address both the
above-mentioned issues. In more detail, we took into
account two different traffic descriptors, number of
flows and number of bytes, for random node aggre-
gates. Since we are dealing with backbone traffic,
some kind of aggregation is needed to ensure scalabil-
ity, and random aggregation via sketches outperforms
standard deterministic approaches based on the net-
work prefix and input/output routers (Callegari et al.,
2010a). As mentioned above, an anomaly is detected
if the current behavior (in our case represented by a
histogram for each bucket) differs from the normal
ones. To this aim, we compared the performance of
entropy-based approaches (namely we considered the
Kullback–Leibler and Jensen–Shannon divergences),
widely used in intrusion detection, with a simple ge-
ometric approach, based on the traditional Euclidean
distance between the points in the multi-dimensional
space corresponding to the two histograms.
In a nutshell, the contribution of this paper is two-
fold: on the one side, we compare the ability of dif-
ferent traffic descriptors in capturing anomalies (note
that the structure of our IDS is flexible and other pa-
rameters could be used), highlighting as even
similar
parameters might lead to different performance. On
the other side, we consider several similarity mea-
sures, drawn from information theory and classical
geometry, and for each of them we construct the cor-
respondingROC curve for the well-knownMAWILab
traffic traces, taking into account the different labels
that describe the attacks in the original data base.
The remainder of this paper is organized as fol-
lows: Section 2 discusses related work, while Section
3 provides an overview of the theoretical background,
focusing on the description of the different distance
definitions used in this work. Then, Section 4 de-
scribes the architecture of the proposed system. The
dataset used for testing and validating our proposal
is described in Section 5 and in Section 6 we describe
the experimental results. Finally, in Section 7 we con-
clude the paper with some final remarks.
Callegari, C., Pagano, M., Giordano, S. and Berizzi, F.
A Novel Histogram-based Network Anomaly Detection.
DOI: 10.5220/0006013401030110
In Proceedings of the 13th International Joint Conference on e-Business and Telecommunications (ICETE 2016) - Volume 1: DCNET, pages 103-110
ISBN: 978-989-758-196-0
Copyright
c
2016 by SCITEPRESS – Science and Technology Publications, Lda. All rights reserved
103

2 RELATED WORK
Anomaly detection has attracted many research ef-
forts in the last decade as testified by the many re-
search paper on the topic. Referring to the “gen-
eral” field of network anomaly detection, a thorough
overview of the different approaches is given, for
instance, in (Thottan et al., 2010), while (Callegari
et al., 2013b) focuses on the features of network data,
providing some guidelines for the design of an IDS.
A complete review is beyond the scope of this paper
and in this section we only focus on the papers at the
basis of our experimental comparisons.
Although sketches can not be considered as a de-
tection method, they can be used as a building block
of several IDSs (Subhabrata et al., 2003; Dewaele
et al., 2007; Borgnat et al., 2009; Cormode and
Muthukrishnan, 2005; Callegari et al., 2010b; Cal-
legari et al., 2010a; Pukkawanna and Fukuda, 2010;
Lakhina et al., 2005; Callegari et al., 2011; Salem
et al., 2010). Indeed, as already mentioned in the
Introduction, the use of sketches corresponds to a
random aggregation that “efficiently” reduces the di-
mension of the data (wrt other deterministic aggrega-
tions (Callegari et al., 2010a)); moreover, the use of
reversible sketches (Schweller et al., 2004a) permits
to trace back the flows responsible for the anomalies.
In (Kind et al., 2009), Kind et al. present a
histogram-based IDS; the behavior of the monitored
network during every time bin is characterized by
means of histograms representing the distribution of
the number of flows, packets or bytes over the val-
ues of a traffic feature. Anomalies are then detected
by comparing the current histogram with a reference
one, built during the training phase, by means of a
distance function (typical examples are the Euclidean
distance, the Manhattan distance, the Mahalanobis
distance, the Kullback-Leibler divergence, and the
Jensen-Shannon divergence).
In (Brauckhoff et al., 2012) the histogram cloning
method is introduced: multiple randomized his-
tograms are obtained through independent hash func-
tions (corresponding to the different “lines” of a
sketch) and the Kullback-Leibler divergence is used
to detect anomalies. Association rules are then used
to extract and summarize anomalous flows from the
set of suspicious flows provided by several histogram-
based detectors.
The noveltyof the present papers is represented by
the performance comparison, based on publicly avail-
able real traffic data, of two different traffic descrip-
tors taking into account three different measure of
similarity between the corresponding histograms and
employing the labels available in the traffic database
to understand which kinds of attacks are better identi-
fied by our IDS.
3 THEORETICAL BACKGROUND
In this section, after a brief description of the re-
versible sketches, we recall different definitions and
concepts related to the level of similarity of two
probability distributions, representing the normal be-
haviour of the system and the current time bin. Taking
into account the nature of traffic data and the system
architecture, we will focus on discrete distributions
with a finite number L of elements. In the rest of this
section we will refer to the probability distributions as
vectors P,Q ∈ R
L
.
3.1 Reversible Sketches
A sketch is a probabilistic data structure (a two-
dimensional array) that can be used to summarise
a data stream, by exploiting the properties of the
hash functions (Cormode and Muthukrishnan, 2005).
Sketches differ in how they update hash buckets and
use hashed data to derive estimates.
In more detail, a sketch is a two-dimensionald×w
array T
D×w
, where each row d (d = 0, · · · ,D−1) is as-
sociated to a given hash function h
d
. These functions
give an output in the interval (0,··· , w− 1) and these
outputs are associated to the columns of the array. As
an example, the element T[d][ j] is associated to the
output value j of the hash function h
d
.
When a new item arrives, the following update
procedure is carried out for all the different hash func-
tions:
T[d][h
d
(i
t
)] ← T[d][h
d
(i
t
)] + c
t
(1)
where i
t
denotes the key (e.g., the IP destination ad-
dress) and c
t
the corresponding weight (e.g., the num-
ber of bytes received by that IP address).
Given the use of the hash functions, such data
structures are not reversible, which makes impossible
to identify the IP addresses responsible of an anomaly,
after the detection. To overcome such a limitation, in
our system we have used an improved version of the
sketch, that is the reversible sketch (Schweller et al.,
2004b).
3.2 Euclidean Distance
The Euclidean distance (or Euclidean metric) corre-
sponds to the usual distance between two points in an
Euclidean space (in R
2
it is equivalent to the well-
known Pythagorean theorem). It can be seen as a spe-
cial case (for p = 2) of the Minkowski distance of
DCCI 2016 - SPECIAL SESSION ON DATA COMMUNICATION FOR CRITICAL INFRASTRUCTURES
104

order p
d
p
(P,Q) =
L
∑
l=1
|p
l
− q
l
|
p
!
1/p
We recall that for p ≥ 1, the Minkowski distance is a
metric (as a result of the Minkowski inequality); in-
stead for p < 1 the triangle inequality does not hold
(see, for instance, (Kolmogorov and Fomin, 1999)
for further details).
3.3 Kullback–Leibler divergence
The Kullback–Leibler divergence (also known as in-
formation divergence, information gain or relative
entropy) is a “measure” of the difference between
two probability distributions P and Q (Kullback and
Leibler, 1951).
In case of discrete probability distributions, the
Kullback–Leibler divergence (KL) of Q from P is
given by
D
KL
(PkQ) =
L
∑
l=1
p
l
log
p
l
q
l
(2)
and it is defined only if q
l
= 0 implies p
l
= 0 ∀l (ab-
solute continuity).
From an information theory point of view,
D
KL
(PkQ) is the amount of information lost when
Q is used to approximate P; in other words, it mea-
sures the expected number of extra bits required to
code samples from P using a code optimized for Q
rather than the code optimized for P.
It is easy to show that
D
KL
(PkQ) ≥ 0
and equality holds iff P = Q almost everywhere, in
accordance with the intuitiveidea of distance between
distributions; however, KL is not a metric in the space
of probability distributions since it is not symmetric
1
D
KL
(PkQ) 6= D
KL
(QkP)
and does not satisfy the triangle inequality.
3.4 Jensen–Shannon divergence
The Jensen–Shannon divergence (JS) is another pop-
ular method of measuring the similarity between two
probability distributions (Lin, 1991) and can be inter-
preted as a symmetrized and smoothed version of KL.
It is defined by
2
D
JS
=
1
2
D
KL
(PkM)+
1
2
D
KL
(QkM) (3)
1
Kullback and Leibler themselves actually defined the di-
vergence as D
KL
(PkQ) + D
KL
(QkP), which is symmetric
2
Note that JS can be generalized for the comparison of more
than two distributions, but this goes beyond the goal of our
theoretical background
where M is the average of the two distributions, i.e.
M =
1
2
(P+ Q)
It can be shown that, using the standard (in informa-
tion theory) base 2 logarithm, the JS is bounded by
1:
0 ≤ D
JS
(PkQ) ≤ 1
4 SYSTEM ARCHITECTURE
First of all the input data are processed by a module
responsible of reading the network traffic (e.g., Net-
Flow traces (Claise, 2004)) and of parsing them (e.g.,
by using the Flow-Tools (flo, ), in case of NetFlow
data), so as to produce plain ASCII containing the in-
put data.
In more detail this first module will output a dis-
tinct file for each considered time-bin (let us assume
we have T distinct time-bins), each file containing a
list of keys observed in the time-bin (e.g., in our case
the list of destination IP addresses) and the associated
weights (e.g., the number of bytes or flows received
by that IP address).
After the data have been correctly formatted, they
are passed to the module responsible for the construc-
tion of the reversible sketch tables. In our system,
such sketch tables will contain a histogram of size L
in each bucket.
Hence, at this point, we have obtained T distinct
sketches T
t
D×W×L
, where t ∈ [1,T] is the time-bin (in
the experimental tests we have set W = 512, D = 16,
and L = 64).
Once the sketches have been constructed, they
are passed in input to the actual anomaly detection
phase, where the system compares each bucket (i.e.,
a histogram) of the current sketch with the same
bucket of the reference sketch (defined as the last
non-anomalous processed sketch), by computing one
of the previously discussed distances (namely, Eu-
clidean, KL, or JS).
Thus such a distance is compared with a thresh-
old to decide if there is an anomaly or not. For each
time-bin, the output of this phase is a binary matrix
(A ∈ N
D×W
), that contains a “1” if the corresponding
sketch bucket is considered anomalous at that time-
bin , “0” otherwise.
Note that, given the nature of the sketches, each
traffic flow is part of several random aggregates
(namely D aggregates), corresponding to the D differ-
ent hash functions. This means that, in practice, any
flow will be checked D times to verify if it presents
any anomaly (this is done because an anomalous flow
A Novel Histogram-based Network Anomaly Detection
105

could be masked in a given traffic aggregate, while
being detectable in another one).
Due to this fact, a voting algorithm is applied to
the matrix A. The algorithm simply verifies if at least
H rows of A contain at least a bucket set to “1” (H
is a tunable parameter). If so, the system reveals an
anomaly, otherwise the matrix A is discarded and the
reference sketch is updated.
In case an anomaly is revealed, the responsible IP
addresses are identified (by using the reversiblesketch
functionalities).
5 MAWILab DATASET
The dataset used to evaluate our anomaly detection
methods consists of packet traces from the MAWI
(Measurement and Analysis on the WIDE Internet)
archive (sample-points B and F), publicly available
at (maw, a). Each trace in this database collects the
traffic captured for 15 minutes in a specific day, since
2001 until nowadays, on a trans-Pacific link between
Japan and the USA.
As with almost all existing databases, the key
problem in testing the IDS performance is represented
by a precise knowledge of the anomalies existing in
the captured traffic. Such information are essential
for building a proper ROC curve and evaluating new
approaches. Although also for the MAWI archive an
exact description of the attacks is not available, the
dataset presents two important features that made it
suitable for the performance evaluation procedure:
• unlike the widely-used DARPA dataset, the net-
work is not emulated and the traffic mixture is
representative of the current mixtures of network
services and applications;
• in the framework of the successive project MAW-
ILab (maw, b), every traffic flow is classified by
means of labels, which indicate the probability
(according to well-known anomaly detection al-
gorithms) that an anomaly is present. Since these
labels are available together with the traces, they
can be used as a common reference for testing a
new IDS.
In more detail, the traces classification has been
obtained combining the output of four anomaly detec-
tors (based respectively on the Hough transform, the
Gamma distribution, the Kullback-Leibler divergence
and the Principal Component Analysis) (Fontugne
et al., 2010). As a result, the traffic is split into four
categories:
• anomalous: traffic that is anomalous with high
probability;
• suspicious: traffic that is probably anomalous, but
not clearly identified by the MAWI classification
methods;
• notice: non anomalous traffic, but that has been
reported by at least one of the four anomaly de-
tectors;
• benign: normal traffic.
The anomalies (anomalous and suspicious flows) are
listed in an xml file for each trace, identifying them by
means of traffic features as source and destination IP
addresses, source port, destination port and transport
protocol. Furthermore, some information about the
kind of anomaly are also given:
• attack: anomalies representing a well known at-
tack;
• special: anomalies involving well known ports;
• unknown: unknown kinds of anomalies.
Hence, the effectiveness of an IDS can be evalu-
ated comparing the alarms generated by the new IDS
with the labeled flows in the traffic traces, possibly
referring to the three above-mentioned anomalous be-
haviors. Nevertheless, it is important to take into ac-
count the probabilistic nature of the MAWI classifica-
tion in the interpretation of the achieved results.
6 EXPERIMENTAL RESULTS
The most widely used performance indicators are rep-
resented by the ROC curve and the Area under the
Curve (AuC). Taking into account the MAWI labels,
we consider as “false positives” the flows that are not
labeled as “anomalous” or “suspicious” in the MAWI
archive,but that are anomalous according to the tested
IDS, so the false alarm probability P
FA
is the ratio be-
tween the number of “false positive flows” and the
number of flows that are neither “anomalous” nor
“suspicious”.
On the other hand, the false negative rate P
FN
(note that the detection probability P
D
can be obtained
simply as P
D
= 1−P
FN
) is the ratio between the num-
ber of false negatives and the number of “anomalous”
flows. But, in this case P
FN
depends on the actual
interpretation of the MAWILab labels, and can be de-
fined in several ways.
In more detail, as discussed in (Callegari et al.,
2013a), the number of false negatives can be calcu-
lated as (the labels are used in the following figures to
identifies the corresponding definitions of P
D
):
• “all”: the number of unrevealed flows labeled as
“anomalous”
DCCI 2016 - SPECIAL SESSION ON DATA COMMUNICATION FOR CRITICAL INFRASTRUCTURES
106
0
0.2
0.4
0.6
0.8
1
0 0.2 0.4 0.6 0.8 1
P
D
P
FA
fn 2 detector
fn 3 detector
fn 4 detector
fn attack special
fn attack
all
fn unknown 4 detector
fn unknown
Figure 1: ROC: Euclidean distance (Byte).
0
0.2
0.4
0.6
0.8
1
0 0.2 0.4 0.6 0.8 1
P
D
P
FA
fn 2 detector
fn 3 detector
fn 4 detector
fn attack special
fn attack
all
fn unknown 4 detector
fn unknown
Figure 2: ROC: KL (Byte).
• “fn 2 detector”: the number of unrevealed flows
labeled as “anomalous” and detected at least by
two/three/four of the four detectors used in MAWI
classification;
• “fn 3 detector”: the number of unrevealed flows
labeled as “anomalous” and detected at least by
three of the four detectors used in MAWI classifi-
cation;
• “fn 4 detector”: the number of unrevealed flows
labeled as “anomalous” and detected by all the
four detectors used in MAWI classification;
• “fn attack”: the number of unrevealed flows la-
beled as “anomalous” belonging to the “attack”
category (known attacks);
• “fn attack special”: the number of unrevealed
flows labeled as “anomalous” belonging to the
“attack” category or the “special” category (at-
tacks involving well-known ports);
• “fn unknown”: the number of unrevealed flows
labeled as “anomalous” belonging to the “un-
known” category (unknown anomalous activi-
ties);
• “fn unknown 4 detector”: the number of unre-
vealed flows labeled as “anomalous” belonging to
the “unknown” category and detected by all the
four detectors used in MAWI classification.
Given these definitions, in the following we dis-
cuss the results achieved by our system when tak-
ing into consideration, as traffic descriptors, either
the number of flows with the same destination IP ad-
dress or the quantity of traffic received by each IP ad-
dress expressed in bytes. From the technical point of
view this means that each bucket of the sketch con-
tains a histogram of number of either distinct flows
or bytes received by each aggregate of destination IP
addresses.
0
0.2
0.4
0.6
0.8
1
0 0.2 0.4 0.6 0.8 1
P
D
P
FA
fn 2 detector
fn 3 detector
fn 4 detector
fn attack special
fn attack
all
fn unknown 4 detector
fn unknown
Figure 3: ROC: JS (Byte).
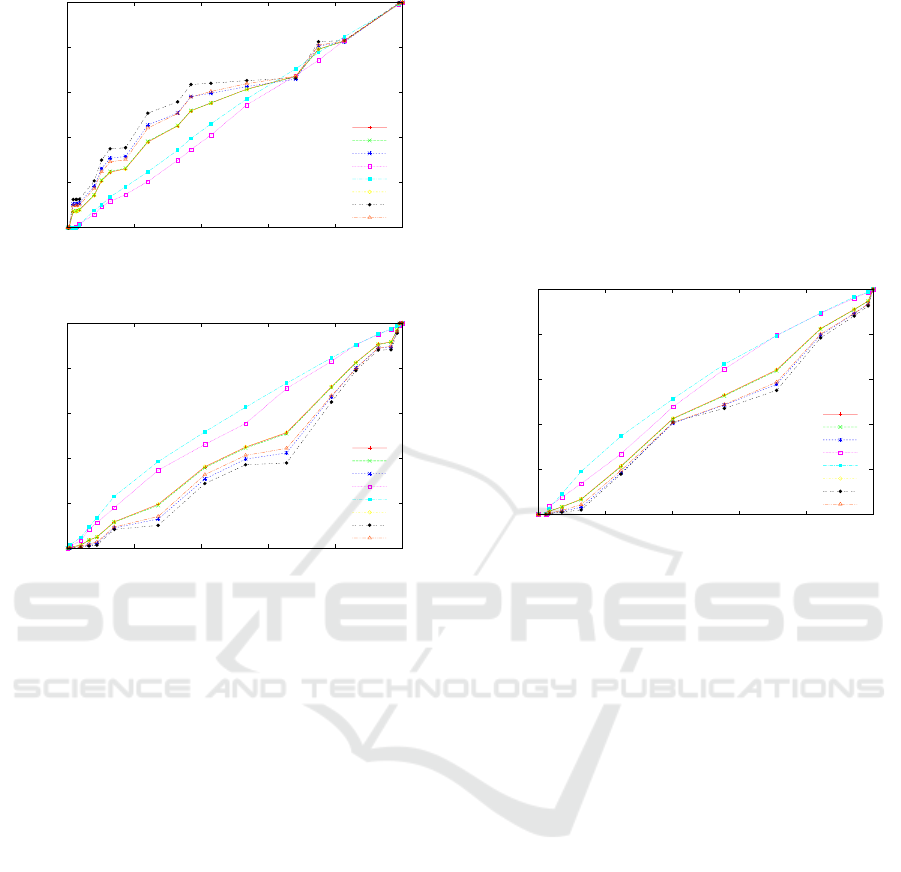
In the first set of figures we present the perfor-
mance achievedby the system when using the number
of Bytes as traffic descriptor. In Figure 1, we show
the ROC curves obtained by using the Euclidean dis-
tance, when varying the definition of P
FN
. As it can
be clearly seen, the system does not offer good per-
formance when considering the most “general” defi-
nition of P
FN
(i.e., “all” case), with a plot that is not
far from the diagonal case. Nonetheless, given that
anomaly detection systems are usually combined to-
gether with misuse-based IDSs, we can easily con-
clude that the most significative cases are given by
those definitions of P
FN
that only consider the “un-
known” anomalies (being all the other cases “cov-
ered” by misuse-based IDSs). Hence, referring to the
“fn unknown” and “fn unknown 4 detector” we can
see the system is able to provide good performance.
Figures 2 and 3 present an analogous performance
analysis, when applying respectively KL and JS di-
vergences instead than the Euclidean distance over
the same kind of data. In these cases we can easily
conclude that the system cannot provide good perfor-
mance, independently of the considered definition of
P
FN
.
The previous considerations are confirmed in Ta-
ble 1 where all the values of the AuC are reported.
Figures 4, 5, and 6 show the performance achieved
by the system when applying the previously discussed
A Novel Histogram-based Network Anomaly Detection
107
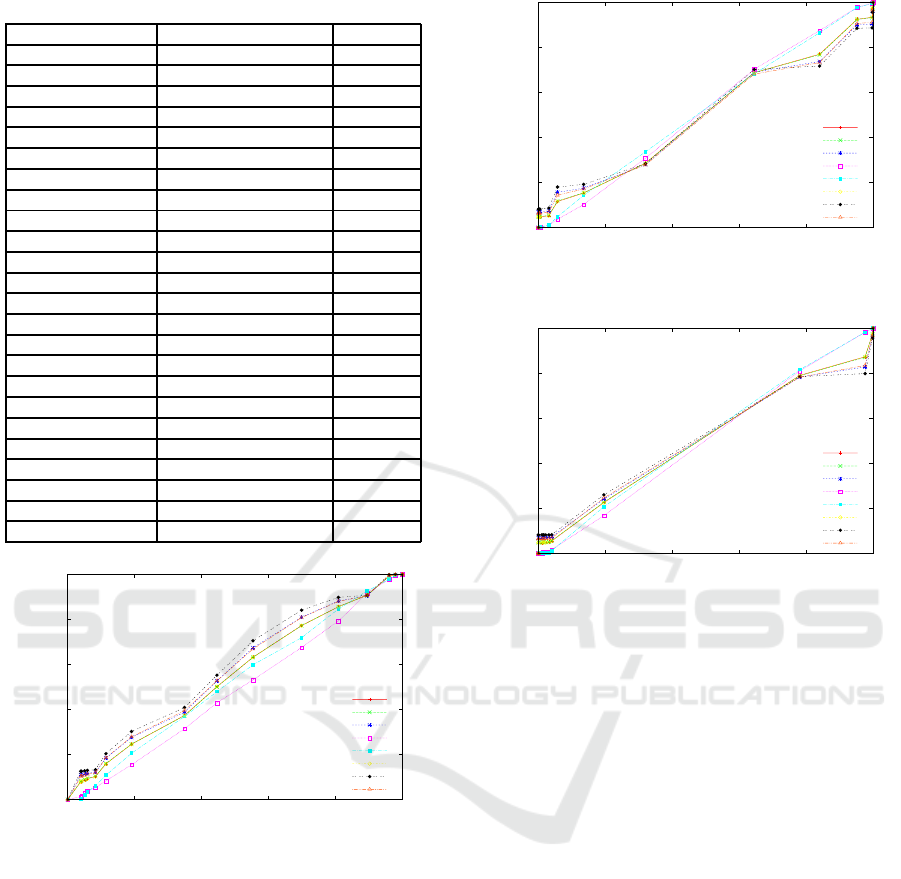
Table 1: AuC (Byte).
Method Label AuC
Euclidean distance all 0.566218
Euclidean distance fn 2 detector 0.566777
Euclidean distance fn 3 detector 0.567148
Euclidean distance fn 4 detector 0.593179
Euclidean distance fn attack 0.517885
Euclidean distance fn attack special 0.49092
Euclidean distance fn unknown 0.59376
Euclidean distance fn unknown 4 detector 0.619295
KL all 0.43864
KL fn 2 detector 0.437062
KL fn 3 detector 0.434724
KL fn 4 detector 0.391628
KL fn attack 0.572724
KL fn attack special 0.540628
KL fn unknown 0.401305
KL fn unknown 4 detector 0.371248
JS all 0.472176
JS fn 2 detector 0.471619
JS fn 3 detector 0.469437
JS fn 4 detector 0.438708
JS fn attack 0.573483
JS fn attack special 0.54829
JS fn unknown 0.444348
JS fn unknown 4 detector 0.429052
0
0.2
0.4
0.6
0.8
1
0 0.2 0.4 0.6 0.8 1
P
D
P
FA
fn 2 detector
fn 3 detector
fn 4 detector
fn attack special
fn attack
all
fn unknown 4 detector
fn unknown
Figure 4: ROC: Euclidean distance (Flow).
methods to the histograms of the number of distinct
flows directed to a given aggregate of IP addresses.
Differently from the previous case, we can notice
here, that the system does not offer acceptable perfor-
mance (despite the different definitions of P
FN
and the
different distances), revealing the inadequacy of such
a traffic descriptor for anomaly detection purposes.
For sake of completeness, also in this case, we
present all the value of the AuC in Table 2.
7 CONCLUSIONS
In this paper we have compared two different traf-
fic descriptors, namely the number of received bytes
0
0.2
0.4
0.6
0.8
1
0 0.2 0.4 0.6 0.8 1
P
D
P
FA
fn 2 detector
fn 3 detector
fn 4 detector
fn attack special
fn attack
all
fn unknown 4 detector
fn unknown
Figure 5: ROC: KL (Flow).
0
0.2
0.4
0.6
0.8
1
0 0.2 0.4 0.6 0.8 1
P
D
P
FA
fn 2 detector
fn 3 detector
fn 4 detector
fn attack special
fn attack
all
fn unknown 4 detector
fn unknown
Figure 6: ROC: JS (Flow).
and flows, and evaluated their ability in capturing dif-
ferent kinds of anomalies. In more detail, we con-
sidered random traffic aggregates (through the use of
sketches) and for each bucket we assumed that the
distribution of received bytes and flows may be used
to identify anomalies. To this aim we considered
three measures of similarity, namely the classical Eu-
clidean distance as well as the Kullback-Leibler and
Jensen-Shannon divergences. We carried out an ex-
tensive performance analysis over the publicly avail-
able MAWILab dataset, taking advantage of the avail-
able labels to understand what kinds of attacks are
better identified by different combinations of traffic
descriptors and distances.
Our main finding is that the combined use of
the number of bytes and Euclidean distance leads to
good performance, especially in the detection of un-
known attacks, which represent the most significant
case from the point of view of anomaly detection,
since known attacks can be preliminarily identified by
state-of-the-art misuse-based IDSs.
Finally, it is important to point out that, indepen-
dently of the used metric, the distribution of the num-
ber of flows, although it might seem that it is closely
related to the same statistic in terms of bytes, does
not change significantly in presence of attacks. This
DCCI 2016 - SPECIAL SESSION ON DATA COMMUNICATION FOR CRITICAL INFRASTRUCTURES
108

Table 2: AuC (Flow).
Method Label AuC
Euclidean distance all 0.546382
Euclidean distance fn 2 detector 0.546917
Euclidean distance fn 3 detector 0.546582
Euclidean distance fn 4 detector 0.570564
Euclidean distance fn attack 0.520335
Euclidean distance fn attack special 0.481449
Euclidean distance fn unknown 0.57054
Euclidean distance fn unknown 4 detector 0.590988
KL all 0.494823
KL fn 2 detector 0.494804
KL fn 3 detector 0.4943
KL fn 4 detector 0.491971
KL fn attack 0.51984
KL fn attack special 0.513451
KL fn unknown 0.488019
KL fn unknown 4 detector 0.495547
JS all 0.505141
JS fn 2 detector 0.505257
JS fn 3 detector 0.505373
JS fn 4 detector 0.505256
JS fn attack 0.515206
JS fn attack special 0.499154
JS fn unknown 0.507279
JS fn unknown 4 detector 0.511053
result highlights that the choice of a proper traffic de-
scriptor is a key factor in anomaly detection.
ACKNOWLEDGEMENTS
This work was partially supported by PRA 2016 re-
search project 5GIOTTO funded by the University of
Pisa and by SCOUT, a research project supported by
the European Commission under its 7th Framework
Program (contract-no. 607019). The views and con-
clusions contained herein are those of the authors and
should not be interpreted as necessarily representing
the official policies or endorsements, either expressed
or implied, of the SCOUT project or the European
Commission.
REFERENCES
Flow-Tools Home Page. http://www.ietf.org/rfc/rfc39
54.txt.
MAWI Working Group Traffic Archive. http://mawi.wi
de.ad.jp/mawi (accessed on November 2011).
MAWILab. http://www.fukuda-lab.org/mawilab/ (accessed
on November 2011).
Borgnat, P., Dewaele, G., Fukuda, K., Abry, P., and Cho,
K. (2009). Seven years and one day: Sketching the
evolution of internet traffic. In INFOCOM.
Brauckhoff, D., Dimitropoulos, X., Wagner, A., and Sala-
matian, K. (2012). Anomaly extraction in backbone
networks using association rules. IEEE/ACM Trans.
Netw., 20(6):1788–1799.
Callegari, C., Casella, A., Giordano, S., Pagano, M., and
Pepe, T. (2013a). Sketch-based multidimensional
IDS: A new approach for network anomaly detection.
In IEEE Conference on Communications and Network
Security, CNS 2013, National Harbor, MD, USA, Oc-
tober 14-16, 2013, pages 350–358.
Callegari, C., Coluccia, A., D’Alconzo, A., Ellens, W.,
Giordano, S., Mandjes, M., Pagano, M., Pepe, T., Ric-
ciato, F., and Zuraniewski, P. (2013b). A methodolog-
ical overview on anomaly detection. In Data Traf-
fic Monitoring and Analysis, pages 148–183. Springer
Berlin Heidelberg.
Callegari, C., Gazzarrini, L., Giordano, S., Pagano, M.,
and Pepe, T. (2010a). When randomness improves
the anomaly detection performance. In Proceedings
of 3rd International Symposium on Applied Sciences
in Biomedical and Communication Technologies (IS-
ABEL).
Callegari, C., Giordano, S., Pagano, M., and Pepe, T.
(2010b). On the use of sketches and wavelet anal-
ysis for network anomaly detection. In IWCMC ’10:
Proceedings of the 6th International Wireless Commu-
nications and Mobile Computing Conference, pages
331–335, New York, NY, USA. ACM.
Callegari, C., Giordano, S., Pagano, M., and Pepe, T.
(2011). Forecasting the Distribution of Network Traf-
fic for Anomlay Detection. In TRUSTCOM ’11 Pro-
ceedings of the 2011 IEEE 10th International Confer-
ence on Trust, Security and Privacy in Computing and
Communications, pages 173–180.
Claise, B. (2004). Cisco Systems NetFlow Services Export
Version 9. RFC 3954 (Informational).
Cormode, G. and Muthukrishnan, S. (2005). An improved
data stream summary: the count-min sketch and its
applications. Journal of Algorithms, 55(1):58 – 75.
Dewaele, G., Fukuda, K., Borgnat, P., Abry, P., and Cho,
K. (2007). Extracting hidden anomalies using sketch
and non gaussian multiresolution statistical detection
procedures. In LSAD ’07: Proceedings of the 2007
workshop on Large scale attack defense, pages 145–
152, New York, NY, USA. ACM.
Fontugne, R., Borgnat, P., Abry, P., and Fukuda, K. (2010).
MAWILab: Combining Diverse Anomaly Detectors
for Automated Anomaly Labeling and Performance
Benchmarking. ACM CoNEXT.
Kind, A., Stoecklin, M. P., and Dimitropoulos, X. (2009).
Histogram-Based Traffic Anomaly Detection. IEEE
Transactions on Network and Service Management,
6(2).
Kolmogorov, A. and Fomin, S. (1999). Elements of the The-
ory of Functions and Functional Analysis. Number v.
1 in Dover books on mathematics. Dover.
Kullback, S. and Leibler, R. A. (1951). On information and
sufficiency. Ann. Math. Statist., 22(1):79–86.
A Novel Histogram-based Network Anomaly Detection
109

Lakhina, A., Crovella, M., and Diot, C. (2005). Mining
anomalies using traffic feature. In ACM SIGCOMM.
Lin, J. (1991). Divergence measures based on the shannon
entropy. IEEE Transactions on Information Theory,
37(1):145–151.
Pukkawanna, S. and Fukuda, K. (2010). Combining
sketch and wavelet models for anomaly detection.
In Intelligent Computer Communication and Process-
ing (ICCP), 2010 IEEE International Conference on,
pages 313 –319.
Salem, O., Vaton, S., and Gravey, A. (2010). A scalable,
efficient and informative approach for anomaly-based
Intrusion Detection Systems: theory and practice. In-
ternational Journal of Network Management.
Schweller, R., Gupta, A., Parsons, E., and Chen, Y. (2004a).
Reversible sketches for efficient and accurate change
detection over network data streams. In Proceedings
of the 4th ACM SIGCOMM conference on Internet
measurement, IMC ’04, pages 207–212, New York,
NY, USA. ACM.
Schweller, R., Gupta, A., Parsons, E., and Chen, Y. (2004b).
Reversible sketches for efficient and accurate change
detection over network data streams. In Proceedings
of the 4th ACM SIGCOMM conference on Internet
measurement, IMC ’04, pages 207–212, New York,
NY, USA. ACM.
Subhabrata, B. K., Krishnamurthy, E., Sen, S., Zhang, Y.,
and Chen, Y. (2003). Sketch-based change detection:
Methods, evaluation, and applications. In In Internet
Measurement Conference, pages 234–247.
Thottan, M., Liu, G., and Ji, C. (2010). Anomaly de-
tection approaches for communication networks. In
Cormode, G., Thottan, M., and Sammes, A. J., edi-
tors, Algorithms for Next Generation Networks, Com-
puter Communications and Networks, pages 239–261.
Springer London.
DCCI 2016 - SPECIAL SESSION ON DATA COMMUNICATION FOR CRITICAL INFRASTRUCTURES
110
