Query-based Risks Management of Manufacturing Processes
Christophe Ponsard
1
, Renaud De Landtsheer
1
, Gustavo Ospina
1
,
Stephan Printz
2
and Johann Philipp von Cube
3
1
CETIC Research Centre, Charleroi, Belgium
2
Institute for Management Cybernetics (IfU), RWTH Aachen University, Aachen, Germany
3
Fraunhofer Institute for Production Technology (IPT), Aachen, Germany
Keywords:
Discrete Event Simulation, Manufacturing, Supply Chain, Procurement Risks, Risk Management.
Abstract:
Managing risks in supply chains is challenging for most companies, given the globalisation process which
is strengthening the production constraints and also introducing more procurements risks. This is especially
difficult for smaller companies because they generally lack resources to develop a specific expertise or buy
expensive tools. Our research aims at addressing those issues by proposing an easy to use, yet powerful
simulation framework based on Discrete Event Simulation. In our previous work we demonstrated the expres-
siveness of our modelling language and the efficiency of our simulation framework. The focus of this paper is
on the usability dimension of the developed tool. We describe the global process driving the company through
the whole risk control process, from identification, modelling, simulation and analysis. We demonstrate our
ideas on a web-based prototype composed on a number of wizards and component supporting the structured
analysis of simulation outcome in direct relation with the risks.
1 INTRODUCTION
Supply chain risk management (SCRM) is the im-
plementation of strategies to manage both everyday
and exceptional risks along the supply chain, based
on continuous risk assessment with the objective of
reducing vulnerability and ensuring the process con-
tinuity (Wieland and Wallenburg, 2012). Such risks
can occur for several reasons, both external (procure-
ment risks of geographic, political, social nature, etc.)
or internal (machine reliability, nature of specific op-
erations, etc.). Helping company managers make the
right decisions in the face of risks is not an easy task.
Small and medium enterprises (SMEs) are especially
challenged, because they have limited resources, and
failing to address such risks can have dramatic effects
on their business. This was confirmed by a survey
we conducted on-line, related to the practice of eval-
uation of risks in an industrial context (Printz et al.,
2015). The results of this survey showed that nearly
66% of the companies consider risk evaluations, but
only 10% rely on dedicated software tooling and most
of SMEs only rely on spreadsheets as tools.
Whilst analytical reasoning is impractical, model-
based simulation has proved to be a adequate ap-
proach (Deleris and Erhun, 2005). A common char-
acteristic is that the impact of risks can generally only
be assessed at the output of the supply chain while
some risks, like procurement risks, occur at the very
beginning. Therefore, this requires to be able to rea-
son throughout the whole manufacturing process.
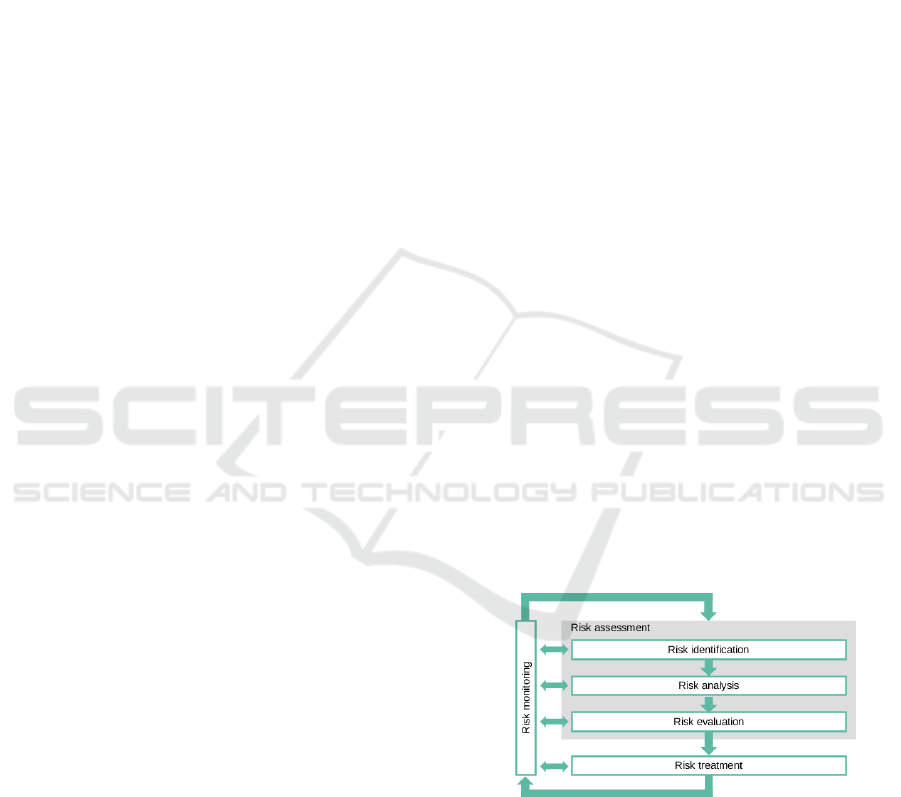
Figure 1: Risk management process.
Our ultimate goal is to produce a user-friendly,
tool-supported methodology that will guide the user
through the whole process of risk assessment shown
in Figure 1. In order to reach this goal, our research
is structured as follows:
• Identifying a taxonomy of risks related to supply
chain in manufacturing, based both on literature
review and feedback from our survey (Printz et al.,
2015).
Ponsard, C., Landtsheer, R., Ospina, G., Printz, S. and Cube, J.
Query-based Risks Management of Manufacturing Processes.
DOI: 10.5220/0006011103390344
In Proceedings of the 6th International Conference on Simulation and Modeling Methodologies, Technologies and Applications (SIMULTECH 2016), pages 339-344
ISBN: 978-989-758-199-1
Copyright
c
2016 by SCITEPRESS – Science and Technology Publications, Lda. All rights reserved
339

• Developing a modelling and simulation tool for
identifying risks, quantifying them and deciding
on how to mitigate them. This technical part of
the work relies on a Discrete Event Simulation
(DES) engine provided by the OscaR library (Os-
caR, 2012) and combined with Monte Carlo Sim-
ulation (MCS) techniques. It is fully described
and benchmarked in (Landtsheer et al., 2016).
• Building a user-friendly interface to support the
global risk management workflow depicted in
Figure 1. This is the scope of the present paper.
• Validating our work through a group of companies
that are already trying out the tool.
Our modelling framework includes concepts such as
storages and several types of production processes.
In addition, we defined a query language on models.
It is fully declarative and includes arithmetic, tempo-
ral, and logic operators, as well as basic queries on
the elements of our factory model (contents of a stor-
age, running state of a process, etc). Based on this
query language, the software tool is able to estimate
the probabilities of different scenarios (e.g. delay in
deliveries, defective parts or poor quality) and their
impact.
In this paper, we show how the modelling con-
cepts and simulation tool are supporting the global
risk management process in an efficient, consistent
and user-friendly way using a web-based interface.
The main steps of the process support are as follows:
• Risk-oriented process modelling: the model is
built with the aim to express the required risks and
not especially to be a full scale model. As risks are
fully identified in the next step, it may need to be
refined to reach the right granularity.
• Risk identification: in this key step, a hierarchi-
cal risk model is defined using a structured wiz-
ard covering major risk categories such as qual-
ity, quantity and delay risks. Different queries are
used to express the risks for each category.
• Risk-oriented simulation: the model instrumented
with queries is run using the DES and MCS, and
raw results (collected traces or statistics) can be
explored directly in the tool.
• Risk analysis and measures: the measurements
collected using the risk queries are presented in
a risk dashboard according to the structured risk
model. It allows the risk analyst to zoom in spe-
cific risk categories or look at the behaviour of
specific element according to specific risk cate-
gories. Based on this, some risk control measures
can be identified and validated using a new round
of simulation. The best value of specific parame-
ters can also be determined, e.g. the threshold or
the quantity for an order policy.
The paper is structured as follows. Section 2 gives
some background on our framework. Section 3 de-
scribes a short case study consistently used in the next
sections. Section 4 to 7 describe our modelling, risk
identification, simulation and analysis steps, respec-
tively. Finally, section 8 draws some conclusions and
describes some future work.
2 BACKGROUND: SIMQRI
SIMULATION META-MODEL
All the main elements of manufacturing processes are
represented in our simulation meta-model, which al-
lows us to define concrete models that are simulated
in a DES engine. In addition to this, we designed a
Query Language over concrete simulations in order
to collect and analyse data.
2.1 Meta-model Overview
This section introduces the basic blocks for represent-
ing factories. Figure 2 summarises the meta-model of
concepts used at that purpose. It is composed of ac-
tivatable components such as storages and processes
through which items can flow.
• Storages represent any kind of storage device or
place for raw materials, like a warehouse, a barrel
or a silo. They have a maximum capacity. When
this capacity is reached, they either overflow, or
processes trying to put more items into them are
blocked, depending on the settings of the storage.
If a full storage overflows, any exceeding material
is lost.
• Batch processes are factory processes that work in
a batch fashion; supplies are collected from vari-
ous storages, the process then runs for some time,
and finally the produced outputs are dispatched to
their respective storages before this whole cycle
starts again. They exist in different flavours: with
a single or multiple production lines.
• Splitting processes are similar to batch processes,
except that they have several sets of outputs that
can be selected according to some rules. It can be
used to model failing processes and quality assur-
ance process.
• Continuous processes are factory processes that
typically run on a conveyor belt. Items are contin-
uously picked from input stocks and undergo the
process taking some time. Continuous processes
SIMULTECH 2016 - 6th International Conference on Simulation and Modeling Methodologies, Technologies and Applications
340
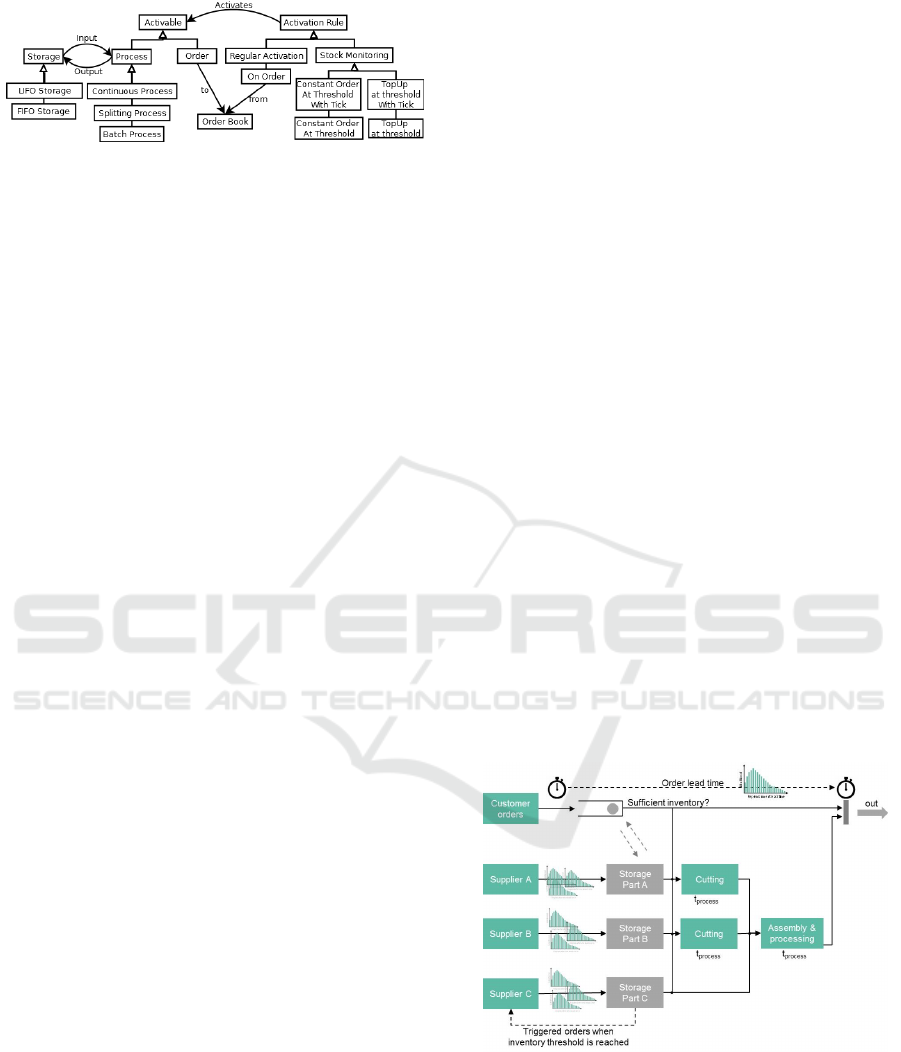
Figure 2: Meta-model of our tool.
act like pipeline; they can process several items in
a queue.
The flow is controlled through activation rules that
relates to order books and procurement policies.
• On Order activation represents on-demand pro-
duction triggered by a specific order book.
• Stock monitoring are used to implement different
procurement policies (or possibly internal stock
transfers) based on different possible models.
2.2 Query Language Overview
We remind here the main operators that can be used
to express queries allowing the risk analyst to evalu-
ate specific risks on the model. The language can also
be used to collect other kinds of Key Performance In-
dicators (KPIs) that are also useful to quantify and
reason about the risk impacts.
Queries for Processes
These are atomic operators that extract basic metrics
from processes of the simulation model. Suppose that
p is such a process:
• t |= completedBatchCount(p) the total number of
batches performed by p until time t.
• t |= startedBatchCount(p) the number of batches
started by p until time t. For a multi-line process,
it sums up the started batches of each line.
• t |= totalWaitDuration(p) the total duration where
p was not running until time t. For a multi-line
process, it sums up the waiting time of each line.
• t |= meanLoad(p) is the ratio between of the com-
pleted batches and the total capacity until time t.
• t |= anyBatchStarted(p) true if a batch was started
by the process at time t.
Queries for Storages
These are atomic operators that extract basic metrics
from stores of the simulation model. Suppose that s is
such a store:
• t |= empty(s) true if s is empty at time t, false oth-
erwise.
• t |= content(s) the number of items in s at time t.
• t |= capacity(s) the (fixed) maximal capacity of s.
• t |= totalPut(s) the number of items put into s until
time t, not counting the initial ones.
• t |= totalFetch(s) the number of items fetched
from s until time t.
• t |= totalLostByOverflow(s) the number of items
lost by overflow from s until time t.
Operators
Complex queries can be built using following opera-
tors, some of them also referring to one or more states
of the considered trace:
• logical: true,false,not(!),and(&),or(k),<,>, ...
• temporal logic: hasAlwaysBeen,hasBeen,since, ...
• arithmetic: +,−,∗,/, sum,...
• temporal arithmetic: delta,cumulatedDuration,
time,min,max, avg,integral...
3 COMPLEX ASSEMBLY CASE
STUDY
The product under investigation is relatively simple, it
consists of three components, which are procured ex-
ternally. The production process can be characterised
as an order-driven, small batch, job shop production
as depicted in Figure 3.
Figure 3: Complex Assembly Case Study.
Materials A and B are delivered on a regular basis
and kept on stock, whereas component C is ordered
based on the current demand. Whenever a new cus-
tomer order arrives, inventory is checked. If enough
parts are available, the order is released and the pro-
duction process starts. If not, the order has to wait
until new supplies arrive causing a delayed start of
Query-based Risks Management of Manufacturing Processes
341
production and potentially delayed deliveries. Mate-
rials A and B are polymer materials stocked as mats
out of which single components need to be cut in a
first production step prior to assembling and process-
ing all three components. Completed orders are di-
rectly shipped and no final products are kept in stock.
4 RISK-ORIENTED MODELLING
The modelling tool is based on a web-based graphical
editor using the JointJS (ClientIO, 2016) JavaScript
library. The modelling is done using drag and drop
and a property editor can be used to specify the re-
quired parameters. Figure 4 shows the modelling tab
of the user interface for our case study.
Figure 4: Risk-oriented modelling.
Stochastic values can be introduced in several
places, either integer (e.g. delivered quantity) or
real (e.g. delay) data types can be instantiated us-
ing respectively discrete and continuous probability
distributions. Specific components also have a na-
tive stochastic behaviour (e.g. processes with a failure
rate).
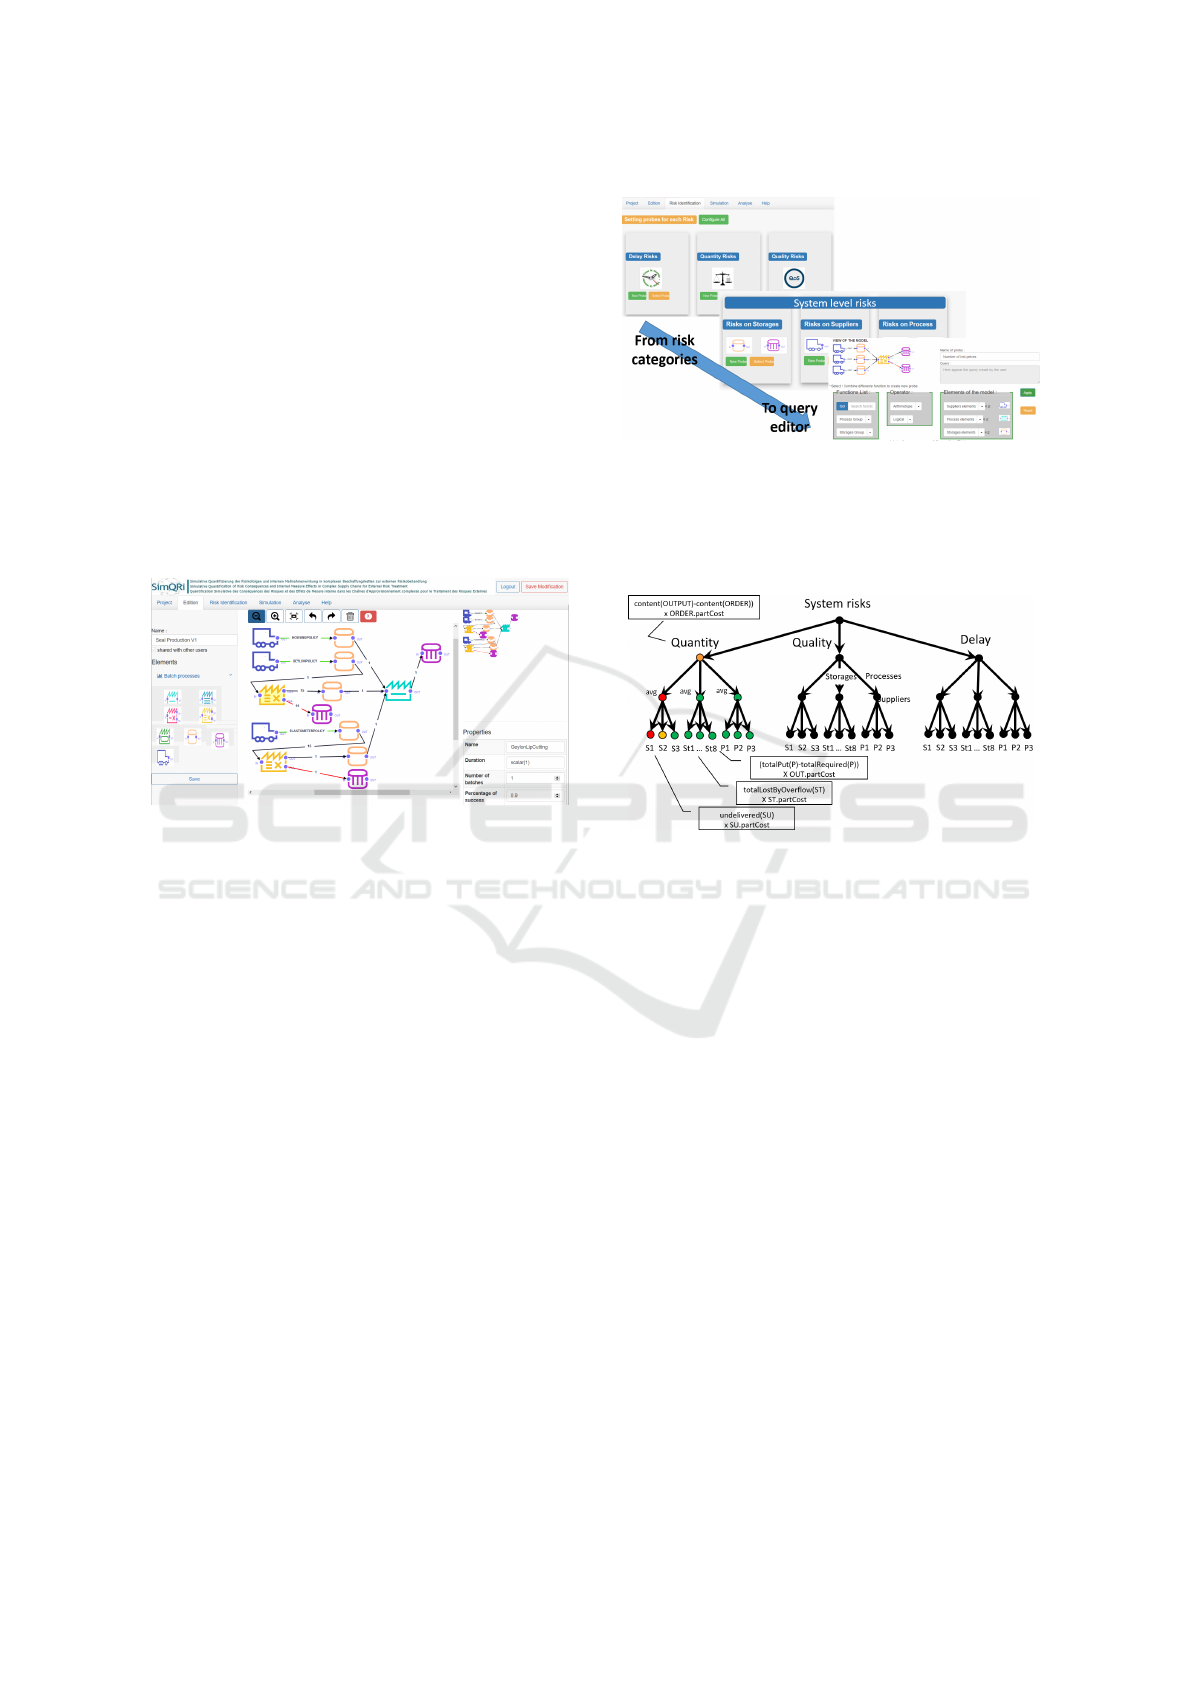
5 RISK IDENTIFICATION
After modelling a factory, the analyst can then move
to the risk identification tab of the interface. The tool
includes a wizard helping the user to express risk us-
ing our query language. A succession of screenshots
of this wizard is shown in Figure 5. It starts from
the main risk categories (quantity/quality/delay), then
guides the user into specifying how the risk can be
measured both at system level and then at component
level. At system level, the risk impact will be mea-
sured in monetary terms in order to allow the aggre-
gation and comparison of different kinds of risks. Of
course, component level risks does not always involve
a system: the goal is actually to design the system to
be resistant to component level risk occurrence. Fig-
ure 6 shows our simple generic risk model. With this
Figure 5: Encoding a query for a quantity risk.
model, generic queries can be defined for component
level while the risk analyst has to provide problem
specific queries that computes the mitigated risk at
system level.
Figure 6: Overview of our generic hierarchical risk model.
In the context of our case study, we defined the
following quantity risks:
• at system level, the global OUTPU T stor-
age can be compared with an ORDER book:
(content(OUT PUT ) − content(ORDER)) ∗
ORDER.partCost. We here use the agreed order
cost which may differ from the production cost.
• at component level, specific risks indicators
might, for a storage can be an overflowing
or full storage, raise quantity risk flags with
totalLostByOver f low(ST ) ∗ST.partCost. A sup-
plier might also fail to deliver the required quan-
tity undelivered(SU) ∗ SU.partCost. For a pro-
cess, meanLoad(P) can be an indicator if it is sat-
urating at 100%. The loss can be evaluated us-
ing the difference between measured and expected
production for a given process: (totalPut(P) −
totalRequired(P)) ∗ OUT.partCost
A number of predefined queries are available in each
context. Queries can also be edited and designed from
scratch using a plain text editor. Figure 5 shows the
encoding of a quantity risk measuring the number of
lost pieces in a factory.
SIMULTECH 2016 - 6th International Conference on Simulation and Modeling Methodologies, Technologies and Applications
342
6 RISK-ORIENTED SIMULATION
The next tab is devoted to running the simulator on
the model together with the queries to collect all the
required risk information. The simulator can be run in
two modes that are detailed in the rest of this section:
• in ”One Shot” mode, the simulator will return a
single trace with no statistical meaning. The trace
can be analysed to make sure about the general
behaviour of the supply chain and factory.
• in ”Monte Carlo” mode, the simulator will not
collect individual traces. Instead, it will compute
statistical information over the set of traces.
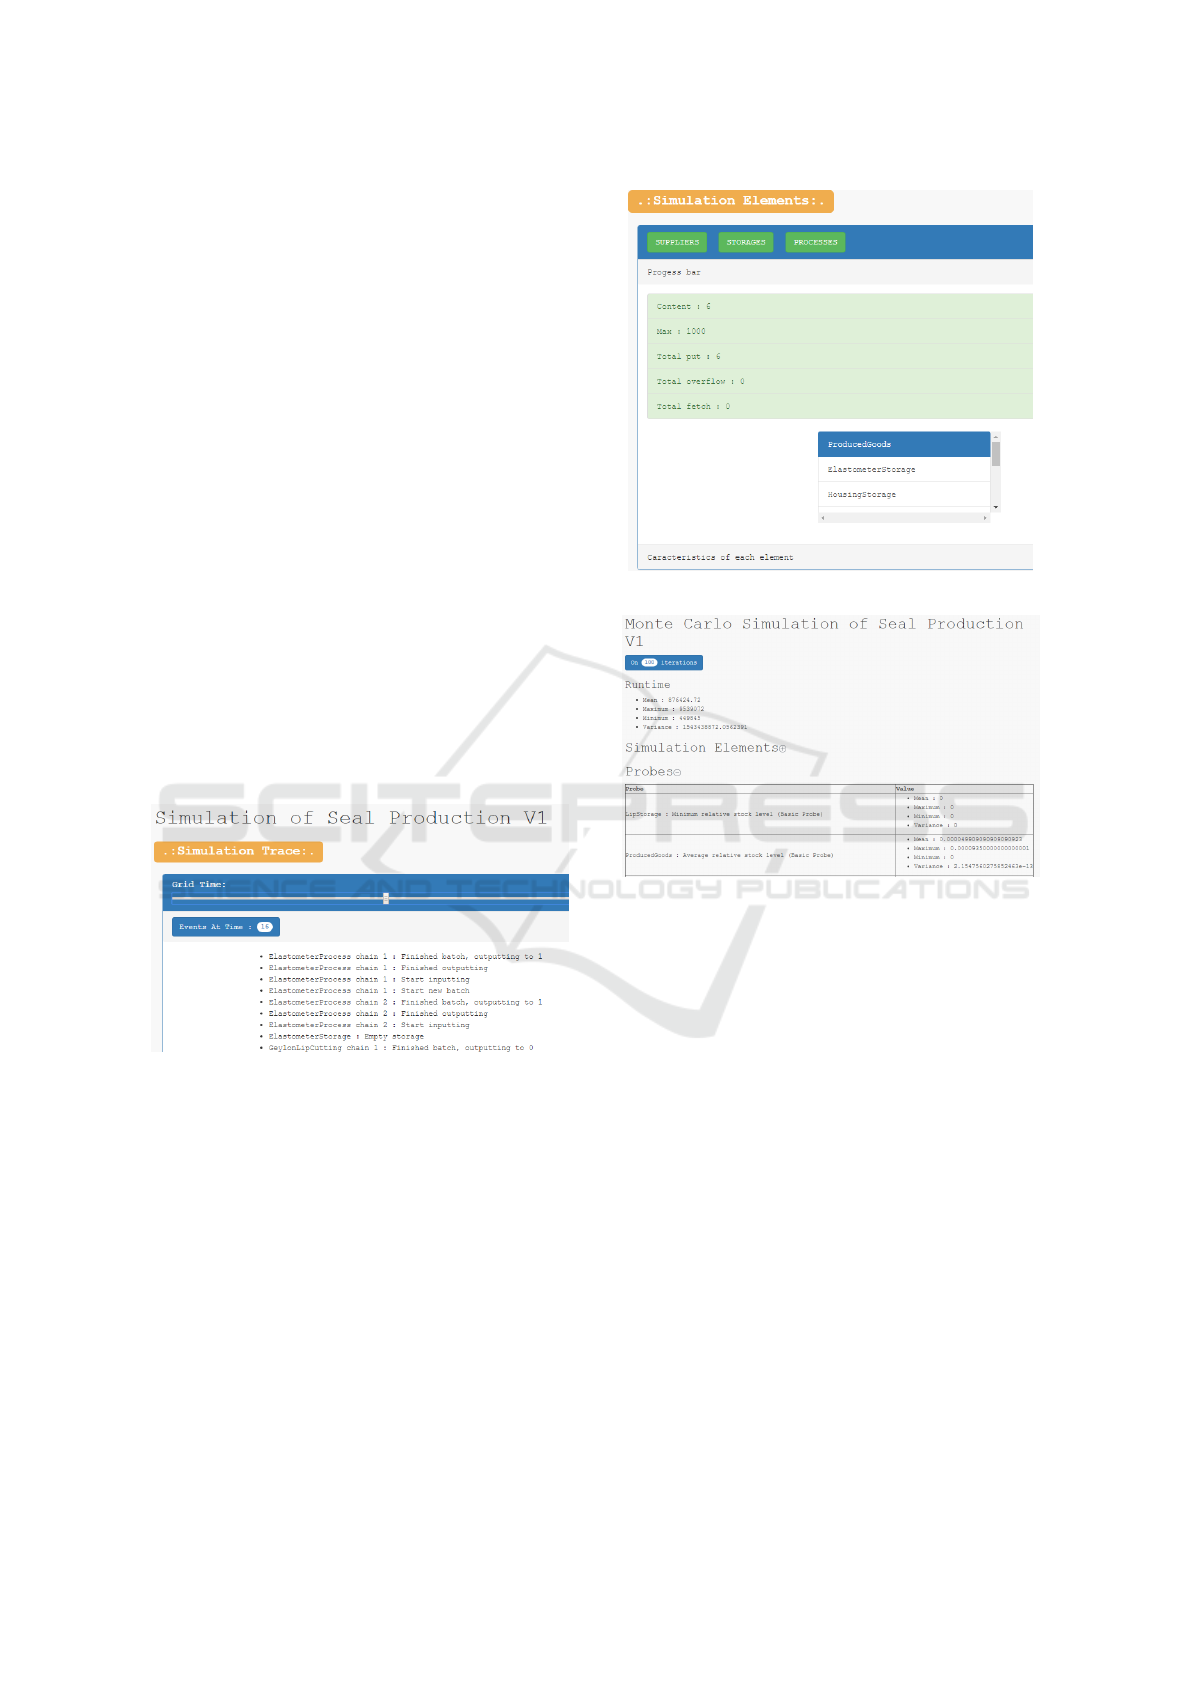
6.1 Trace Analysis
Different tools are available for trace analysis. The
first tool enables to explore a single trace using a
slider. At each event occurrence, the slider shows the
time and what occurred at that specific time. Time
is continuous, and expressed in an arbitrary unit, de-
cided for the whole model (it can be hours, seconds or
milliseconds depending on the domain and the risks).
Figure 7 shows the trace tool displaying a specific
time of a simulation of our case study.
Figure 7: Trace analysis tool.
Focusing on this specific time, it is possible
to zoom on any specific element or any query.
Figure 8 shows the state of the final storage for
ProducedGoods at time 11.
6.2 Statistics Overview
In Monte Carlo mode, the risk analyst can check
some key statistic indicators of the model elements
and queries, such as minimum, maximum, mean and
standard deviation (Figure 9). The full distribution of
the simulation data is available to the client for more
complex analysis.
Figure 8: Element detail at a specific time of a trace.
Figure 9: Overview of statistical data on queries and ele-
ments.
7 RISK ANALYSIS AND
MITIGATION ACTIONS
7.1 Risk Dashboard
Figure 10 shows the risk management dashboard at
the top-level for our case study. It displays a pie chart
representing the relative importance of the three main
risks (quality, quantity and delay) estimated at the sys-
tem level. The probability distribution of those three
risk factors are displayed in the bottom part. A dia-
gram on the left part also displays the evolution over
time of specific queries (by default the total risk). Two
curves are drawn: one displaying the expected value
(mean) of the indicator and the other displaying the
Value at Risk (VaR), i.e. the threshold loss value,
such that the probability that the loss over the given
time horizon exceeds this value is p (e.g. 5%) (Jorion,
2006). It is then possible to zoom in specific risk cate-
gories and explore how specific processes, storage or
Query-based Risks Management of Manufacturing Processes
343
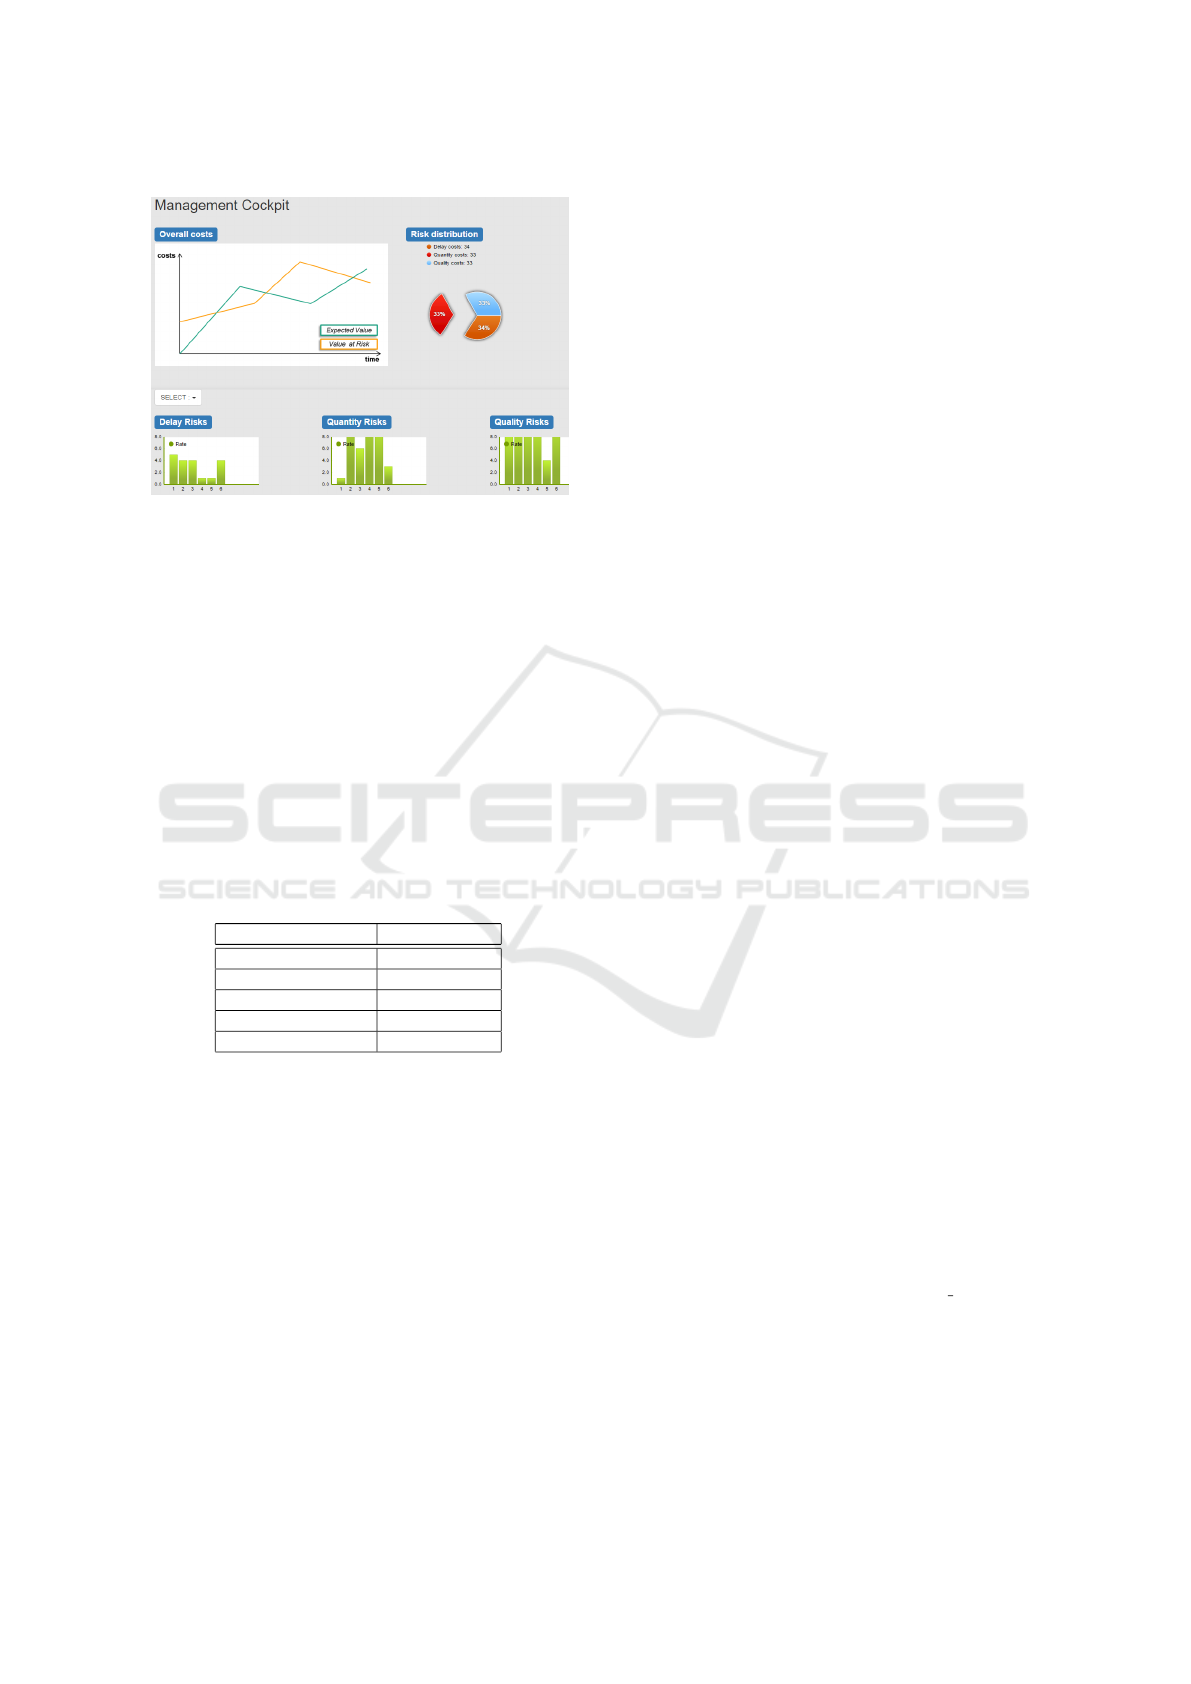
Figure 10: Top-level dashboard of the risk analysis.
suppliers behaves with respect to a specific risk.
7.2 Risk Control
Controlling the risks requires tuning the model in or-
der to minimise the estimated costs induced by risks.
However, changing a parameter in the model might
have multiple and possibly conflicting effects. The
tool supports a simple way to change the values of
some parameters to find out their optimal values,
given that other parameters remain constants. The
risk analyst can then perform a tuning-simulation-
analysis process on the model in order to find out the
best alternative to control the risk.
Table 1: Optimisation of the ordering threshold.
Ordering Threshold Size Process Idle Time
0 (wait empty) 70%
10 34%
20 5%
30 0.01%
40 0%
Table 1 shows the effect of the ordering thresh-
old on the idle time of the process directly fed by that
supplier. A zero threshold will result in a quite high
idle time as the process will have to wait the whole
delivery time. As the threshold is increased, the pro-
cess idle time is decreasing, but beyond the threshold
of about 30 parts, it reaches its full rate. There is no
reason to increase it more, since it will result in more
frequent deliveries and thus higher procurement costs.
8 CONCLUSIONS
In this paper, we presented a web-based interface al-
lowing to support risk assessment for supply chains
based on a simple risk model and a supply chain
model instrumented with risk queries. The risk model
can be easily instantiated using wizards and results
in an easy to interpret risk dashboard after the model
simulation. The tool relies on an efficient engine
able to perform large number of simulations includ-
ing stochastic parameters.
Our current experience with the tool is quite pos-
itive. We are carrying out a validation of the tool
on real-world cases provided by SMEs from Wallo-
nia and Germany. We are also enhancing the wizards
to help formulating common system-level risks. An-
other demand is to support a desktop-based interface.
To this purpose, we are implementing another front-
end relying on the Eclipse using EMF modelling and
the Sirius editor (Obeo, 2016).
ACKNOWLEDGEMENTS
This research was conducted under the SimQRi
research project (ERA-NET CORNET, Grant No.
1318172). The CORNET promotion plan of the Re-
search Community for Management Cybernetics e.V.
(IfU) has been funded by the German Federation of
Industrial Research Associations (AiF), based on an
enactment of the German Bundestag.
REFERENCES
ClientIO (2016). JointJS website. http://jointjs.com.
Landtsheer, R. D., Ospina, G., Massonet, P., Ponsard, C.,
Printz, S., Hrtel, L., and von Cube, J. P. (2016). A
Discrete Event Simulation Approach for Quantifying
Risks in Manufacturing Processes. In Int. Conf. on
Op. Research and Enterprise Systems (ICORES).
Deleris, L. and Erhun, F. (2005). Risk management in sup-
ply networks using Monte-Carlo simulation. In 2005
Winter Simulation Conference, Orlando, USA.
Jorion, P. (2006). Value at Risk, 3rd Ed.: The New Bench-
mark for Managing Financial Risk. McGraw-Hill.
Obeo (2016). Sirius Obeo Designer.
http://www.obeodesigner.com/sirius.
OscaR (2012). OscaR: Scala in OR.
https://bitbucket.org/oscarlib/oscar.
Printz, S., von Cube, P., and Ponsard, C.
(2015). Management of procurement risks
on manufacturing processes - survey results.
http://simqri.com/uploads/media/Survey Results.pdf.
Wieland, A. and Wallenburg, C. M. (2012). Dealing with
supply chain risks: Linking risk management prac-
tices and strategies to performance. Int. Journal of
Physical Distribution & Logistics Mngmt, 42(10).
SIMULTECH 2016 - 6th International Conference on Simulation and Modeling Methodologies, Technologies and Applications
344
