User Control of Force-directed Layouts
Wendy Lucas and Taylor Gordon
Computer Information Systems Department, Bentley University, Waltham, MA, U.S.A.
Keywords: Force-directed Layout, Constraint Specification, Infovis System, Visualization, Visualization Language.
Abstract: Force-directed layouts are typically used for minimizing overlaps in node-link graphs. This can make it easier
to interpret and derive meaning from the resulting visualization. Once such a layout is put in motion, however,
the person interacting with it has little control over the “final” layout. This paper describes an approach that
puts even inexperienced users in charge of force-directed layouts that are not limited to network diagrams.
The visual interface to a powerful but relatively easy to use visualization grammar has been augmented with
sliders for controlling the strength of constraints applied to visual objects. Users can change the balance of
power between constraints while the visualization is running, specify different constraints for groupings of
visual objects, turn off all or some of the constraints affecting the layout, or return a layout to its pre-constraint-
solving specification. This approach is a step towards addressing the need for tools with which all users can
control and interact with force-directed layouts.
1 INTRODUCTION
Force-directed algorithms are commonly used for
creating aesthetically pleasing graph layouts that
attempt to minimize the crossing of links in node-link
diagrams while clustering related nodes together.
This makes relationships between nodes easier to
discern. Such algorithms often model nodes as
charged particles that repel each other, with links
acting as dampened springs that pull related nodes
together (Heer, Bostock, and Ogievetsky, 2010).
Figure 1a: Force-directed graph layout.
The position of each node is calculated to
maintain an equilibrium that minimizes the overall
kinetic energy in the graph. A force-directed layout is
continuously in motion and will not necessarily be in
the same configuration each time it is rendered.
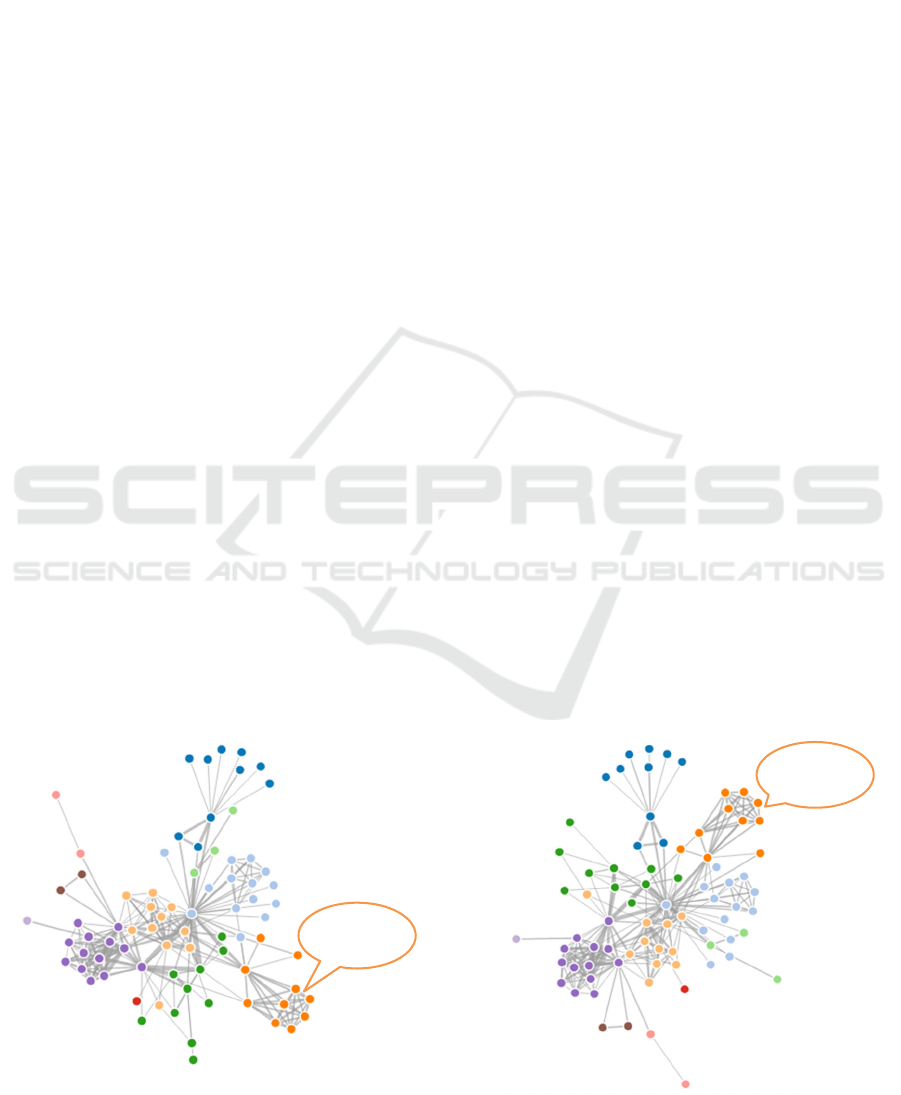
As an example, Figure 1a shows a force-directed
graph of character co-occurrence in Les Misérables
(Bostock, M., 2016) that has been implemented in D3
(Bostock, Ogievetsky, and Herr, 2011). Figure 1b
shows the results of reloading the visualization shown
in Figure 1a by refreshing the browser.
Figure 1b: Force-directed graph after reloading.
Orange
node cluster
Orange
node cluster
Lucas, W. and Gordon, T.
User Control of Force-directed Layouts.
DOI: 10.5220/0006008600910099
In Proceedings of the 11th International Joint Conference on Software Technologies (ICSOFT 2016) - Volume 1: ICSOFT-EA, pages 91-99
ISBN: 978-989-758-194-6
Copyright
c
2016 by SCITEPRESS – Science and Technology Publications, Lda. All rights reserved
91

The nodes appear in different positions, as noted
in the figures for a cluster of orange nodes and easily
observable for the other nodes and clusters as well.
There are limited means available for interacting
with force-directed layouts. Users can:
Drag on a node or node grouping. This will
cause the graph to shift. The at-rest positioning
of all of the nodes in the diagram cannot be
precisely known ahead of time.
Jiggle a node. A quick back and forth motion
applied to a node can be helpful for untangling
links that have crossed.
Beyond these two mouse motions, there are
typically no other mechanisms provided for exerting
control over the layout. Ultimately, it is the
underlying algorithms that have the final say in node
positioning. In most cases, the user will know little if
anything about those algorithms. The ways in which
various forces may be exerted on the graphical
components in a layout will also be unknown. Since
those forces are usually configurable only through
coding, there is little benefit to derive from sharing
that information with the typical user, who cannot be
expected to be an experienced programmer.
The motivation for the work presented here is
based on the premises that:
Users can be provided with easy-to-use and
equally easy-to-understand mechanisms for
manipulating forces in visualizations that affect
layouts. The positions of graphic objects in
those layouts can thus be controlled with far
greater subtlety than is provided by the
currently supported mouse-based interactions.
While force-directed layouts are typically
associated with network graphs, forces can be
applied to any graphic object in any type of
layout. This provides users with additional
means for making effective use of positional
data in all types of visualizations.
Providing more ways to interact with and
control force-directed layouts has potential
benefits to the user in both analysis and
presentation activities.
The approach described here for providing this
type of functionality is built upon a relatively simple
declarative language (Lucas and Shieber, 2008). It
enables the specification of visual layouts by tying
graphical objects to data values via a scaling function.
The actual placement of objects is influenced by the
strengths of the constraints applied to them in
conjunction with user manipulation. The language
specification currently supports five constraint types,
namely equality, approximate equality (henceforth
referred to as near), non-overlap, and horizontal and
vertical alignment.
The language has been implemented in a proof-of-
concept information visualization (Infovis) prototype
that provides functionality for specifying and running
code, viewing and interacting with the rendered layout,
and manipulating constraint strengths.
The user can interact directly with a force-
directed layout via mouse movements and by
manipulating slider components that control the
strength of the constraints exerted on the objects in
that layout. An initial empirical study was conducted
with eleven participants using an earlier version of the
language and prototype. It demonstrated the
usefulness of this approach to constraint strength
manipulation in enabling participants to exert control
over a force-directed tree graph that was subjected to
conflicting constraints (Lucas, 2014).
This paper builds on that work by demonstrating
the use of constraints in visualizations that are not
limited to node-link graphs. It also describes the
addition of controls to the visual interface that allow
the user to:
Pause and resume the constraint solving
process. This provides users with the
opportunity to manipulate graphic objects and
to explore the visual representation without
needing to be concerned about inadvertently
changing the layout.
Apply a bounding box constraint to confine
graphic objects to a specified area.
Add new constraints while a visualization is
running to a selected group of graphic objects.
A free-form “lasso” tool is used for selecting
objects to add to a group. A distinct set of
constraint strengths can then be applied to all
of the objects in the grouping. The strengths of
the constraints specified on a group override
the constraint strengths specified for all objects
in the layout.
The motivation behind this work is to help bridge
the gap between the goals of the users of Infovis
systems and the techniques that are currently
available to them for interacting with force-directed
layouts. While sophisticated users can create
customized visualizations and their own widgets for
manipulating them, those without such expertise have
no such recourse (Pantazos and Lauesen, 2012). This
paper demonstrates the advantages of having built-in
mechanisms for controlling and manipulating force-
directed visualizations.
The next section of this paper discusses related
work. This is followed by a description of the visual
interface and the mechanisms it provides for
ICSOFT-EA 2016 - 11th International Conference on Software Engineering and Applications
92

controlling constraint-based layouts. The benefits of
giving users this capability are then illustrated by
example. The paper concludes with a discussion of
the contributions of this work and directions for
future research.
2 RELATED WORK
Yi et al. (2007) note that Infovis systems have two
main components: representation and interaction.
They argue that the representation component has
received the vast majority of attention in Infovis
research. A search of recent literature finds this to still
be the case. Most Infovis papers focus on novel
methods for representing data sets, with interaction
techniques relegated to a back seat roll.
Yi et al. (2007) identify seven categories
regarding the intent of interaction: select, explore,
reconfigure, encode, abstract/elaborate, filter, and
connect. Commonly employed interaction techniques
for supporting these activities include tool-tips for
providing detailed information, selection (of data
points, menu operations, etc.), navigation (zooming,
panning), sorting, and bushing and linking (for
highlighting the representation of selected data items
in other views).
A less commonly used interaction technique that
is particularly relevant to the work presented in this
paper is referred to as the “jitter” operation, which
allows the user to apply jitter to each item in a
visualization. This causes items to randomly shift by
a small spatial increment, thus revealing items that
may have previously been hidden by other items.
Users also gain a greater awareness of the items in a
region as a result of this shifting. The jitter operation
is supported in Spotfire®, a commercially available
Infovis system (Ahlberg,1996; Spotfire, 2016).
The Dust & Magnet multivariate information
visualization technique achieves a similar effect (Yi
et al., 2005). It visualizes data items as specks of iron
that move when magnets representing data attributes
are manipulated. The “Spread Dust” operation makes
data items gradually repel each other, which also
reduces the number of overlapping data items.
The constraints that users can apply in the
approach described in this paper often result in
conflicting forces that cause jitter between elements.
Since forces can be applied to selected groups of
graphic objects, jitter can be used to reveal hidden
items in portions of a visualization and to enhance
exploration in all or part of the rendered layout.
Moreover, the user is able to precisely control the
amount of jitter by adjusting the strengths of the
constraints. The visualization can also be paused to
allow further exploration of items that had previously
been hidden. Users can then manipulate the position
of those items without interference from the
constraint-based forces that would otherwise be
acting upon them.
Another important tool for supporting
interactions is the slider. Sliders are typically used in
dynamic queries for narrowing the range of data
points to be selected (Yi et al., 2007). Heer and
Shneiderman (2012) describe their usefulness for
filtering ordinal, quantitative, and temporal data.
Sliders also provide a form of zooming by filtering
the visible data range. Many commercially available
Infovis systems provide sliders for selecting one or a
range of field values (see, for example, Spotfire,
2016; Tableau, 2016, and QlikView, 2016).
In the approach described in this paper, sliders are
used for controlling the strength of forces applied to
all graphic objects or subsets of those objects. Instead
of being used to impose limits on the value of a data
field, sliders provide users with an additional means
for affecting the positions of objects of any type, not
just nodes and links.
To the best of our knowledge, sliders have not
been applied for this purpose in commercially
available Infovis systems. They have been used,
however, in a constraint-based network diagram
authoring tool referred to as Dunnart (Dwyer, T.,
Marriott, K., Wybrow. M., 2009). This structural
layout tool is explicitly invoked by the user to re-
layout a network while satisfying the placement
constraints imposed by that user. It also imposes a
layout style on the diagram. The user can manipulate
sliders to change parameters of a goal function that
measures the quality of a layout. For example, a slider
can be used to adjust the minimum separation
between nodes connected by directed edges.
Sophisticated coders can always devise their own
means for controlling force-based visualizations. At a
minimum, the strengths of the applied forces can be
changed programmatically. Controlling constraint
values in this way is neither interactive nor dynamic,
however.
In an approach that is the most similar to that
taken here, the Snark graph visualization
demonstrations use simple, slider-based interfaces for
setting parameter values related to forces in network
diagrams (Hall, 2014). Those sliders were developed
using Google’s dat.gui controller library for
JavaScript.
The public availability of such a tool is an
indication of the usefulness of this approach for
controlling force-directed layouts. We were unable
User Control of Force-directed Layouts
93
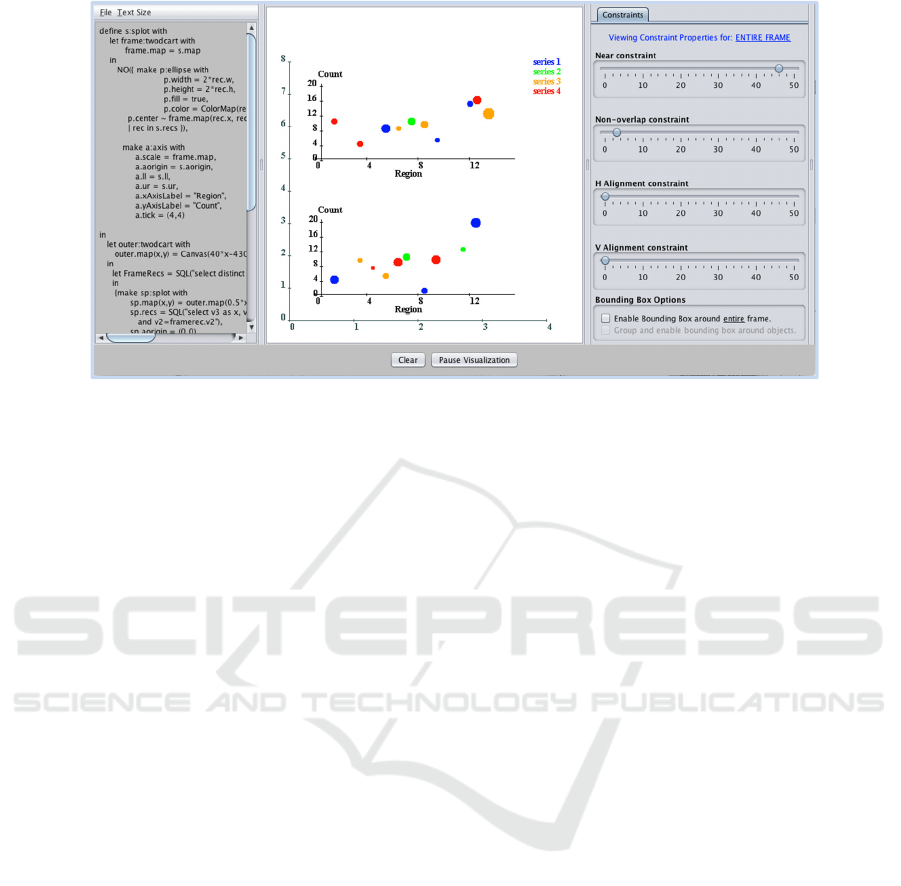
Figure 2: Interface panels include a coding window, a drawing area where the visualization is rendered, and a panel with
components for manipulating constraints.
to find any examples of such tools being developed or
used for anything beyond network diagrams.
In the following pages, we demonstrate the
benefits of putting users in charge of force-directed
visualizations involving any type of graphic object,
not just nodes and links. Providing interactive means
for applying, removing, and controlling constraints
adds to the repertoire of tools available to users for
exploring and presenting data visualizations.
3 SPECIFYING AND
MANIPULATING
CONSTRAINTS
This section describes the controls provided in the
visual interface of the Infovis prototype that allow
users to manipulate the strength of constraints in
force-directed layouts. As noted earlier, five
constraints have been implemented in the language
specification. This subset of positional constraints is
defined as follows:
Equality (=): anchors the position of a visual
object to a data value or another visual object.
Near (~): specifies that a visual object should
be within close proximity (as defined in the
constraint resolution algorithm) of a data value
or another visual object.
Non-overlap (NO): specifies that two or more
visual objects should not overlap.
Horizontal alignment (HAlign): aligns one or
more visual objects along the x-dimension.
Vertical alignment (VAlign): aligns one or
more visual objects along the y-dimension.
Figure 2 shows a screenshot of the interface,
which includes detachable panels for (1) specifying
and running code, (2) viewing and interacting with
the rendered layout, and (3) manipulating the
strengths of positional constraints and enforcing
bounding box constraints. Four positional constraints
are controlled via the sliders shown in the figure; the
equality constraint is not included here as its value is
absolute. A constraint is unenforced when its slider is
set to 0 and is at its maximum value when its slider is
set to 50. The bounding box constraint is either on
(enforced) or off (unenforced). Clicking on the
checkbox beneath the sliders enforces this constraint
around the entire frame (i.e., graph drawing area).
The forces exerted on the objects to keep them within
the frame counteract forces from the positional
constraints that may be pushing them outward. The
user can also specify via a selection tool that
particular visual objects comprise a group. A
bounding box can then be enabled around that group.
Two buttons are located at the bottom of the
interface. The “Clear” button terminates the
visualization process and clears the drawing area. The
“Pause Visualization” button stops all constraints
from acting on the visual objects, so that the graph
stays in whatever state it was in immediately prior to
the user clicking this button. This makes it possible
for the user to interact with the objects in the layout
without having to counteract the forces in effect on
those objects. The label on this button toggles
between pausing and resuming the visualization.
Resuming the visualization will put the constraints
ICSOFT-EA 2016 - 11th International Conference on Software Engineering and Applications
94
back into effect in accordance with the values set on
the corresponding sliders.
As a simple example of the graph specification
and visualization process, consider the generation of
a scatterplot in which filled circles of various colors
represent data points.
Figure 3 contains the code for defining this
visualization. Properties for the graphic components
are selected in this example by an SQL query to a
database table. Each data point in the chart is
represented by a graphic object of type ellipse. Since
the width and heights are equal, they will be rendered
as circles. A built-in scale called the Canvas maps
data values to positions in the drawing area. In this
program, the mapping is one-to-one for each x and y
coordinate.
let circles = {make s:ellipse with
s.center ~ Canvas(x,y),
s.width = rec.radius,
s.height = rec.radius,
s.color = ColorMap(rec.color),
s.fill = true
| rec in SQL("select x, y, color, radius from
table")}
in NO(circles), HAlign(circles), VAlign(circles);
Figure 3: Scatterplot specification with near, non-overlap,
horizontal alignment, and vertical alignment constraints
applied to the position of visual objects rendered as circles
in the output.
Four constraints have been specified in the code
on the positions of the graphical objects, all of which
may conflict. The near constraint will pull each circle
toward the specified x and y coordinate values. At the
same time, the non-overlap constraint will push apart
any circles that are centered at approximately the
same location. The horizontal alignment and vertical
alignment constraints will conflict with each other
and may also conflict with the near and non-overlap
constraints.
Thus, the constraint resolution process will
require user intervention to determine which objects
in the visualization should have their positions
controlled by which constraints and what the strength
of those constraints should be.
Figure 4 shows the output from executing the
code in Figure 3 with all constraint strengths initially
set to 0. The x-y coordinates that determine the initial,
center position of the circles are all in close proximity
to each other.
In order to be able to see each of the circles, the
user could manually separate them by dragging each
one with the mouse to a new location. Alternatively,
the user can manipulate the constraint strength sliders
Figure 4: Initial scatterplot rendering with no constraints
activated.
to force the objects apart. Increasing both the near and
non-overlap constraint values to the value of 25 will
cause the circles to jitter between positions, as the
near constraint will pull them toward the location
specified by their x-y coordinate values while the
non-overlap constraint will push them apart.
Lessening the value of the near constraint from its
midpoint slider value and increasing the value of the
non-overlap constraint from its midpoint value will
allow the circles to move away from their initially
specified positions until the forces reach equilibrium.
It may also be helpful to enforce the bounding box
constraint to ensure that none of the objects are
pushed out of the frame before the circles come to
rest. The result of following this approach is shown in
Figure 5, in which the near constraint slider has been
set to 5 and the non-overlap constraint slider has been
set to 45.
To see the data values associated with each object,
the user can double-click on it. A textbox containing a
description will appear next to the clicked object, as
shown in Figure 5. If the user has not specified a
description attribute for the objects to be generated by
the code, then the default description will be used. This
consists of the type of object and an auto-specified id
number (“Ellipse 17” for the black circle clicked in
Figure 5) and the attribute values for that object (i.e.,
the underlying values defined in the database table).
For an ellipse, those properties are the actual x and y
data values for the center coordinate and the width and
height values.
The user can right-click on an unpopulated
portion of the frame to activate a “lasso” tool that is
used for selecting objects in the layout and adding
them to a group. To make the selection process easier,
the user can pause the visualization by clicking on the
pause button. Once the selection has been completed,
clicking that button again will cause the visualization
to resume. Figure 6 shows the use of the lasso tool for
selecting some of the red circles in the layout. When
Overlapping
circles
User Control of Force-directed Layouts
95
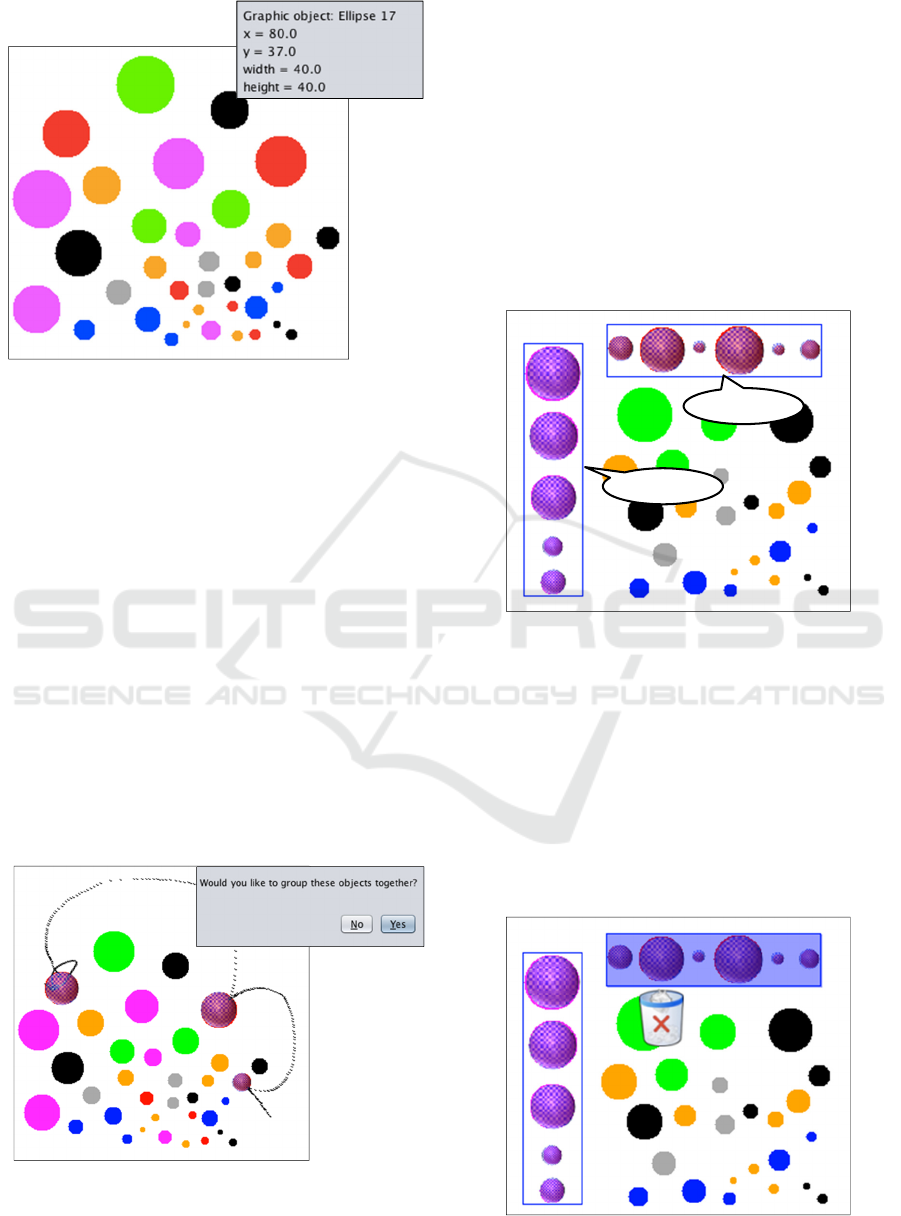
Figure 5: The scatterplot layout with the Near constraint set
to 5 and the Non-overlap constraint set to 45. Double-
clicking on an object reveals its properties.
the mouse button is released, a pop-up window will
appear, asking the user if the selected objects should
be grouped together. If the user responds in the
affirmative, then the group is created and assigned a
group number, starting with Group 1 for the first
specified grouping, Group 2 for the second, etc.
Clicking on any object in a group changes the
Constraint Slider window shown in Figure 2 from
displaying the strengths of constraints applied to all
objects in the entire frame to one displaying the
strengths of constraints to be applied to the objects in
that grouping. Group constraints will override those
specified for the entire frame. For example, if the
Near constraint slider is set to 40 for the objects in the
frame but to five for the objects in a group, then the
latter will be the strength of the constraint applied to
objects in the grouping.
Figure 6: Use of lasso tool for selecting graphic objects and
adding them to a grouping.
Figure 7 shows the outcome of the user selecting
two groups of objects from the scatterplot and
applying different constraints to each of those groups.
All of the red circles have been selected for Group 1,
while all of the purple circles are in Group 2. The
horizontal alignment constraint for the first group has
been increased to its maximum value, while the
vertical alignment constraint for the second group has
been maximized. The user has also dragged the
objects in each grouping to different positions in the
layout. Since the objects are subject to alignment
constraints, dragging one object in a group moves all
of the other objects as well.
Figure 7: HAlign set to 50 for Group 1 and VAlign set to
50 for Group 2.
To remove an object from a grouping, the user must
first pause the visualization by clicking the pause
button and then right-clicking on the object. The
grouping box will be highlighted in blue, and a recycle
bin icon will appear under the selected object, as shown
in Figure 8. Clicking the ‘X’ on the bin will delete the
object from the group. The user can then select more
objects for removal. When this process has been
completed, the resume button can then be clicked.
Figure 8: Removing an object from Group 1.
Group 2
Group 1
ICSOFT-EA 2016 - 11th International Conference on Software Engineering and Applications
96
A visualization can be returned to its initial layout
by setting the near constraint to its maximum value
and all other constraints to zero. The graphic objects
will then move back to their scaled data values.
4 APPLICATION EXAMPLES
The following examples demonstrate how data
presentation and exploration activities can be
enhanced by providing users with interactive tools for
applying and controlling constraints on graphic
objects.
4.1 Maps
Maps are among the earliest known visualizations.
While there are several different map types, what
many share in common is the use of labels to identify
locations. Label placement is difficult, as labels
should be clearly visible when the user zooms in or
out and should remain anchored to the area they are
labelling. At the same time, labels can hide details
that would be helpful for the user to view.
Constraints can be useful in addressing these
issues. Near constraints can be used to tie the location
of a label to the object it is labelling. As the user
zooms in and out, the size of the label should change
in proportion to the zooming, but the position should
remain fixed to the same location on the labelled
object.
To address the issue of labels covering up other
data, near and non-overlap constraints can be
manipulated to allow the labels to disclose underlying
information. Specifically, near constraints can be
decreased while non-overlap constraints can be
increased. Constraint strength can then be reversed to
return the labels to their correct positions.
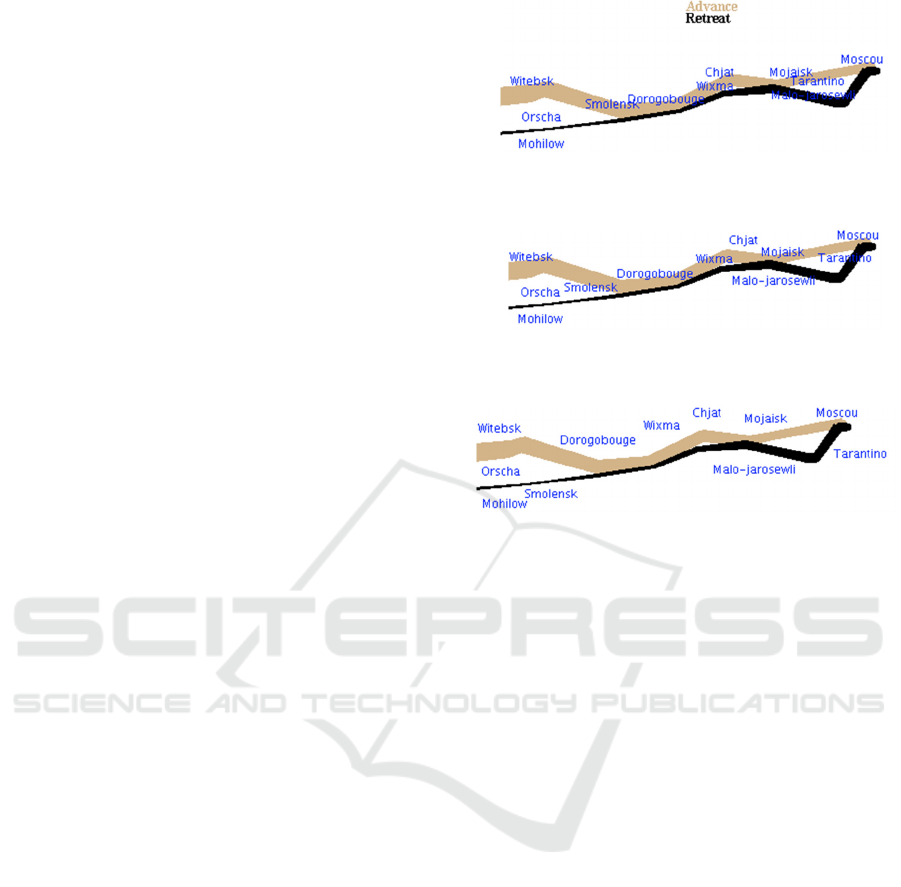
As an example of this second issue, consider
Charles Minard’s famous depiction of Napoleon’s
march on Moscow. This is an example of a flow map,
which represents locations as well as the flow of
objects from one location to another. Minard’s
depiction uses approximate geography in showing
troop movements, with the width of the routes
indicating the number of surviving troops and the
color indicating the direction of troop movement.
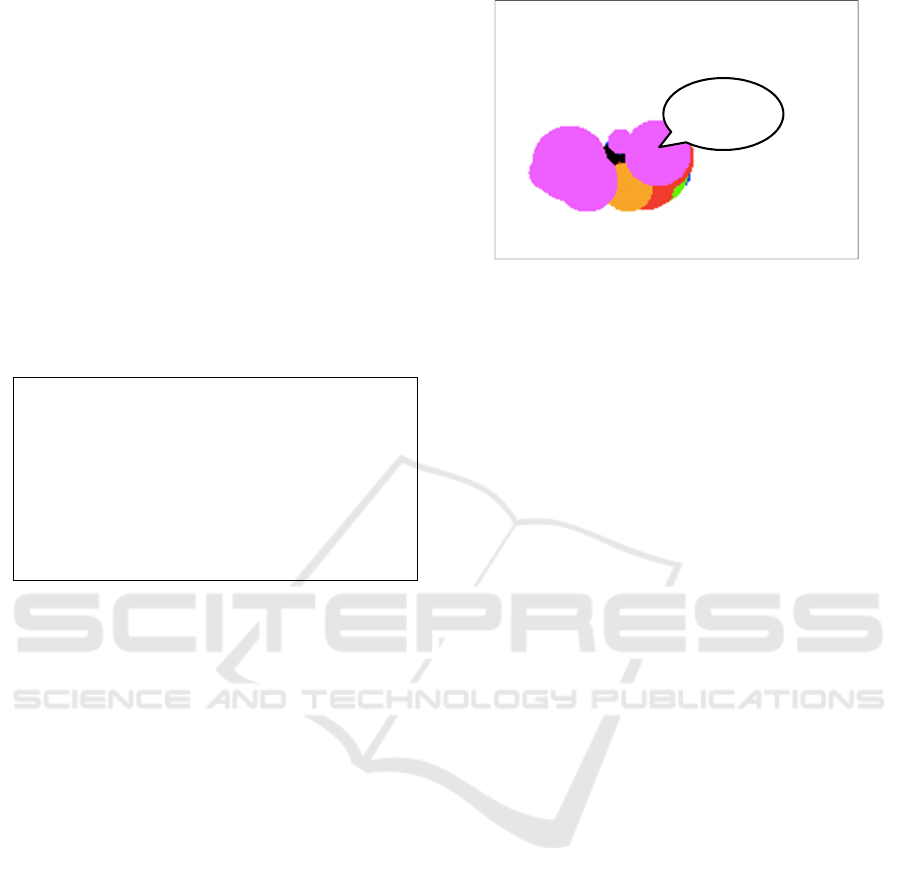
Figure 9a shows a portion of the map generated
with the prototype. Constraint strengths are all set to
zero, so labels appear at their specified locations.
Figure 9a: A portion of Napoleon’s March on Moscow,
based on Charles Mindard’s depiction.
Figure 9b: The layout from Figure 8a with non-overlap
constraint on labels enforced.
Figure 9c: The layout from Figure 8a with non-overlap
constraints on labels and labels-lines enforced.
In Figure 9b, the strength of the non-overlap
constraint on labels has been increased. At the same
time, the strength of the near constraint has also been
increased to keep the labels near the correct location.
The amount of that increase was less than the amount
by which the non-overlap constraint was increased,
however, as the visibility of the labels was deemed to
be more important than their position. It is now
possible to read most of the labels, but some are still
hidden by solid black lines.
In Figure 9c, the non-overlap constraint has been
specified on labels not overlapping with other labels
and on labels not overlapping with lines. The near
constraint has been slowly weakened until the
conflicts between the near and non-overlap
constraints have been resolved. All labels can now be
easily read.
To return the labels to their correct positions, the
near constraint should be increased to its maximum
value and the non-overlap constraint decreased to
zero.
A shortcoming of this approach is that there is no
indication in figures 9b and 9c that the labels are not
in their correct location. At this point, it is up to the
user to add notification indicating that this is the case.
A system-based solution would be to have the option
of showing a breadcrumb-like trail leading from the
actual position to the revised position in those cases
where location is relevant.
User Control of Force-directed Layouts
97
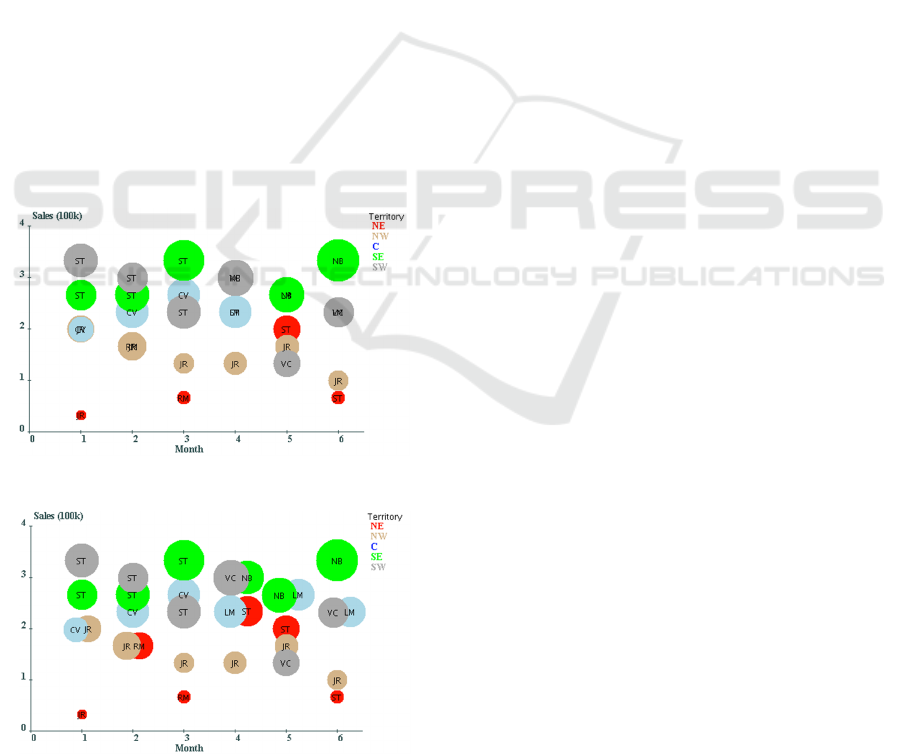
4.2 Scatterplot
The scatterplot in Section 3 demonstrated how to
specify and manipulate constraints but did not
provide a real-world application. Figure 10a shows a
scatterplot of sales data by region, i.e., northeast
(NE), northwest (NW), central (C), southeast (SE),
and southwest (SW). The time frame is a six-month
period, as marked on the x-axis. The center of each
circle indicates the dollar amount of sales, as depicted
on the y-axis, for the corresponding month. Each
circle is labelled with the initials of the sales manager
for that region during that time period. The radius of
each circle is proportional to the number of sales.
Note that some of the sales data is not visible, as
more than one region could have approximately the
same amount in sales for a given month. Figure 10b
shows an alternative layout in which circles
representing sales with equal values are aligned
horizontally. While the circles representing sales by
month by territory have shifted a bit from their x-
coordinate values, it is still possible to discern the
month with which each is associated. If several
regions have identical monthly sales, the scale can be
changed to accommodate a larger number of
horizontally aligned objects. Panning and zooming
could then be used as needed.
Figure 10a: Sales by month by territory.
Figure 10b: Sales data from Figure 10a with horizontal
alignment strongly enforced on groups of sales objects with
identical center locations.
To generate the layout in Figure 10b, the non-
overlap constraint was first minimally enforced on all
circular objects so that any hidden ones would be
revealed. Those that were overlapping were forced
apart in opposite directions diagonally. Groupings
were then created for each set of circles that had the
same x-y coordinates for their center positions. For
each group, the horizontal alignment constraint was
set to a strong strength, the near constraint to a
medium strength, and the non-overlap constraint to a
low strength. Removing the non-overlap constraint on
all circles in the canvas while maintain the constraints
on the groups yielded the final layout.
Resetting the near constraint to its maximum
value and all other constraints to zero will return the
visualization to the layout shown in Figure 10a.
This example demonstrates how the user can gain
greater awareness of the underlying data values and
commonalities in sales data through the application of
constraints. Being able to apply constraints on groups
of objects also made it possible to present the data in
a more meaningful way.
5 CONCLUSIONS
Our focus in this paper has been on visual controls
that enable users to enforce and manipulate
constraints governing force-based layouts. While
much attention has been paid by the research
community on the representation component of
Infovis systems, far less has been devoted to
providing interaction techniques that support the user
in data exploration activities. Force-directed
visualizations pose an especially difficult challenge
when it comes to interaction, as users have little
control over the layout. Any attempts at exploration
are likely to result in changes to object positions that
are not always predictable or desirable.
We have presented a prototype that supports the
specification, generation, and control of constraint-
based visualizations. These visualizations are
expressed in the language upon which the prototype
has been built. The positional attributes of any type of
graphic object supported by the language can be
subject to constraints. Force-directed layouts are
therefore not limited to node-link diagrams.
This paper demonstrates by example how the user
can adjust the strengths of enforced constraints by
manipulating sliders provided in the interface for this
purpose. Users can also specify new constraints while
visualizations are on-going by selecting groups of
objects and applying separate sets of constraints to
those object groupings. Having the ability to pause
ICSOFT-EA 2016 - 11th International Conference on Software Engineering and Applications
98

and resume a force-based layout also makes it
possible for the user to examine data values without
risking unintended changes to the layouts. All of these
capabilities provide users with additional ways in
which to explore and manipulate force-directed
layouts for analysis and presentation purposes.
The approach taken in this paper is not the only
way to provide the functionality described here.
Rather, it is intended as a proof-of-concept that it is
both possible and worthwhile to support users in these
types of interaction activities.
In future work, we will be evaluating this
approach with users and making adjustments based
on their feedback. We are also working on adding
other constraints to both the language and the
interface for providing users with additional means
for controlling and interacting with force-directed
layouts.
REFERENCES
Ahlberg, C. 1996. Spotfire: an information exploration
environment. SIGMOD Record, vol. 25, no. 4, pp. 25-29.
Bostock, M., 2016. Mike Bostock's Blog - Force-Directed
Graph,” (accessed April 14, 2016), available at
http://bl.ocks.org/mbostock/4062045.
Bostock, M., Ogievetsky, V., Heer. J., 2011. D
3
Data-
Driven Documents. IEEE Transactions on
Visualization and Computer Graphics, vol. 17, no. 12,
pp. 2301-2309.
Dwyer, T., Marriott, K., Wybrow. M., 2009. Dunnart: A
constraint-based network diagram authoring tool. In
Proceedings of the 16th International Symposium on
Graph Drawing (GD'08), LNCS 5417, pp. 420–431,
Springer-Verlag.
Hall, S., 2014. delimited.io: A blog about JavaScript and
graphics in the browser; Snark Hunting: Force Directed
Graphs in D3, accessed April 14, 2016 from
http://www.delimited.io/blog/2014/6/17/force-
directed-graphs-in-d3.
Heer, J., Bostock, M., Ogievetsky, V., 2010. A tour through
the visualization zoo. Communications of the ACM,
vol. 53, no. 6, pp. 59-67.
Heer, J., Shneiderman, B., 2012. Interactive dynamics for
visual analysis. Communications of the ACM, vol. 55,
no. 4, pp 45-54.
Lucas, W., 2014. An Interactive Approach to Constraint-
Based Visualizations. Human Interface and the
Management of Information. Information and
Knowledge Design and Evaluation, (HCII’14), LNCS
8521, Springer, pp. 54-63.
Lucas, W., Shieber, S. M., 2008. A Simple Language for
Novel Visualizations of Information. In Joaquim Filipe,
Boris Shishkov, Markus Helfert, and Leszek A.
Maciaszek, eds., Communications in Computer and
Information Science: Software and Data Technologies,
Springer-Verlag Berlin Heidelberg, vol. 22, pp.33-45.
QlikView, 2016. http://www.qlikview.com/
Pantazos, P., Lauesen, S., 2012. Construction
Visualizations with InfoVis Tools – An Evaluation
from a User Perspective. In the International
Conference on Information Visualization Theory and
Applications (IVAPP’12), pp. 731-736.
Spotfire Inc., 2016. http://spotfire.tibco.com/.
Tableau, 2016. http://www.tableausoftware.com/
Yi, J. S., Kang, Y. a., Stasko, J., Jacko. J., 2007. Toward a
Deeper Understanding of the Role of Interaction in
Information Visualization. IEEE Transactions on
Visualization and Computer Graphics, vol. 13, issue 6,
pp. 1224-1231.
Yi, J. S., Melton, R., Stasko, J. T., Jacko, J. A., 2005. Dust
& Magnet: multivariate information visualization using
a magnet metaphor, Information Visualization, vol. 4,
pp. 239-256.
User Control of Force-directed Layouts
99
