
Relationship between Depression Level and Bio-signals by Emotional
Stimuli
Eun-Hye Jang, Ah-Young Kim, Sang-Hyeob Kim and Han-Young Yu
Bio-Medical IT Convergence Research Department, Electronics and Telecommunications Research Institute,
Gajeongno, Yuseong-gu, Daejeon, Republic of Korea
Keywords: Depression, Bio-Signal, Emotion.
Abstract: Recent studies in mental/physical health monitoring have noted to improve health and wellbeing with the
help of Information and Communication Technology (ICT) and in particular, application of biosensors has
mainly done because signal acquisition by non-invasive sensors is relatively simple as well as bio-signal is
less sensitive to social/cultural difference. Prior to developing a depression monitoring system based on
non-invasive bio-signals, we examined a relationship of depressive level and changes of biological features
during exposure of emotional stimuli. Ninety-six subjects’ depressive level was measured by a self-rating
depression scale (SDS). Electrocardiogram (ECG) and photoplethysmograph (PPG) were recorded during
six baseline and emotional states (interest, joy, neutral, pain, sadness and surprise) and heart rate (HR) and
pulse transit time (PTT) were extracted. Pearson’s correlation was conducted to examine the relation of
depressive level and biological features. The results showed that relation of depressive level and HR is
positive in emotional states and there is a negative correlation between depressive level and PTT. We
identified that they are meaningful biological features related to depression.
1 INTRODUCTION
In the field of ICT for health and wellbeing, the most
current trends have shown that there have been
increasingly various studies on correlating mental
disorders to non-invasive biological measures such
as skin conductance response, heart rate, and
temperature. They have several advantages in that
signal acquisition by non-invasive sensors is
relatively simple as well as bio-signal is less
sensitive to social/cultural difference. Also, it is
known that several bio-signals are significantly
correlated with human emotional state (Drummond
and Quah, 2001; Tefas, Kotropoulos and Pitas,
2001). To provide more effective wellbeing service,
it is considered to understand and recognize the
emotions of humans. They mainly target depression
and bipolar disorder and make use of mobile
technologies and biosensors (Riva et al., 2011).
They rely on biosensor devices for monitoring
physiological parameters and on electronic self-
assessment of mood so that the early warning signs
of relapse into depression or bipolar disorder can be
better recognized (Warmerdam et al., 2012; Faurholt
-Jepsen, 2013; Valenza, Gentili, Lanat`a and
Scilingo, 2013). However, because there are
currently no objective biological markers by non-
invasive techniques used in the diagnosis of
depression, there has been a surge of research
activity that has shed light on both the
neurobiological, physiological, and behavioural
effects of depression (Sung, Marci and Pentland,
2005). In this study, to identify biological measures
related to depression as a preliminary study for a
depression monitoring system based on bio-signals,
we have considered heart rate (HR) and the
dynamics of the PTT time series as tools for a better
diagnostic of depression. Therefore, we examined a
relationship between depressive level and changes of
biological features, i.e., heart rate (HR) and pulse
transit time (PTT) during exposure of six emotional
stimuli (interest, joy, neutral, pain, sadness and
surprise).
2 EXPERIMENTAL METHODS
2.1 Participants
Ninety-six male and female college students (mean
138
Jang, E-H., Kim, A., Kim, S-H. and Yu, H-Y.
Relationship between Depression Level and Bio-signals by Emotional Stimuli.
DOI: 10.5220/0006005301380141
In Proceedings of the 3rd International Conference on Physiological Computing Systems (PhyCS 2016), pages 138-141
ISBN: 978-989-758-197-7
Copyright
c
2016 by SCITEPRESS – Science and Technology Publications, Lda. All rights reserved

20.0 years ± 1.8) participated in this study. None of
them reported any history of medical illness of
taking psychotropic medication and any medication
that would affect the cardiovascular, respiratory, or
central nervous system. A written consent was
obtained at the beginning of the study when they
were introduced to the experimental procedures, and
they were also paid $30 USD to compensate for their
participation.
2.2 Emotional Stimuli
To successfully provoke target emotions, we have
used audio-visual clips as emotional stimuli. Each
emotional clip which was excerpted from a variety
of movies and pictures from PC etc. lasted 1- to 3-
minute long. They were counter-balanced to
minimize the order effect. Table 1 is the example of
the emotional stimuli to induce six emotions. The
emotional stimuli had 81.8% effectiveness on
average by the other experiment for collection of
emotional stimuli. The effectiveness means the
intensity of the induced emotion by each stimulus.
Table 1: Examples of emotional stimuli.
Emotion Context of Stimuli
Interest
Joy
Neutral
Pain
Sadness
Surprise
2.3 Experimental Procedures for the
Measures of Bio-Signals
Prior to measures of bio-signals, they rated their
depressive level on a self-rating depression scale
(SDS) by Zung (1965). Then, bio-signals were
recorded using MP150 (Biopac, Inc., USA) during
baseline and six emotional states (interest, joy,
neutral, pain, sadness and surprise). ECG was
recorded through Ag/AgCl surface electrodes from
the bilateral wrist and the left ankle as a reference.
PPG were detected at the volar surface of the distal
phalanx of the thumb of non-dominant hand.
For the data analysis, we chose the most
emotional 30-sec section from six emotional states.
HR and PTT were extracted from the signals. HR in
beats per minute was analysed by an AcqKnowledge
(version 3.7.1) program that detects R-waves in the
ECG and calculates consecutive R–R intervals. PTT
in ms was determined as the time between the R-
wave in the ECG and the systolic peak in the pulse
signal.
To analyse the biological data, we chose the
most stable 30-seconds section from the baseline and
the most emotional 30-seconds section from each
emotional states. The emotional states were
determined based on the results of the participant’s
self-reporting, in which an emotion was most
strongly expressed during the presentation of a
stimulus. Pearson’s correlation examined the
relation between depressive level and changes of
biological features induced by emotional stimuli.
3 RESULTS
3.1 Validity of Emotion Induction
The results of appropriateness and effectiveness by
the participants’ ratings mean their psychological
responses to emotional stimuli. The emotional
stimuli had 92.0% effectiveness on average. The
effectiveness of each emotional stimulus is as
follows: interest 88.0%, joy 81.6%, neutral 94.8%,
pain 95.9%, sadness 94.8% and surprise 97.0%).
3.2 Relationship between Depressive
Level and Biological Features
Pearson’s correlation coefficient (Pearson's r) as a
measure of the linear correlation between two
variables was used to examine the relation between
depressive level and biological features during
emotional states (Table 1). The results showed that
relation of depressive level and HR is significantly
positive in emotional states (Figure 1). This means
that depressive level is higher, HR increase.
Relationship between Depression Level and Bio-signals by Emotional Stimuli
139
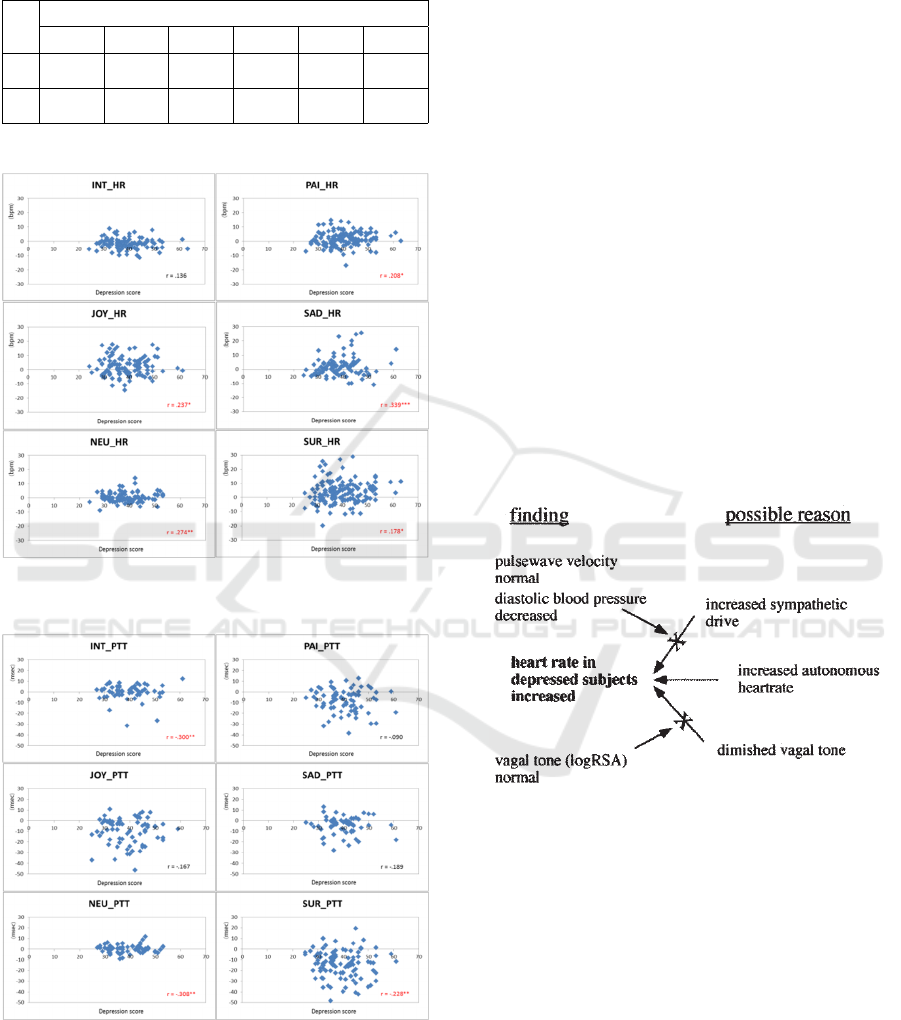
Table 2: The results of Pearson’s r: correlation between
depressive level and biological features during baseline
and emotional states.
Emotional States
INT JOY NEU PAI SAD SUR
HR
.136 .237* .274* .208* .339*** .178*
PTT -.300** -.167 -.308*** -.090 -.189 -.228**
*. p <.05, ** p < .01, *** p < .001
Figure 1: The relation between depressive level and heart
rate (HR) during six emotional states.
Figure 2: The relation between depressive level and pulse
wave transit time (PTT) during six emotional states.
In addition to, there was a negative correlation
between depressive level and PTT, i.e., depressive
level is higher, PTT is lower (Figure 2). In particular,
the correlation results of PPT were significant in
three emotional states, interest, neutral, and surprise.
4 CONCLUSIONS
We have attempted to investigate the relationship
between depressive level and changes of biological
features induced by six emotional stimuli. The
results showed that relation of depressive level and
HR, SCL are positive in all emotional states except
for interest and there was a negative correlation
between depressive level and PTT in three emotional
states. This means that depressive level is higher,
HR increases and depressive level is higher, PTT is
lower. In clinical study, increased heart rate was
reported in the depressed in spite of unchanged
autonomic balance (Moser et al., 1998). Also, they
have discussed the possibility that the increased
heart rate seen in the absence of vagal tone changes
may not be due to altered vagal or sympathetic tone
and other factors, including altered autonomous
heart rate, may be responsible for the higher heart
rate in the depressed group (Figure 3).
Figure 3: Possible physiological factors determining heart
rate (right) and findings of Moser et al. (1998) (left)
indicating, that increased autonomous heart rate is most
likely the reason for the significantly heart rate in
depressed subjects.
Pulse wave transit time (PTT) measures the time
it takes for a pulse pressure wave to travel from the
aortic valve to the periphery (Khandelwal, Sahni,
Kumar and Kumar, 2014). PTT is inversely
proportional to blood pressure, and the falls in blood
pressure which occur with inspiration correspond to
rises in PTT. Therefore, shortened PTT means rises
in blood pressure and quantitative measure of
inspiratory effort.
Although we haven’t clearly examined that the
relationship between depressive level and biological
PhyCS 2016 - 3rd International Conference on Physiological Computing Systems
140

feature (in particular, PTT) is linear under all
emotional states (Table 1), we will perform the
additional work to improve correlation between
them. Spearman or Kendall correlation coefficient, a
nonparametric measure of rank correlation, may be
more suitable.
Nevertheless, we could identify that HR and PTT
are meaningful biological features related to
depression using non-invasive biosensors. This
result will contribute to the use of integrative
approaches capable of assessing multiple biological
variables in developing the depression monitoring
system.
ACKNOWLEDGEMENTS
This work was supported by Institute for
Information & communications Technology
Promotion (IITP) grant funded by the Korea
government (MSIP) (No. B0132-15-1003).
REFERENCES
Drummond, P. D., Quah, S. H., 2001. The effect of
expressing anger on cardiovascular reactivity and
facial blood flow in Chinese and Caucasians,
Psychophysiology, vol. 38, pp. 190-196.
Tefas, A., Kotropoulos, C., Pitas, I., 2001. Using support
vector machines to enhance the performance of elastic
graph matching for frontal face authentication. IEEE
Transactions on Pattern Analysis and Machine
Intelligence, vol. 23, pp. 735-746.
Riva, G., Banos, R., Botella, C., Gaggioli, A., Wiederhold,
B. K. 2011. Personal health systems for mental health:
the European projects. Studies in Health Technology
and Informatics, vol. 163, pp. 496–502.
Warmerdam, L., Riper, H., Klein, M., van den Ven, P.,
Rocha, A., Ricardo Henriques, M., Tousset, E., Silva,
H., Andersson, G., Cuijpers, P., 2012. Innovative ICT
solutions to improve treatment outcomes for
depression: the ICT4Depression project. Studies in
Health Technology and Informatics, vol. 181, pp. 339–
343.
Faurholt-Jepsen, M., Vinberg, M., Christensen, E. M.,
Frost, M., Bardram, J., Kessing, L. V. 2013. Daily
electronic self-monitoring of subjective and objective
symptoms in bipolar disorder-the MONARCA trial
protocol (MONitoring, treAtment and pRediCtion of
bipolAr disorder episodes): a randomised controlled
single-blind trial. BMJ Open, vol. 3, e003353.
Valenza, G., Gentili, C., Lanat`a, A., Scilingo, E. P., 2013.
Mood recognition in bipolar patients through the
PSYCHE platform: preliminary evaluations and
perspectives. Artificial Intelligence in Medicine, vol.
57, pp. 49–58.
Sung, M., Marci, C. D., Pentland, A., 2005. Objective
physiological and behavioral measures for identifying
and tracking depression state in clinically depressed
patients. MIT Technical Report, vol. 595, pp. 1-20.
Zung, W. W., 1965. A self-rating depression scale.
Archives of general psychiatry, vol. 12, pp. 63-70.
Moser, M., Lehofer, M., Hoehn-Saric, R., McLeod, D. R.,
Hildebrandt, G., Steinbrenner, B., Voica, M.,
Liebmann, P., Zapotoczky, H. G., 1998. Increased
heart rate in depressed subjects in spite of unchanged
autonomic balance?. Journal of Affective Disorders,
vol. 48, pp. 115-124.
Khandelwal, S., Sahni, S., Kumar, S., Kumar, A., 2014.
Pressure Sensor Based Estimation of Pulse Transit
Time. International Journal of Information &
Computation Technology, vol. 4, pp. 1321-1328.
Relationship between Depression Level and Bio-signals by Emotional Stimuli
141
