
Physiology-based Recognition of Facial Micro-expressions using EEG
and Identification of the Relevant Sensors by Emotion
Mohamed S. Benlamine
1
, Maher Chaouachi
1
, Claude Frasson
1
and Aude Dufresne
2
1
Computer Science and Operations Research, University of Montreal, Montreal, Qc, Canada
2
Communication Department, University of Montreal, Montreal, Qc, Canada
Keywords: Emotions Recognition, Physiological Signal EEG, Facial Expressions, Models Construction.
Abstract: In this paper, we present a novel work about predicting the facial expressions from physiological signals of
the brain. The main contributions of this paper are twofold. a) Investigation of the predictability of facial
micro-expressions from EEG. b) Identification of the relevant features to the prediction. To reach our
objectives, an experiment was conducted and we have proceeded in three steps: i) We recorded facial
expressions and the corresponding EEG signals of participant while he/she is looking at pictures stimuli
from the IAPS (International Affective Picture System). ii) We fed machine learning algorithms with time-
domain and frequency-domain features of one second EEG signals with also the corresponding facial
expression data as ground truth in the training phase. iii) Using the trained classifiers, we predict facial
emotional reactions without the need to a camera. Our method leads us to very promising results since we
have reached high accuracy. It also provides an additional important result by locating which electrodes can
be used to characterize specific emotion. This system will be particularly useful to evaluate emotional
reactions in virtual reality environments where the user is wearing VR headset that hides the face and makes
the traditional webcam facial expression detectors obsolete.
1 INTRODUCTION
1.1 Context and Motivation
Affective Computing (Picard, 1997) is the general
frame-work that considers emotions in human
computer interaction. In particular, the overall
objective is to make computers able to perceive, feel
and express emotions. However an important goal
remains to detect human emotions. Several studies
have been successfully conducted to detect emotions
using models that track facial expressions with
camera or webcam with, for instance, CERT
(Littlewort et al., 2011), or FaceReader (Lewinski,
den Uyl and Butler, 2014)…etc. The obtained results
in these studies showed a high accuracy that has
never been reached with other approaches using
physiological data.
The joint efforts of researchers in machine
learning, affective computing, physiological compu-
ting (Fairclough, 2010) and neuroscience are produ-
cing innovative methods for emotional and affective
states recognition by analysing data collected with
subjective methods (self-report, expert annotation)
or objective methods (log files, Kinect, camera, eye-
tracking and electrophysiology-cal sensors: EDA,
HR, EMG, EEG, Respiration rate,…) .
Thanks also to breakthrough advancements in
computer vision, facial expressions detection
technology has reached commercial-level maturity
and has become more common, e.g. with Kinect 2 in
Xbox, software like Facereader, iMotions FACET,
and NVISO. However, so far, all the focus has been
on external assessment methods and to the best of
our knowledge, no attempt has ever been made at
detecting facial micro-expressions from EEG signal.
A micro-expression (Ekman, 2007) is a brief
spontaneous facial expression, unconscious (invo-
luntary) and hard to hide as it lasts between 1/24 and
1/15 of a second. Because of their short duration,
micro-expressions are identifiable only by trained
peoples or in videos where the person's face is
recorded. Software like FACET and FaceReader
analyses videos frame by frame to extract the micro-
expressions.
Micro-expressions are important because they
give the spontaneous emotions of the users, which
can be detected using facial expression software.
However, it is not always possible to record the
person’s face; for example with low luminosity or
130
Benlamine, M., Chaouachi, M., Frasson, C. and Dufresne, A.
Physiology-based Recognition of Facial Micro-expressions using EEG and Identification of the Relevant Sensors by Emotion.
DOI: 10.5220/0006002701300137
In Proceedings of the 3rd International Conference on Physiological Computing Systems (PhyCS 2016), pages 130-137
ISBN: 978-989-758-197-7
Copyright
c
2016 by SCITEPRESS – Science and Technology Publications, Lda. All rights reserved
when the person is moving his face or when he is
using VR headset to interact with an immersive
virtual reality environment. In such situations,
physiological measures like EEG represent a
promising alternative that could potentially solve
these problems. Moreover EEG devices are being
increasingly used as they present a practical low cost
solution and help building interesting accurate
models to track and assess users’ states. EEG
features can improve recognition of affect and facial
expressions.
Recent studies in the field of neuroscience have
found a relation between neural activations and
emotions using the technique of Functional
Magnetic Resonance Imaging, or fMRI. For
example, (Kassam, Markey, Cherkassky, Loewen-
stein and Just, 2013) show, through an experiment
with 10 participants using fMRI, that there are
consistent patterns of neural activation for all
emotion categories within and between participants.
In the meanwhile, several works has shown that
emotional states can be recognized from EEG signal
with reasonable accuracy (AlZoubi, Calvo and
Stevens, 2009; Chaouachi, Chalfoun, Jraidi and
Frasson, 2010; Chaouachi and Frasson, 2012;
Chaouachi, Jraidi, and Frasson, 2015; Heraz and
Frasson, 2007; Jraidi, Chaouachi and Frasson, 2013;
Liu, Sourina and Nguyen, 2011; Lu, Zheng, Li and
Lu, 2015). So, it seems sensible then to consider
cerebral activity as input for detecting facial
expressions rather than user’s face images or videos.
All this leads us to believe that a correlation between
EEG features and facial micro-expressions should be
investigated.
1.2 Objectives
Knowing now the importance of micro-expressions
for emotion detection, we aim to build a predictive
model of these emotional micro-expressions from
EEG signals. With such a model, it will be possible
to predict spontaneous facial expressions having as
input cerebral activity signal using Emotiv Headset.
More precisely, we aim to answer two questions:
(1) How well can we predict facial expressions from
the brain signals of participants? (2) Which EEG
features are important for the prediction?
To reach these objectives, we will proceed
according to the following steps: 1) measuring
emotional reactions of a user confronted to specific
emotional pictures using FACET system, 2)
measuring the corresponding EEG signals and train
machine learning models that correlates the micro-
expressions with the EEG signals, and 3) predict the
emotion only from the model and check the
accuracy of the model.
The organization of this paper is as follows:
section 2 presents the design of our experimental
approach and methodology for the EEG-based facial
expressions recognition. We show how we can
evaluate emotions using a well-known set of
emotional pictures. We detail the material used for
the experimentation and the different measures
obtained. Results and discussions are presented in
section 3. We finally show how our model can
predict the micro-expressions from EEG signals. We
conclude this study with a presentation of the scope
of use of this model as well as our future work.
2 METHODS
2.1 Participants
Twenty participants (7 women, 13 men) were
recruited for our study. Their ages ranged from 21 to
35 years and all of them came from a North
American University. All participants were right
handed and comparable in age, sex and education.
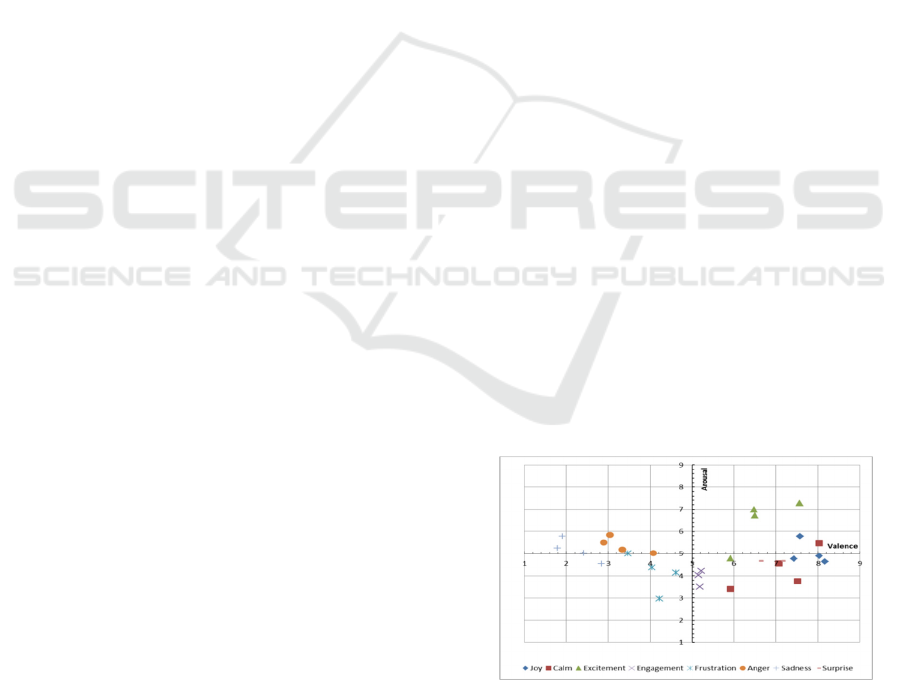
2.2 IAPS Pictures Selection
We selected 30 pictures from IAPS (International
Affective Picture System) (Lang, Bradley and
Cuthbert, 2008) with regard to their affective ratings
(valence, arousal) after consulting the IAPS
documentation. The selected pictures are well
distributed throughout the space (Figure 1). We
grouped those pictures in 8 emotion categories: Joy,
Calm, Excitement, Engagement, Frustration, Anger,
Sadness, and Surprise.
Figure 1: IAPS pictures’ affective ratings distribution and
their categories of emotion.
2.3 Experimental Procedure
The participants were received and introduced to our
Physiology-based Recognition of Facial Micro-expressions using EEG and Identification of the Relevant Sensors by Emotion
131
laboratory. A consent form was given to the
participant to read and sign it in order to register his
agreement about doing the experiment. They were
seated in front of a computer and a webcam. The
participant’s chair was adjusted to maintain good
view of their faces to the webcam.
The experiment design was synchronized by
iMotions Attention Tool which is a software plat-
form that permit multi-sensors study (eye tracking,
facial expressions detection, EEG, GSR …) with
automatic synchronization. We have recorded data
of facial expressions using FACET module and EEG
using Emotiv Epoch headset. IAPS Pictures with the
same emotion category were displayed 6 seconds
one by one, separated by a noise screen of 5 seconds
to accomplish a relaxation phase before the
projection of the next picture. After that, a form
appears asking the user to choose one from the eight
emotion categories that best represent his global
feeling about the previewed pictures. The same
procedure was repeated for each of the eight
emotion categories. The goal of this form is to have
the user’s subjective confirmation of the emotion
he/she supposed to feel seeing the pictures. The
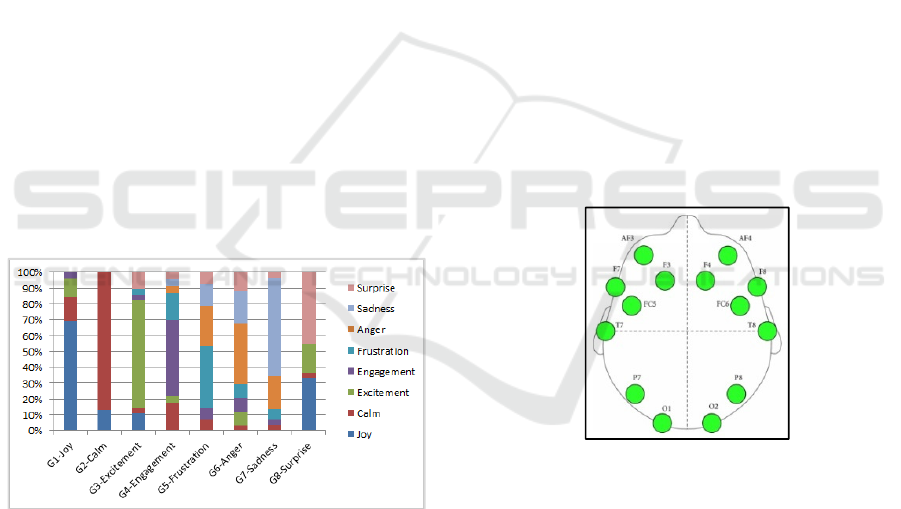
chart below (Figure 2) shows the percent of the self-
reported emotion categories by the IAPS pictures
groups. We configured FACET to analyse frame by
frame the videos of the user’s face to extract his/her
micro-expressions.
Figure 2: Self-reported emotions by pictures groups.
2.4 Measures and Materials
In this study, we have used the following tools.
2.4.1 iMotions FACET Module
The FACET module detects and tracks facial
expressions of primary emotions using real-time
frame-by-frame analysis of the emotional responses
of users via a webcam. A commercial webcam is
used for the user face recording (Webcam Logitech
Pro C920). The captured image is 1920 x 1080
pixels with 24-bit RGB colours, acquired at 6
frames/sec. The FACET module is the commercial
version of CERT (Computer Expression Recognition
Toolbox) (Littlewort et al., 2011) which is a robust
facial micro-expressions recognition software with
an accuracy that reaches 94% (Emotient, 2015). The
resulted data file contains two columns (Evidence
and Intensity) for-each of the following categories:
Joy, Anger, Surprise, Fear, Contempt, Disgust,
Sadness, Neutral, Positive Valence, and Negative
Valence.
2.4.2 Emotiv EPOCH EEG
Physiological data were recorded during the session
using the Emotiv EEG headset. The headset contains
14 electrodes that must be moist with a saline
solution (Contact lens cleaning solution). The
electrodes are spatially organized with respect to the
International 10–20 system. They are located at
AF3, F7, F3, FC5, T7, P7, O1, O2, P8, T8, FC6, F4,
F8, and AF4 (see Figure 3) with two other reference
nodes (that would be placed behind the ears). The
generated data are in µVolt with a sampling rate of
128 Samples/sec. The signal’s frequencies are
between 0.2 and 60Hz.
Figure 3: Data channels placement of the Emotiv Headset.
3 DATA ANALYSIS
3.1 Facial Expressions Data
Taking the webcam stream as input, the FACET
system classifies each frame and provides two
values for each emotion category, namely: Evidence
and Intensity. The Intensity number is a value
between 0 and 1, which denotes the estimation by
expert human coders of the intensity of an
expression. While the Evidence number is a value
between -3 and 3 that represents the presence of an
expression. For an easier interpretation, the
PhyCS 2016 - 3rd International Conference on Physiological Computing Systems
132
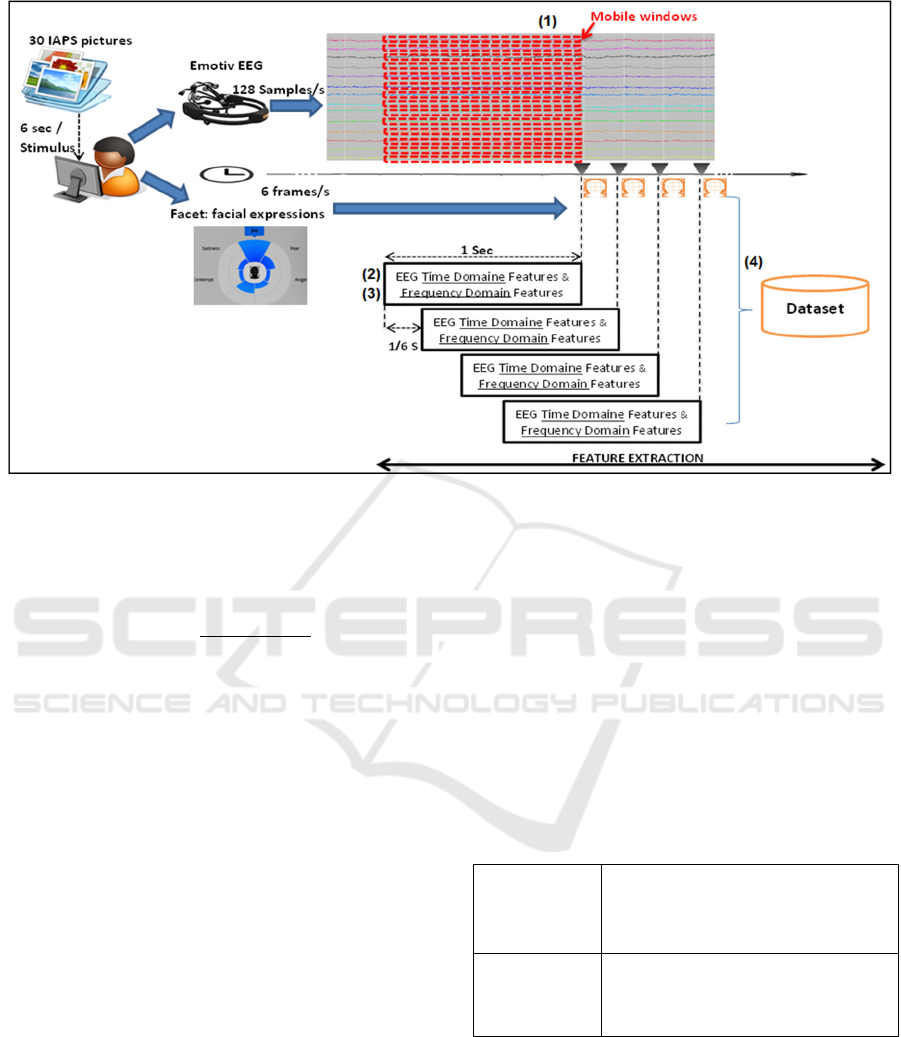
Figure 4: Pipeline of dataset construction for EEG-based Facial Expressions recognition.
Evidence number has been transformed into emotion
probability between 0 and 1, using this formula (as
in FACET guide) (Facet, 2013):
(1)
We computed the probability of each emotion in
our dataset. These probabilities will be considered as
ground truth in the models training phase.
3.2 Dataset Creation
Building the dataset is an important process that has
a big impact in the robustness and the accuracy of
the resulting machine learning models.
The figure above (Figure 4) illustrates the entire
pipeline that we have designed for the construction
of our dataset for EEG-based Facial Expressions
recognition. We developed a java program that uses
14 first-in first-out queues of size 128 of reals as
mobile windows of 1 second EEG data from each
electrode (each window contains 128 samples). (1)
For each FACET frame time (every 1/6 sec) the
program reads the content of each window and (2)
performs statistical analysis to extract time-domain
features and (3) spectral analysis to extract
frequency-domain features. (4) The program records
in a separate CSV file the FACET frame Time, the
computed Time-domain and Frequency-domain
features of each electrode (Table 1) and the
probability value of each emotion category.
The frequency-domain features are computed by
applying FFT on the 128 samples contained in each
window for each FACET Frame Time. By using the
Fast Fourier transform (FFT), we calculated the
magnitudes (in µV²) in frequency domain for the
corresponding frequency bands (delta [1–4 Hz[,
theta [4–8 Hz[, alpha [8–12 Hz[, beta [12–25 Hz[,
and gamma [25–40 Hz[ ) with the application of
hamming window to smooth the signal. The FACET
frame rate is 6 frames per second, so each window
receives, every 1/6 sec, 22 new EEG values
(128/6=21.33 ~ 22).
Table 1: Computed features from EEG Signals.
Frequency-
domain EEG
Features (5
Features)
delta [1–4 Hz[, theta [4–8 Hz[, alpha
[8–12 Hz[, beta [12–25 Hz[, and
gamma [25–40 Hz[
Time-domain
EEG Features
(12 Features)
Mean, Standard Error, Median, Mode,
Standard Deviation, Sample Variance,
Kurtosis, Skewness, Range, Minimum,
Maximum and Sum
The time-domain features (Table 1) are also
computed based on each window that contains 128
samples for each FACET Frame time. Therefore, the
used epoch length in this study is 128 samples. The
twelve features of the EEG signal indicated above
are extracted in the time domain. For each FACET
Frame time, we computed from each window:
Minimum, Maximum, Mean and Sum values. The
Range represents the difference between the
Physiology-based Recognition of Facial Micro-expressions using EEG and Identification of the Relevant Sensors by Emotion
133

Minimum and Maximum. The Mode is the most
commonly occurring value. The Variance measures
the spread between the values in the window and the
Mean. A variance of zero indicates that all the
values are identical. The standard deviation is the
square root of the variance. The standard Error is the
standard deviation divided by the square root of the
window size.
Kurtosis is a descriptor of the shape of a
distribution which represents the distribution's width
of peak. A Gaussian distribution has a kurtosis of
zero; a flatter distribution has a negative kurtosis,
and a more peaked distribution has a positive
kurtosis. Skewness is a measure of the asymmetry of
a distribution relative to its mean; a distribution can
be negatively skewed when the left tail is longer or
positively skewed when the right tail is longer, and a
symmetrical distribution has a skewness of zero.
We have not used a window containing average
values from all electrodes because we assumed that
each emotion has its own activated area in the brain
(Kassam et al., 2013). The Machine learning
algorithms will select features from the suitable
electrodes for the prediction of specific emotion
category values.
The total number of computed features from all
the electrodes is 238 (17 features per electrode: 5
frequency-domain features + 12 time-domain
features). The collected dataset contains 21553 data
points (1078 data point per participant; 36 data point
per stimulus). We have created 10 CSV files where
we put together all the extracted EEG Features and
one emotion category extracted from FACET data.
Each file was entered as an input to the WEKA ma-
chine learning toolkit (Hall et al., 2009) for
generating EEG-based regression model to predict
the values of one emotion category.
4 RESULTS AND DISCUSSIONS
For every one of the 10 emotion categories, a
regression model was generated. Three machine
learning algorithms were used to predict the numeric
values of each emotion category; namely IBk (K-
nearest neighbours classifier), Random Forest
(classifier constructing a forest of random trees) and
RepTree (Fast decision tree learner).We used 10 fold
validation in our test phase. For the prediction of the
emotion classes’ values, we have chosen dependent
criteria: Correlation Coefficient (CC), Mean
Absolute Error (MAE) and Root Mean Squared
Error (RMSE) to evaluate the goodness of different
machine learning algorithms.
Table 2: Comparison between machine learning methods.
Emotion
IBk Random Forest RepTree
CC MAE RMSE CC MAE RMSE CC MAE RMSE
Joy
0.85 0.02 0.05 0.91 0.02 0.05 0.72 0.03 0.07
Anger
0.88 0.05 0.09
0.92
0.05 0.08 0.83 0.07 0.10
Surprise
0.85 0.02 0.04 0.90 0.02 0.03 0.76 0.02 0.05
Fear
0.89 0.04 0.08
0.92
0.05 0.07 0.78 0.07 0.10
Neutral
0.87 0.05 0.10 0.91 0.06 0.09 0.74 0.08 0.14
Contempt
0.79 0.03 0.07 0.85 0.04 0.06 0.63 0.05 0.08
Disgust
0.88 0.03 0.06
0.92
0.03 0.05 0.63 0.05 0.08
Sadness
0.89 0.03 0.06
0.92
0.03 0.06 0.83 0.04 0.08
Positive
0.85 0.05 0.11 0.91 0.06 0.09 0.76 0.08 0.13
Negative
0.86 0.10 0.16 0.90 0.11 0.14 0.80 0.13 0.18
Compared to IBk (k=1 neighbour) and RepTree
methods, Random Forest obtains higher correlation
coefficient and lower error rates such as MAE and
RMSE for all emotion categories, as illustrated in
Table 2.
In order to find the optimal EEG features for
each emotion category, we used a feature selection
method called ReliefF over Random forest algorithm
to choose an optimal feature set of size 24 (10% of
the initial features set). The experimental results
performed on the different emotion categories are
presented in Table 3.
Table 3: Random forest models results with reliefF feature
selection method.
Emotions
R.F. (selection of 24 Attributes)
CC MAE RMSE
Joy
0.8336 0.0266 0.0585
Anger
0.8888 0.0612 0.0872
Surprise
0.8272 0.0219 0.0428
Fear
0.8949 0.0516 0.0744
Neutral
0.8854 0.0648 0.0971
Contempt
0.8266 0.0374 0.0607
Disgust
0.9196 0.0307 0.0483
Sadness
0.8854 0.0401 0.0640
Positive
0.8647 0.0655 0.1012
Negative
0.8878 0.1093 0.1439
In the experiments, a 10-fold cross validation
method was used for evaluation. It is notable that
Random Forest method performs well even with 24
features. The 24 selected EEG features by emotion
category are presented in Table 4.
PhyCS 2016 - 3rd International Conference on Physiological Computing Systems
134

Table 4: The selected 24 attributes by ReliefF over
Random Forest for each emotion category.
Emotion
The selected 24 attributes (10% of
features set)
Joy
P8_Mode, T8_Mode, P8_Range,
T8_Minimum, T8_Range, P8_Maximum,
T8_Maximum, T8_Standard_Deviation,
T8_Standard_Error, P8_Minimum,
T8_Median, P8_Median, T8_Sum,
T8_Mean, FC6_Standard_Error,
FC6_Standard_Deviation, FC6_Minimum,
P8_Standard_Error,
P8_Standard_Deviation, T8_Delta,
P8_Mean, P8_Sum, T8_Beta, P7_Range
Anger
P7_Range, P8_Range, P8_Maximum,
P7_Standard_Deviation,
P7_Standard_Error, P8_Mode,
P8_Minimum, P7_Maximum, AF4_Range,
P8_Median, AF3_Mode, F3_Range,
T7_Skewness, P7_Gamma,
P8_Standard_Error,
P8_Standard_Deviation, P7_Median,
P7_Beta, P7_Alpha, P8_Sum, P8_Mean,
AF3_Maximum, P7_Mode, P7_Delta
Surprise
P7_Mode, P7_Range, P7_Maximum,
P8_Skewness, P7_Minimum,
P7_Standard_Error,
P7_Standard_Deviation, P7_Kurtosis,
P7_Median, P7_Sum, P7_Mean,
P8_Kurtosis, P7_Skewness,
T7_Sample_Variance, T7_Mode,
P8_Minimum, T7_Standard_Deviation,
T7_Standard_Error, T7_Kurtosis,
P7_Sample_Variance, O1_Skewness,
O2_Kurtosis, F8_Kurtosis, O1_Kurtosis
Fear
FC6_Standard_Error,
FC6_Standard_Deviation, FC6_Minimum,
P8_Range, P8_Minimum, FC5_Minimum,
FC6_Range, P8_Maximum, P7_Range,
T8_Minimum, P8_Median,
FC5_Standard_Error,
FC5_Standard_Deviation, P8_Mean,
P8_Sum, P8_Standard_Deviation,
P8_Standard_Error, FC6_Delta, T7_Delta,
FC6_Sample_Variance, FC6_Mode,
P8_Mode, T7_Skewness, P7_Skewness
Neutral
P8_Mode, P8_Range, P8_Maximum,
T8_Mode, P8_Minimum, T8_Minimum,
T8_Range, T8_Maximum, P8_Median,
P8_Mean, P8_Sum, P8_Standard_Error,
P8_Standard_Deviation, P7_Range,
FC5_Minimum, T8_Standard_Deviation,
T8_Standard_Error, FC6_Mode,
FC6_Standard_Deviation,
FC6_Standard_Error, FC6_Range,
FC6_Minimum, P8_Theta,
FC5_Standard_Error
Contempt
T8_Mode, P8_Mode, T8_Minimum,
FC6_Mode, F7_Minimum,
FC6_Standard_Error,
FC6_Standard_Deviation, FC6_Minimum,
FC6_Range, FC5_Minimum, T7_Delta,
FC5_Mode, T8_Maximum, F8_Mode,
T8_Range, F7_Range, F7_Mode,
FC6_Delta, F8_Range,
FC5_Standard_Error,
FC5_Standard_Deviation, F7_Maximum,
T7_Beta, F8_Minimum
Disgust
P8_Maximum, P8_Mode, P8_Range,
P7_Range, P8_Minimum, P8_Median,
P8_Mean, P8_Sum,
P8_Standard_Deviation,
P8_Standard_Error, O1_Minimum,
AF4_Range, FC5_Minimum,
AF4_Minimum, F7_Minimum,
P7_Standard_Deviation,
P7_Standard_Error, P7_Maximum,
F8_Maximum, FC5_Standard_Error,
FC5_Standard_Deviation, T7_Skewness,
AF4_Standard_Deviation,
AF4_Standard_Error
Sadness
P8_Range, P8_Maximum, P8_Mode,
P8_Minimum, P7_Range,
P8_Standard_Deviation,
P8_Standard_Error, P8_Median, P8_Beta,
P8_Theta, P8_Sum, P8_Mean, P8_Alpha,
P7_Kurtosis, P8_Gamma, P7_Maximum,
AF3_Range, P7_Standard_Deviation,
P7_Standard_Error, P8_Delta,
AF3_Minimum, AF3_Maximum,
P8_Sample_Variance, P8_Skewness
Positive
P8_Mode, T8_Mode, T8_Minimum,
T8_Range, P8_Range, P8_Maximum,
T8_Maximum, P8_Minimum,
T8_Standard_Deviation,
T8_Standard_Error,
FC6_Standard_Deviation,
FC6_Standard_Error, P7_Range,
T8_Median, FC6_Range, T8_Sum,
T8_Mean, FC6_Minimum, T8_Beta,
FC6_Mode, P8_Median,
P8_Standard_Error,
P8_Standard_Deviation, T8_Delta
Negative
P8_Range, P8_Maximum, P8_Minimum,
P7_Range, F7_Minimum, P8_Median,
P8_Sum, P8_Mean, P8_Standard_Error,
P8_Standard_Deviation, F3_Range,
T8_Minimum, T8_Range,
F7_Standard_Error,
F7_Standard_Deviation, F7_Range,
P7_Gamma, AF4_Range, FC5_Mode,
P7_Standard_Error,
P7_Standard_Deviation, FC5_Minimum,
P7_Maximum, FC6_Standard_Deviation
Physiology-based Recognition of Facial Micro-expressions using EEG and Identification of the Relevant Sensors by Emotion
135

From the results in Table 4, we have identified
the most suitable EEG electrodes by emotion
category as illustrated in Table 5.
Table 5: Random Forest selected EEG electrodes by
emotion category.
Emotion Selected Electrodes
Joy
P8, T8, FC6
Anger
P7, P8, AF4, AF3, F3, T7
Surprise
P7, P8, T7, O1, O2, F8
Fear
FC6, P8, FC5, FC6, P7, T8, T7
Neutral
P8, T8, P7, FC5, FC6
Contempt
T8, P8, FC6, FC5, T7, F8, F7
Disgust
P8, P7, O1, AF4, FC5, F7, F8, T7
Sadness
P8, P7, AF3
Positive
P8, T8, FC6, P7
Negative
P8, P7, F7, F3, T8, AF4, FC5, FC6
These results are very important, since this is the
first time we identify the most reliable sensors for
each emotion category. In previous study, Liu and
colleagues (Liu et al., 2011) implemented a real-time
EEG-based emotion recognition algorithm based on
fractal dimension calculation of six different
emotions using only AF3, F4 and FC6 electrodes.
Our proposed model has better accuracy, more
adaptability to all users and several advantages
besides. In fact, the identification of the most active
electrodes detected by our model gives us a deep
understanding of how the brain reacted with regard
to emotional elicitation. Furthermore, we note that
the P8 is a common electrode for all emotion
categories. The P8 sensor position is localized on the
parietal lobe of the right cerebral hemisphere of the
brain. This result is consistent with the study of
Sarkheil and his colleagues (Sarkheil, Goebel,
Schneider and Mathiak, 2013), and confirms the role
of the right IPL (Inferior Parietal Lobule) in
decoding dynamic facial expressions. So, the right
IPL is not only involved in decoding the others’
facial expressions but also in generating our own
facial expressions. The same consistency holds for
the F4 sensor that was completely excluded by our
model and F3 sensor that was only used to detect
Anger and Negative emotions. In fact, the two
sensors are located in the frontal lobe which is,
according to the study of Lough et al. (Lough et al.,
2006), related to the modification of emotions to
generally fit socially acceptable norms.
With these results, our EEG-based facial
expressions prediction approach provides a simple
and reliable way to capture the emotional reactions
of the user that can be used in learning, games,
neurofeedback, and VR environments.
5 CONCLUSION
This work shows that user’s facial expressions are
predictable from EEG physiological signals. The
emotion recognition problem is considered from
regression perspective taking as ground truth the
detected facial expressions’ data from webcam-
based facial expressions recognition software
(FACET). The experiment results revealed that
facial expressions can be recognizable from specific
EEG sensors by the mean of specific time-domain
and frequency-domain features. Our experimental
design and features construction method has
enhanced the physiological emotions recognition
accuracy reaching performances similar to computer
vision technics. This finding suggests that the used
EEG features were sufficiently implemented for the
prediction of facial expressions from EEG with high
accuracy. This accuracy is compared with FACET
output and not against the self-reported emotional
state of the user which is out of the scope of this
current study and would be an interesting direction
for further work with larger sample size. With the
advances in the technology of EEG and appearance
of new EEG headsets with dry sensors and wireless
transmission of physiological data to mobile
applications (Chi et al., 2012; Samsung, 2015),
emotions assessment with EEG equipment will be
more common in our daily life. Therefore, we are
considering the integration of our models in a virtual
reality environment to test their performances in
real-time conditions and detect the user’s facial
reactions even with VR headset that hides his face.
ACKNOWLEDGEMENTS
The research presented in this paper has been
supported by funding awarded by the Natural
Sciences and Engineering Research Council of
Canada (NSERC) and Beam Me Up Games.
REFERENCES
AlZoubi, Omar, Calvo, Rafael A and Stevens, Ronald H.
(2009). Classification of EEG for affect recognition:
an adaptive approach AI 2009: Advances in Artificial
Intelligence (pp. 52-61): Springer.
PhyCS 2016 - 3rd International Conference on Physiological Computing Systems
136

Chaouachi, Maher, Chalfoun, Pierre, Jraidi, Imène and
Frasson, Claude. (2010). Affect and mental engage-
ment: towards adaptability for intelligent systems.
Paper presented at the Proceedings of the 23rd
International FLAIRS Conference, Daytona Beach,
FL. http://citeseerx.ist.psu.edu/viewdoc/download.
Chaouachi, Maher and Frasson, Claude. (2012). Mental
workload, engagement and emotions: an exploratory
study for intelligent tutoring systems. Paper presented
at the Intelligent Tutoring Systems.
Chaouachi, Maher, Jraidi, Imène and Frasson, Claude.
(2015). MENTOR: A Physiologically Controlled
Tutoring System User Modeling, Adaptation and
Personalization (pp. 56-67): Springer.
Chi, Yu Mike, Wang, Yu-Te, Wang, Yijun, Maier,
Christoph, Jung, Tzyy-Ping and Cauwenberghs, Gert.
(2012). Dry and noncontact EEG sensors for mobile
brain–computer interfaces. Neural Systems and
Rehabilitation Engineering, IEEE Transactions on,
20(2), 228-235.
Ekman, Paul. (2007). Emotions revealed: Recognizing
faces and feelings to improve communication and
emotional life: Macmillan.
Emotient. (2015). Emotient Accuracy Measures and
Methodology. Retrieved from Emotient.com website:
http://www.emotient.com/wp-content/uploads/Emoti
ent-Accuracy-Methods-May-2015.pdf
Facet, iMotions. (2013). Attention Tool FACET Module
Guide Retrieved from imotions.com website:
https://imotions.com/wp-
content/uploads/2013/08/130806_FACET_Guide.pdf
Fairclough, Stephen H. (2010). Physiological computing:
interfacing with the human nervous system Sensing
emotions (pp. 1-20): Springer.
Hall, Mark, Frank, Eibe, Holmes, Geoffrey, Pfahringer,
Bernhard, Reutemann, Peter and Witten, Ian H.
(2009). The WEKA data mining software: an update.
ACM SIGKDD explorations newsletter, 11(1), 10-18.
Heraz, Alicia and Frasson, Claude. (2007). Predicting the
three major dimensions of the learner’s emotions from
brainwaves. World Academy of Science, Engineering
and Technology, 31, 323-329.
Jraidi, Imène, Chaouachi, Maher and Frasson, Claude.
(2013). A dynamic multimodal approach for assessing
learners' interaction experience. Paper presented at
the Proceedings of the 15th ACM on International
conference on multimodal interaction.
Kassam, K. S., Markey, A. R., Cherkassky, V. L.,
Loewenstein, G. and Just, M. A. (2013). Identifying
Emotions on the Basis of Neural Activation. Plos One,
8(6). doi: 10.1371/journal.pone.0066032
Lang, Peter J, Bradley, Margaret M and Cuthbert, Bruce
N. (2008). International affective picture system
(IAPS): Affective ratings of pictures and instruction
manual. Technical report A-8.
Lewinski, Peter, den Uyl, Tim M and Butler, Crystal.
(2014). Automated facial coding: Validation of basic
emotions and FACS AUs in FaceReader. Journal of
Neuroscience, Psychology, and Economics, 7(4), 227.
Littlewort, Gwen, Whitehill, Jacob, Wu, Tingfan, Fasel,
Ian, Frank, Mark, Movellan, Javier and Bartlett,
Marian. (2011).
The computer expression recognition
toolbox (CERT). Paper presented at the Automatic
Face & Gesture Recognition and Workshops (FG
2011), 2011 IEEE International Conference on.
Liu, Yisi, Sourina, Olga and Nguyen, Minh Khoa. (2011).
Real-time EEG-based emotion recognition and its
applications Transactions on computational science
XII (pp. 256-277): Springer.
Lough, Sinclair, Kipps, Christopher M, Treise, Cate,
Watson, Peter, Blair, James R and Hodges, John R.
(2006). Social reasoning, emotion and empathy in
frontotemporal dementia. Neuropsychologia, 44(6),
950-958.
Lu, Yifei, Zheng, Wei-Long, Li, Binbin and Lu, Bao-
Liang. (2015). Combining eye movements and EEG to
enhance emotion recognition. Paper presented at the
International Joint Conference on Artificial
Intelligence (IJCAI).
Picard, Rosalind W. (1997). Affective computing (Vol.
252): MIT press Cambridge.
Samsung. (2015). Samsung prototypes brainwave-reading
wearable stroke detector. Retrieved from Samsung
Tomorrow website: https://news.samsung.com/global/
c-lab-engineers-developing-wearable-health-sensor-
for-stroke-detection
Sarkheil, Pegah, Goebel, Rainer, Schneider, Frank and
Mathiak, Klaus. (2013). Emotion unfolded by motion:
a role for parietal lobe in decoding dynamic facial
expressions. Social cognitive and affective
neuroscience, 8(8), 950-957.
Physiology-based Recognition of Facial Micro-expressions using EEG and Identification of the Relevant Sensors by Emotion
137
