
Modeling and Simulation of an Energy Efficient Skid
Conveyor using ZIZO
Oussama Khlifi
1,2,4
, Christian Siegwart
2
, Olfa Mosbahi
3
, Mohamed Khalgui
3,5
and Georg Frey
1
1
Chair of Automation, Saarland University, Saarbrücken, Germany
2
ZeMA – Zentrum fur Mechatronik und Automatisierungstechnik gemeinnützige GmbH, Saarbrücken, Germany
3
LISI laboratory, INSAT, University of Carthage, Tunis, Tunisia
4
Polytechnic School of Tunisia, University of Carthage, Tunis, Tunisia
5
School of Electro-Mechanical Engineering, Xidian University, Xi'an 710071, China
Keywords: Petri Net, Energy Efficiency, Automotive Transport System, Modeling, Simulation.
Abstract: This paper introduces a method for modeling and simulation of a production system with different energy
modes. We aim to save the energy in an assembly automobile production line platform using sensitive sensors.
A new prototype model is proposed using an extension of Petri nets called GR-TNCES (generalized
reconfigurable timed net condition event systems). We also present a simulation of this model with a proposed
tool ZIZO to show the energy gain compared to standard production line model.
1 INTRODUCTION
As one key pillar of national economics,
manufacturing industry and information technology
create huge economic fortune,
but it also results in
serious environmental problems, such as energy
depletion problem (Wang et al., 2014). Consequently,
industry is forced to consider and initiate energy
efficiency for many types of systems. With about
47% the industry sector has the largest share of
electricity consumption in Germany (BDEW, 2014).
Since the German automotive industry is one of the
biggest industries, improving energy consumption in
this field is an important topic. Therefore, sustainable
economic activity and energy are one of the key
points in the new high-tech strategy of the German
government (BMBF, 2014). In order to improve the
energy efficiency of production systems, modeling
and simulation provides a good basis for such a
prototype system. It is a useful strategy to start with
the control and the energy evaluation in such a
system. Components of production plants can operate
in different modes (on, standby, off mode) that
consume a different amount of energy. Intelligent
switching between these modes can lead to an
optimization of the energy demand. The purpose of
this paper is to optimize the energy consumption of
an automotive transport system prototype. The
authors introduce a system plant model with the aim
to save energy.
State machine based approaches such as
StateCharts (Chen et al., 2014) are best suited for
control dominated systems besides it suffers from
their inability to express data flow. Discrepancy
between a system and its model representation can be
found looking at all the tools that do not allow
expressing structural similarity between a system and
its model. Recently, the use of object-oriented (OO)
modeling (Bastide and
Buchs, 1998) becomes more
and more common. Although OO-formalisms contain
several features to produce detailed models, they are
not intended to be executable. Place/transition Petri
nets (Andrade et al., 2009) have several desirable
properties, such as being intuitive, graphical, and able
to express concurrency and data flow. However, they
are confined to the use in small scale models since a
concept of hierarchy is missing. High-level Petri nets
such as colored Petri nets (Cai et al., 2015) are better
suited, since they have an expressive inscription
language and also some structuring features.
Distributed discrete event system specification is a
modular and hierarchical formalism for modeling and
analysing discrete-event system to be distributed on
networked devices. It can be described by state
transition tables and continuous state systems which
Khlifi, O., Siegwart, C., Mosbahi, O., Khalgui, M. and Frey, G.
Modeling and Simulation of an Energy Efficient Skid Conveyor using ZIZO.
DOI: 10.5220/0006002305510558
In Proceedings of the 13th International Conference on Informatics in Control, Automation and Robotics (ICINCO 2016) - Volume 1, pages 551-558
ISBN: 978-989-758-198-4
Copyright
c
2016 by SCITEPRESS – Science and Technology Publications, Lda. All rights reserved
551

might be represented by differential equations, and
hybrid continuous state. To improve and evaluate the
energy consumption of a modular system, an
expressive formalism is needed to model the system’s
behaviours, time constraints and energy resources. It
is essential that the formalism can supervise the
consumed resources and energy reserves. Recently,
generalized reconfigurable timed net condition
systems (GR-TNCES) (Khlifi et al., 2015) is
introduced by the authors to model and control
adaptive probabilistic systems under memory and
energy constraints. It is a useful and practical
formalism to model distributed discrete event
systems. It is very expressive and it can describe
several constraints. Thanks to this formalism, it is
simple to interconnect condition/event signals to the
system’s components. It is also useful to model and
supervise the energy consumption during run-time
simulation. Moreover, the authors present a new
extension of the tool, baptized ZIZO (Salem et al.,
2015), a GR-TNCES modeling and probabilistic-
simulating software. It could model reconfigurable
probabilistic and distributed discrete events systems
and control their resources consumption at run-time
process. Then, it exports the model which already
built to the probabilistic model checker PRISM
(PRISM 4.3, 2015)
for the formal certification.
Precisely, the authors describe the model of a
distributed control system: An assembly-line
conveyor controlled by a programmable logic
controller PLC using a GR-TNCES. The model
contains information about the energy consumption
of the system parts in different operation modes
(running, standby, off). The system’s energy
consumption is evaluated via the token number
consumed by the system during simulation.
The remainder of this paper is organized as
follows. The next Section describes the preliminaries
on top of modeling formalism and simulation. Section
3 introduces the case study. The new environment
ZIZO, the system’s model, the simulation and the
optimization are introduced in Section 4. A
discussion is provided in Section 5. Finally, Section 6
concludes the paper.
2 BACKGROUND
For the better understanding of modeling formalism
and simulation, basic preliminaries are briefly called
here. We present also the new formalism introduced
in the previous work GR-TNCES (Khlifi et al., 2015)
to model and control adaptive probabilistic discrete
event systems.
2.1 Petri Nets
Petri nets are extensively used to model, analyze, and
control discrete event systems. Different classes of
Petri nets can present different types of systems.
Specifically, place/transition nets can be used to
represent the logical level of a discrete event system
(Li and Zhou, 2009). Deterministic timed event
graphs which represent a subclass of Petri nets are
equivalent to linear systems (Chen et al., 2014). More
general timed deterministic and stochastic Petri nets
can be used for performance evaluation. High-level
nets can offer a compact model for complex systems.
Hybrid nets can represent hybrid systems that involve
both discrete and continuous processes (Li and Zhou,
2009).
2.2 Simulation
Simulation-based approaches ensure that a limited
number of the defined system paths meet the desired
specification. Even though computationally
inexpensive simulation is used in system design, it
does not lead to completeness as it is impossible or
impractical to prove all system trajectories.
Simulation is a semi-automatic testing method since
the user must provide a large number of test cases (Li
and Zhou, 2009).
2.3 Existing Tools
Several tools already exist to model and/or simulate
Petri nets and their extensions. For example, CPN
tools is a software package for editing, simulating and
analyzing colored Petri nets. It features a fast
simulator that efficiently handles both timed and
untimed nets. Full and partial state spaces can be
generated and analyzed (Ratzer et al., 2003). Petri
.NET allows the modeling, simulation and real-time
implementation of static and dynamic Petri nets. Its
results are presented in the form of a graphical token
game animation (Genter et al., 2007). Nevertheless,
neither CPN tools nor Petri.NET can support GR-
TNCES with their condition and event signals. The
TNCES-Editor, developed at Martin Luther
university Halle-Wittenberg, allows the graphical
modeling of all NCES based subtypes (Dubinin et al.,
2006). To support interpretation and reachable state
analysis, the TNCES-Editor offers an optional
labeling of transitions. However, TNCES-Editor does
not feature the simulation of a built model.
ICINCO 2016 - 13th International Conference on Informatics in Control, Automation and Robotics
552

2.4 GR-TNCES Formalism
The formalism GR-TNCES is recently introduced in
(Khlifi et al., 2015). It is used to model and control
memory and energy resources of adaptive
probabilistic systems as well as discrete event
systems. A GR-TNCES is a network of R-TNCES
(Zhang et al., 2013). It is a structure G = ∑ R-TNCES
where R-TNCES = (B, R), such that R is the control
module consisting of a set of reconfiguration
functions {r
1
,…,r
n
} managed under a memory and
energy controllers, and B is the behavior module
which is a union of multi TNCES (Zhang et al., 2013),
represented as follows: B = (P, T, F, QW, CN, EN,
DC, V, Z
0
) where:
(i). P (respectively, T) is a non-empty finite set of
places (respectively, transitions);
(ii). F is a set of flow arcs with F ⊆ (P × T) ∪ (T ×
P);
(iii). QW=(Q,W) where Q: F→[0, 1] is the
probability on the arcs and W: (P × T) ∪ (T ×
P) →{0, 1} maps a weight to a flow arc.
Specifically, W(x, y) > 0 if (x, y) ∈ F, and W(x,
y)=0 otherwise, where x, y ∈ P ∪ T;
(iv). CN (respectively, EN) is a set of condition
(respectively, event) signals with CN ⊆ (P × T)
(respectively, EN ⊆(T × T));
(v). DC: F ⊆ (P × T) → [l, h] is a superset of time
constraints on output arcs;
(vi). V: T→{∨, ∧} maps an event-processing mode
(AND or OR) to each transition;
(vii). Z
0
= (T
0
, D
0
) where T
0
: P → {0, 1} is the initial
marking and D
0
: P → {0} is the initial clock
position.
Let TN = P ×T ×F ×QW ×CN ×EN ×DC ×V be the
set of all feasible net structures that can be performed
by a system. Let
•r (respectively, r•) denotes the
original (respectively, target) R-TNCES before
(respectively, after) the reconfiguration function r is
applied, where TN(
•r), TN(r•) ∈ TN. Each
reconfiguration is controlled by the controller module
R. It is a structure: R = {Condition Cond, Probability
Q, Energy E’, Memory M’, Structure S, State X}. A
reconfiguration function r is a structure r = (Cond, Q,
E
0
’, M
0
’, S, X), where:
(i). Cond: CN → {true, false}: the precondition
Cond of r can be evaluated to true or false and
can be modeled by external condition signals;
(ii). Q: F → [0..1]: TNCES probability which
could be a functional (internal to the TNCES)
or a reconfiguration probability. It is a new
parameter for GR-TNCES;
(iii). E
0
’: P → [0..max]: controls the energy
requirements by the TNCES to the energy
reserves;
(iv). M
0
’: P → [0..max]: controls the memory
requirements by the TNCES to the memory
reserves;
(v). S: TN(•r) → TN(r•): is the structure
modification instruction of the reconfiguration
scenario;
(vi). X: last state (•r) → initial state (r•): is the state
processing function, where last state (•r)
(respectively, initial state (r•)) denotes the last
(respectively, initial) state of •r (respectively,
r•) before (respectively, after) the application
of r.
A state machine specified by an R-TNCES, which is
called Structure_changer, is introduced to describe
the control module. In this state machine, each place
corresponds to a specific TNCES of the GR-TNCES
model. Thus, each transition corresponds to a
reconfiguration function. A place sp gets a token
implies that the TNCES to which sp corresponds, is
selected. If a transition st (∀ st ∈ sp•) fires, then it
removes the token away from sp and brings it into a
place sp’ with sp’ ∈ st•. Firing st implies that a
reconfiguration function is applied. Then, the TNCES
is changed into another one corresponding to sp’. The
Structure_changer is formalized as follows:
Structure_changer = (P, T, F, Q, E’, M’)
where ∀
t ∈ T, |•t| = |t•| =1, and only one TNCES is
performed at any time. Each place of this structure
contains the whole information about the
corresponding TNCES e.g. its energy and memory
requirements (number of states in this TNCES). Thus,
this formalism will be used to model the system and
its resources. The tool is used to simulate the model
and evaluate its energy resources.
3 TEST CASE: SKID CONVEYOR
Skid conveyors are one type of transport systems that
are widely used in the automotive industry.
Transporting a body in the paint shop or transporting
chassis from one workstation to another in the final
assembly are typical use cases. For this purposes, we
use an extended skid conveyor system, which is one
part of the automated commissioning line built up in
Modeling and Simulation of an Energy Efficient Skid Conveyor using ZIZO
553

Figure 1: CAD model of the skid conveyor.
the “Zentrum für Mechatronik und
Automatisierungstechnik” in Saarbrücken, Germany
(ZeMA, 2015). Energy efficiency of this plant model
is one important topic of the researchers.
3.1 Structure
Figure 1 shows a CAD model of the transport system.
It consists of three conveyor parts: Each one is
equipped with one motor. The overall length is
18.14m and each part has the length of 5.45m. Each
motor drives five rollers transporting a skid of 3.90m
with a chassis on it. In order to realize energy efficient
operations, the system is extended by a control unit
and six inductive sensors. The first sensor is placed
2.62m and the second one 4.69m from the start point
of each conveyor part. Using these sensors, it is
possible to detect the skid position on the conveyor.
Inactive components are switched into an energy
efficient state. We differentiate three different cases:
(i).
If a rising edge is detected by the first sensor,
then the skid reaches the conveyor and the
associated motor must be turned on,
(ii).
If there is a rising edge at the second sensor,
then the skid is in the middle of the conveyor
part. The motor is switched off for an
exemplary cycle time of 10 seconds,
(iii).
If a falling edge is detected by the second
sensor, then the skid leaves the conveyor part
and the associated motor must be switched off.
Monitoring the skid position has a further advantage.
Since we have a fixed chassis position on the skid, the
inductive sensors enable us to determine the chassis
position. This information can be used in the
assembly task for example.
3.2 Control System
In order to realize any energy efficient operation of
the system, we have to install a control system to
allow switching on and off all components at the right
time. The central unit of the system forms a
programmable logic controller (PLC). All sensors are
connected to this unit. The PLC communicates via
PROFINET with the drives and a mobile panel. The
Siemens PROFIenergy (PROFIBUS
Nutzerorganisation e.V., 2010) profile is based on
PROFINET and allows active standby modes for the
non-used loads during non-productive periods. The
drive system is a modular component that ranges
from the control unit and the power modules to the
motors. The user handling and control is realized with
the mobile panel. It is easy to command the system
via touchscreen and buttons. Figure 2 shows the
layout within the control components. It represents
the control system and the connection among its
modules.
Figure 2: Control system of the skid conveyor.
4 ZIZO TOOL: MODELING AND
SIMULATION
We present in this section the tool ZIZO and its
usefulness for the modeling and simulation
distributed control systems. It allows modular
ICINCO 2016 - 13th International Conference on Informatics in Control, Automation and Robotics
554
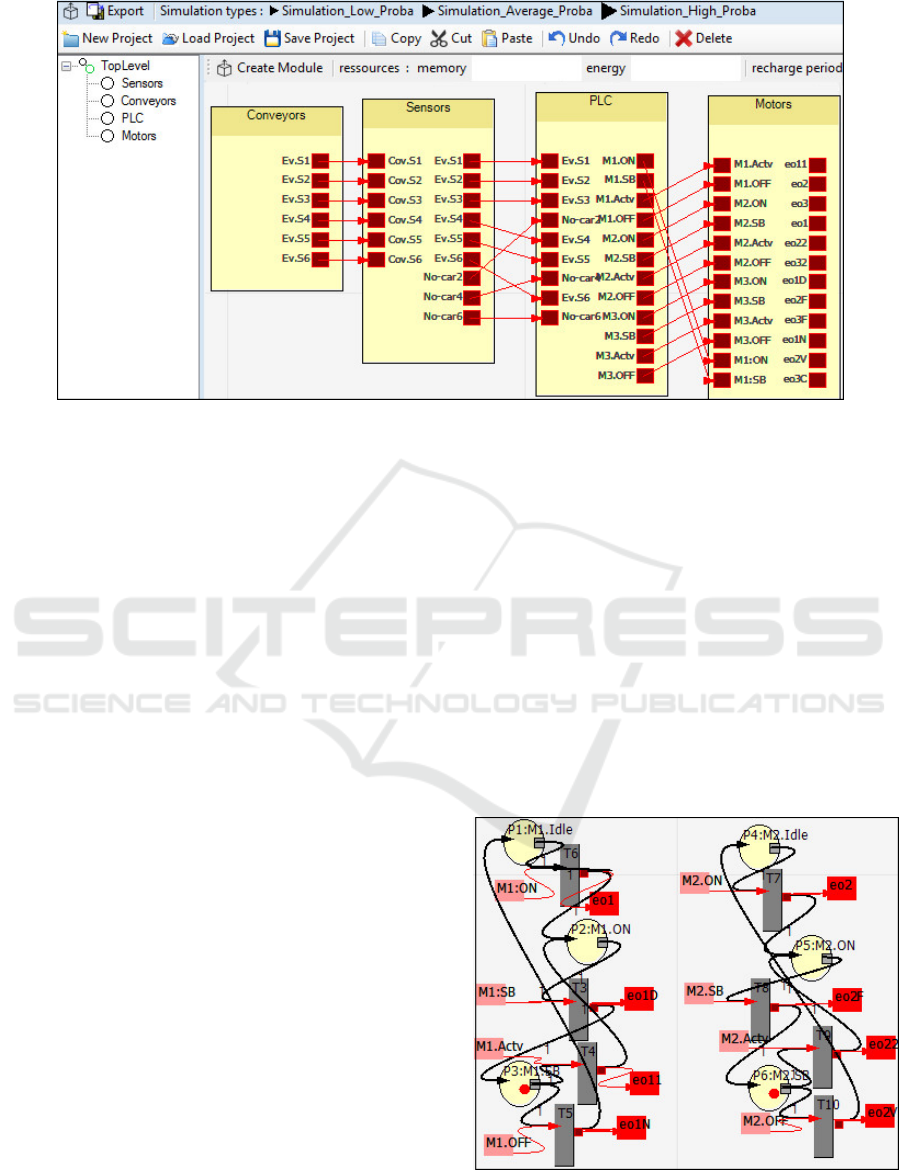
Figure 3: Production line plant model.
architectures communicating using condition/event
signals. ZIZO can establish the following operations:
(i). Modeling distributed system respecting the
GR-TNCES formalism,
(ii). Editing and connecting modules throw
condition and event signals,
(iii). Simulating the global model with a token game
animation, control the simulation depending
on energy reserves and showing the evolution
of reserve state at run-time: consumed as well
as the energy reserves,
(iv). Extracting curves for energy consumption
during the simulation time,
(v). Exporting the model to PRISM model checker
by the generation of the model’s code, loading
and saving a model.
4.1 Modeling the System
In this Section, we expose the automotive transport
system model. We model the new system model with
GR-TNCES formalism using the environment ZIZO.
We also model the old system (without control and
inductive sensors). To evaluate the energy
optimization of the proposed plant model, it should be
compared to the energy needed by the existent
production line model. Figure 3 describes the
proposed model which is a distributed discrete event
system composed of four modules: The car in the
conveyor, the sensors, PLC and the three motors. If
the sensitive sensor detects the entrance of a car in the
conveyor, then it sends an event signal to the PLC. It
activates and deactivates the corresponding motors
according to the car position in the conveyors. The
first module contains six events which correspond to
the six sensors installed in the skid conveyor. For the
Sensors module, it receives the events sent by the
conveyor then transfers them to PLC. It has three
extra-events denoted by “No-Car2”, “No-Car4”, and
“No-Car6” which correspond respectively to events
received from sensors number two, four and six to
notify the PLC about the car’s availability. The third
module corresponds to the PLC module that controls
the whole system. The PLC receives signals from the
sensors to control the state of the motors (active,
standby, off). The events “M1.ON”, “M1.SB”,
“M1.Act”, and “M1.Off” correspond respectively to
control the states of the motors “Start, Standby, Active
and Off”. Figure 4 shows two Motors’ model.
Figure 4: Model on motors.
Modeling and Simulation of an Energy Efficient Skid Conveyor using ZIZO
555
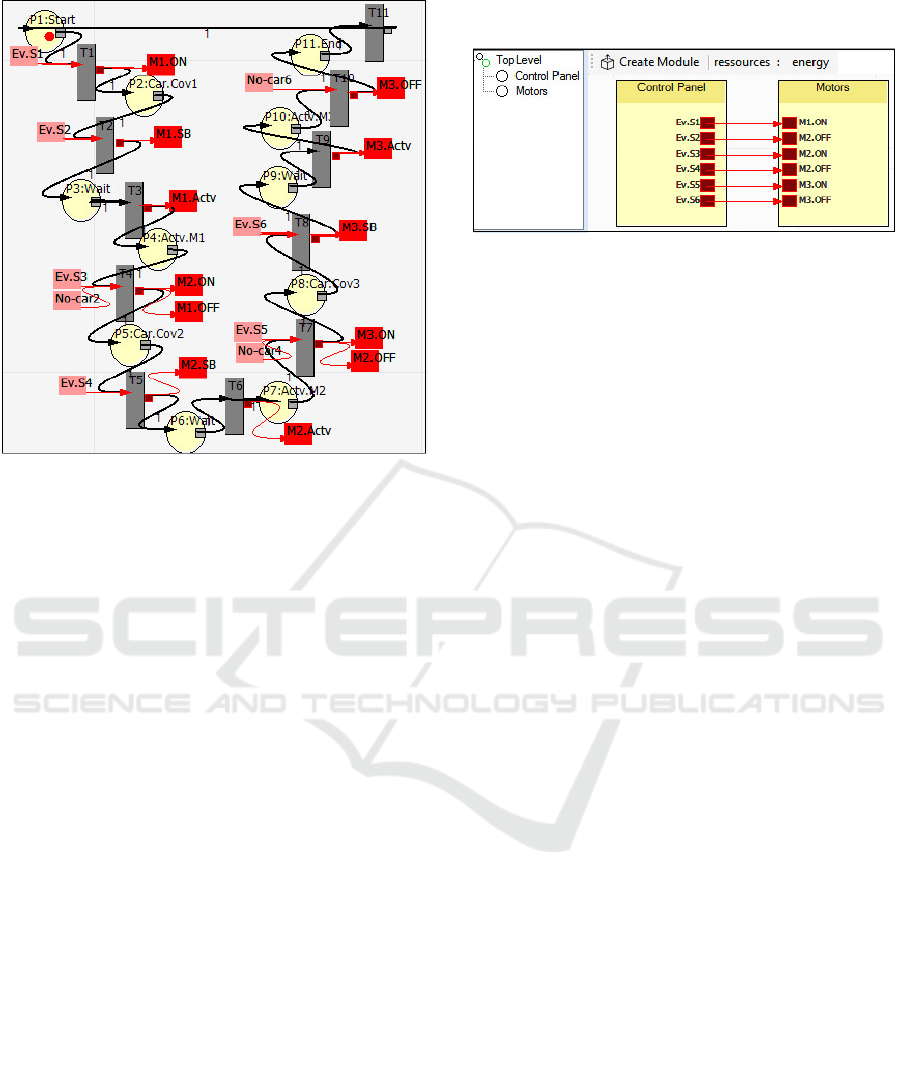
Figure 5: Model of the PLC.
This model describes the transition between the
different states of the motors. The pink rectangles
correspond to events-in received from the PLC to fire
the corresponding transitions. The motor keeps the
running mode till it receives a PLC signal. The event-
in “M1.SB” initiates the motor to switch from active
to standby mode; “M1.Act” is used to reactivate the
motor after the energy efficient mode standby. Figure
5 shows the PLC model that corresponds to the
transition between the system’s different states. The
pink rectangles correspond to event-in signals
received from the different sensors. The red
rectangles correspond to events-out signals that
control the motors’ states. The PLC model represents
the logical and the temporal control unit to manage
the entire system. Basically, it has to ensure the
following states: “Start”, “Car in conveyor 1”, “Wait
10 seconds”, “Activate Motor 1”, “Car in conveyor
2”, “Wait 10 seconds”, “Activate Motor 2”, “Car in
conveyor 3”, “Wait 10 seconds”, “Activate Motor 3”,
“End”. During the wait time states, the motor is in the
standby mode while there is another robot working on
the car’s chassis. Then, the motors move the car to the
next skid conveyor. There are additional sensors to
detect the workpiece’s position on the conveyor. The
control strategy is based on the sensors’ optimal
position to reduce the period in which it is essential to
activate two motors for the car movement tasks. We
detect exactly the suitable time for deactivating the
current motor and activating the next one.
4.2 Simulation and Optimization
Figure 6: Standard system’s model.
There are two system/model variants: an old one
where all the motors could be switched together and
manually from one mode to another operation mode
and another model where each motor can be
monitored and switched independently. The new
model also features additional sensors to detect the
position of the workpiece on the conveyor.
Accordingly, those motors need to be put into
operation mode, are automatized by means of the
PLC. To evaluate the energy optimization of the
proposed model, we refer to the old system’s model
to compare it. Thus, it is possible to calculate the
energy gain. The standard plant model contains only
touch screen for the control of the three motors. It is
used to activate and deactivate all the motors which
are continuously in a running mode except the delay
to work on the chassis by another robot. As showed
in Figure 6, the basic model contains only two
modules: “Control Panel” and “Motors”. The red
signals between these modules correspond to the
activation and deactivation control events of the
motors. We suppose that the motor consumes four
energy units (tokens) per second in the running mode,
one token in the standby mode and zero unit if it is
off. The energy consumption curves are showed in
Figure 7 during a simulation time (40 seconds). This
figure illustrates the evolution of the token number
needed by the system in this period. The curves
present three horizontals parts. It corresponds to the
period in which the motors are deactivated in the old
model and the standby mode in the proposed model.
The other portions correspond to the motors’
activation period and the energy consumed by the
three motors to move the car from one position to the
next one.
5 DISCUSSION
In Figure 7, we show the curves that describe the
proposed energy efficiency mode in the right graph
ICINCO 2016 - 13th International Conference on Informatics in Control, Automation and Robotics
556

Figure 7: Energy consumption.
and the curves of the energy consumption of the old
model in the left one. In the energy efficiency mode,
usually there is only one motor which is active. The
idea is based on the detection of the car position to
activate and deactivate the corresponding motors. We
aim to reduce the period in which we need two motors
to move the car from one skid to the next one through
the optimal position of the sensors. We simulate the
new model shown in Figure 3 and the basic one
shown in Figure 6 for the evaluation of their energy
resources consumption. The curves describe the
energy needed by each system during the simulation
time. We notice that there is an important reduction
of the energy consumed in the proposed model. For
the first part (2-4 seconds), the consumption is highly
reduced (22 to 9 tokens) since only one motor is
activated instead of three motors compared to the old
model. To move the car to the second position (13-
16s), the proposed system model consumed 22
tokens. On the other hand, the basic model needs 44
energy units for the same task. It is a valuable
optimization. In fact, the sensors detect the car
position and the PLC controls the activation and
deactivation of the motors: It deactivates the first
motor and turn on the second one. For the third part
of the system, this strategy enables us to save 24
energy units compared to the basic plant model.
6 CONCLUSION
This paper presents a method for modeling and
simulation of a transport system model. The
presented case study is an assembly automobile
production line platform with the aim to save energy.
For the modeling, an extension of Petri nets called
GR-TNCES (generalized reconfigurable timed net
condition event systems) is used: The simulation of
this model is performed with a specific tool named
ZIZO. Compared with the existent plant model, this
model is based on the introduction of new sensors to
detect the car position in the skid conveyor. The
authors simulate both the old and the new model to
evaluate the energy gain of the new system
(additional sensors and independent switching of the
motors). The reported result of the improved system
shows energy savings quite nicely. Using Petri net
tokens to model energy consumption is intuitive and
appears a reasonable choice. Thus, we are satisfied by
the proposed method. During the next step of this
project, we will work on the validation of the
proposed model through a real energy data
measurement of the skid conveyor. The strategy
presented in this paper is realized with the
PROFIenergy profile by switching inactive
components into energy efficient modes.
REFERENCES
Wang, Q., Wang, X., and Young, S., (2014). “Energy
consumption modelling of the machining system based
on Petri net,” Advances in Mechanical Engineering,
Article ID 324819.
BDEW, (2014). “Verteilung des Stromverbrauchs in
Deutschland nach Verbrauchergruppen”, (Distribution
of Energy Consumption among the Individual
Consumer Groups in 2014).
Bastide, R., Buchs, D., (1998). “Models, Formalisms and
Methods for Object-Oriented Distributed
Computing,” in Object-Oriented Technologys, Berlin
Heidelberg: Springer, pp 221-255.
Modeling and Simulation of an Energy Efficient Skid Conveyor using ZIZO
557

BMBF, (2014). Bundesministerium für Bildung und
Forschung, “Die neue Hightech-Strategie–
Innovationen für Deutschland”, (Federal Ministry of
Education and Research, The new High-Tech Strategy
– Innovations for Germany).
Chen, Y. F., Li, Z. W., and Zhou, M. C., (2014). “Optimal
supervisory control of flexible manufacturing systems
by Petri nets: A set classification approach,” IEEE
Trans. Autom. Sci. Eng., vol. 11, no. 2, pp. 549-563.
Khlifi, O., Mosbahi, O., Khalgui, M., and Frey, G., (2015).
“GR-TNCES: New extensions of R-TNCES for
modeling and verification of flexible systems under
energy and memory constraints,” in Proc. of Int. Conf.
on Soft. Eng. and App, ICSOFT-EA, Colmar, France,
pp. 373-380.
Salem, M. O. B., Mosbahi, O., Khalgui, M., and Frey, G.,
(2015). “ZiZo: Modeling, simulation and verification of
reconfigurable real-time control tasks sharing adaptive
resources: Application to the medical project BROS,”
in Proc. of the Int. Conf. on Health Informatics,
Portugal, pp. 20-31.
Andrade, E., Maciel, P., Callou, G., and Nogueira, B.,
(2009). “A methodology for mapping SysML activity
diagram to time petri net for requirement validation of
embedded real-time systems with energy constraints,”
in Proc. of the 3
rd
Int. Conf. on Digital Society, Cancun,
Mexico, pp. 266-271.
Cai, K., Zhang, R., and Wonham, W.M., (2015). “Relative
Observability of Discrete-Event Systems and its
Supremal Sublanguages,” IEEE Trans. on Automatic
Control, vol. 60, no.3, pp. 659-670.
Li, Z. W., and Zhou, M. C., (2009). “Deadlock Resolution
in Automated Manufacturing Systems: A Novel Petri
Net Approach,” London, U.K.: Springer, pp. 20-28.
Zhang, J., Khalgui, M., Li, Z.W., Mosbahi, O. and Al-
Ahmari, A. M., (2013). “R-TNCES: A novel formalism
for reconfigurable discrete event control systems,”
IEEE Trans. Systems, Man, and Cybernetics: Systems,
vol. 43, no. 4, pp. 757-772.
Ratzer, A. V., Wells, L., Lassen, H. M., Laursen, M.,
Qvortrup, J. F., Stissing, M. S., Westergaard, M.,
Christensen, S., and Jensen, K. (2003). “Cpn tools for
editing, simulating, and analysing coloured Petri nets,”
in Applications and Theory of Petri Nets, Berlin
Heidelberg: Springer, pp. 450-462.
Genter, G., Bogdan, S., Kovacic, Z., and Grubisic, I.,
(2007). “Software tool for modeling, simulation and
real-time implementation of Petri net-based
supervisors,” in IEEE Int. Conf. on Control
Applications, pp. 664-669.
Dubinin, V., Hanisch, H., and Karras, S., (2006). “Building
of reachability graph extractions using a graph
rewriting system,” in Proc. of the 7
th
Int. Conf. of
Science and Technology, NITis, pp. 160-171.
PROFIBUS Nutzerorganisation e.V., (2010). “Pi White
Paper: The PROFIenergy Profile,” Karlsruhe,
Germany, pp. 10-11.
PRISM 4.3 (July, 2015). PRISM Model checker, [Online].
Available: http://www.prismmodelchecker.org/.
ZeMA, (2015). [Online]. Available: http://zema.de.
ICINCO 2016 - 13th International Conference on Informatics in Control, Automation and Robotics
558
