
Internal Consistency of Physiological Responses during Exposure to
Emotional Stimuli using Biosensors
Eun-Hye Jang
1
, Ah-Young Kim
1
, Sang-Hyeob Kim
1
, Han-Young Yu
1
and Jin-Hun Sohn
2
1
Bio-Medical IT Convergence Research Department, Electronics and Telecommunications Research Institute,
Gajeongno, Yuseong-gu, Daejeon, Republic of Korea
2
Department of Psychology, Brain Research Institute, Chungnam National University,
Daehak-ro, Yuseong-gu, Daejeon, Republic of Korea
Keywords: Consistency, Biosensor, Physiological Response, Emotion.
Abstract: In biomedical engineering application, mental/physical health monitoring using biosensors has been lately
noticed because bio-signal acquisition by non-invasive sensors is relatively simple as well as bio-signal is
less sensitive to social/cultural difference. In particular, although it is known that they are significantly
correlated with human emotional state, whether the signals by various emotions are stable remains unknown.
In this study, we examined the consistency of physiological responses induced by six basic emotions,
happiness, sadness, anger, fear, disgust and surprise using an experiment that was repeated 10 times. Twelve
college subjects participated in this experiment. For emotion induction, sixty different emotional stimuli
were selected in a pilot experiment. Heart Rate (HR), Skin Conductance Level (SCL), mean of Skin
Temperature (meanSKT), and mean of Photoplethysmograph (meanPPG) were measured before the
presentation of stimuli as a baseline and during the presentation of the stimuli as emotional state. The results
showed that physiological responses during emotional states for the 10 times the experiment was repeated
were stable and consistent compared to the baseline. In particular, we could identify that physiological
features such as SCL, HR, and PPG are very reliable. Our results suggest that bio-signals by six emotions
are consistent over time regardless of various stimuli. This means that physiological responses are reliable
and biosensors are useful tool for emotion recognition.
1 INTRODUCTION
In biomedical engineering application, recent studies
have noted to improve health and wellbeing with the
help of Information and Communication Technology
(ICT) and in particular, mental/physical health
monitoring using biosensors has mainly done
because signal acquisition by non-invasive sensors is
relatively simple as well as biosignal is less sensitive
to social/cultural difference. Also, it is known that
several biosignals are significantly correlated with
human emotional state (Drummond and Quah, 2001;
Tefas, Kotropoulos, and Pitas, 2001). To provide
more effective wellbeing service, it is considered to
understand and recognize the emotions of humans.
However, a stability or reliability of physiological
responses related to emotional state using biosensors
remains unsolved (Hinz, Hueber, Schreinicke and
Seibt, 2002). To overcome this limitation, there were
many works which examine the temporal stability of
physiological responses using biosensors (Lacey and
Lacey, 1962; Fredrikson et al., 1985; Robinson,
Whitsett, and Kaplan, 1987; Waters, Williamson,
Bernard, Blouin and Faulstich, 1987; Arena,
Goldberg, Saul and Hobbs, 1989; Marwitz and
Stemmler, 1998). Some studies focused on proving
the stability and consistency of the physiological
response by introducing different time interval (e.g.,
2 weeks or 4 weeks) or using different kinds of
biomarkers (e.g., blinking responses, RSA, heart
period, and salivary cortisol, startle response)
(Manber, Allen, Burton and Kaszniak, 2000; Larson,
Ruffalo, Nietert and Davidson, 2000; Bradley,
Gianaros and Lang, 1995; Doussard-Roosevelt,
Montgomery and Porges, 2003). However, they
didn’t verify the consistency of physiological
responses over a relatively long period of time and
the stimuli with different contexts because the
physiological measures with the identical stimuli are
only twice within a relatively shorter period of
110
Jang, E-H., Kim, A-Y., Kim, S-H., Yu, H-Y. and Sohn, J-H.
Internal Consistency of Physiological Responses during Exposure to Emotional Stimuli using Biosensors.
DOI: 10.5220/0005998701100115
In Proceedings of the 6th International Joint Conference on Pervasive and Embedded Computing and Communication Systems (PECCS 2016), pages 110-115
ISBN: 978-989-758-195-3
Copyright
c
2016 by SCITEPRESS – Science and Technology Publications, Lda. All rights reserved

interval. Twice repeated measures with identical
stimuli may have possibly resulted in potential effect
of adaptation to stimuli, learning effect. To examine
the consistency of physiological responses over a
relatively long period of time, we identified the
stability of physiological responses induced by six
specific emotions (happiness, sadness, anger, fear,
disgust, and surprise) using sixty different emotional
stimuli in an experiment repeated 10 times. We
expect our study to exclude a possible of adaptation
and learning effect (e.g., habituation) that occurred
in the previous studies using the same stimuli. We
conducted experiments consisted often sessions
across ten weeks under the same experimental
conditions by using different emotional stimuli per
session to induce each basic emotion.
2 EXPERIMENTAL METHODS
2.1 Participants
Twelve college students (6 male and 6 females,
mean 21.0 years ± 1.98) who attend Chungnam
National University participated in the study. None
of them reported any history of medical illness or
experiences of taking psychotropic medication and
any medication that would affect the cardiovascular,
respiratory, or central nervous system. A written
consent was obtained at the beginning of the study
when they were introduced to the experimental
procedures, and they were also paid $200 USD to
compensate for their participation.
2.2 Emotional Stimuli
To successfully provoke target emotions, we have
used audio-visual film clips as emotional stimuli
because film clip includes dynamic information to
evoke effective emotional responses than those of
still pictures (Lazarus, Speisman, Mordkoff and
Davidson, 1962; Davis, Hull, Young and Warren,
1987; Palomba et al., 2000). Ten of each film clips
to induce six emotions were excerpted from a
variety of movies and TV shows such as
documentary and drama. Each clip lasted 2- to 4-
minute long. They were counter-balanced to
minimize the order effect. Table 1 describes the
content of the stimuli to induce 6 emotions. The
emotional stimuli had 91.3% appropriateness and
8.9 point effectiveness on average for the 10 times
across the different emotional conditions (Park, Jang,
Chung and Kim, 2013).
Table 1: Summary of emotional stimuli.
Emotion Context of Stimuli
HAP
joyful scenes consisted of
victorious, wedding, laughing
contents, etc.
SAD
frustration or grief scenes
consisted of the longing for
parents, a failure in love, etc.
ANG
deliberate harmful or unfair
behaviours such as massacre,
beating, or attack, etc.
FEA
scary scenes consisted of
ghost or haunted house etc.
DIS
disgusting scenes consisted of
mutilation, butchery, or dirty
restroom, etc.
SUR
sudden or unexpected
screaming scenes occurred by
startling accident etc.
2.3 Experimental Settings
Prior to the experiment, participants were allowed to
take time to feel comfortable in the laboratory
setting and provided with instruction to experiment.
Then, electrodes for acquisition of physiological
signals were placed on their wrists, fingers, and
ankle. They had 60 seconds before the stimulus
presentation as a baseline condition during which
their physiological responses were measured without
any emotional stimulus. Then, they were presented
the emotion provoking stimuli for 2~4 minutes. At
the end of stimulus presentation, participants were
asked to rate the specific emotions they had
experienced during exposure to emotional stimuli on
Likert scale (Likert, 1932). After the ratings, they
were given 2 minutes to get debriefed and recovered
from the emotional condition. The stimulus order
was randomized for each participant and the
experiment took roughly about an hour and a half,
including a short break. This procedure was
conducted on each of the two emotions for 10 weeks
on a weekly basis.
2.4 Physiological Measures and Data
Analysis
MP100WS of Biopac Systems Inc. (California,
USA) was used to measure bio-signals and
AcqKnowledge (version 3.7.1) were used to and
analyse them, respectively. The sampling rate was
fixed at 200 Hz for all channels, and appropriate
Internal Consistency of Physiological Responses during Exposure to Emotional Stimuli using Biosensors
111

amplification and band-pass filtering were
performed. EDA signal was measured with the use
of 8 mm AgCl electrodes placed on the volar surface
of the distal phalanges of the index and middle
fingers of the non-dominant hand. The electrodes
were filled with a 0.05 molar isotonic NaCl paste to
provide a continuous connection between the
electrodes and the skin. The skin conductance
channel was analysed as mean level (skin
conductance level, SCL, in uS) after movement and
electrode contact artifacts had been edited out. ECG
electrodes were placed on both wrists and the left
ankle using two kinds of electrodes, sputtered and
AgCl. The electrode on left ankle was used as a
reference. Heart rate (HR, in beats per minute) was
analysed by a program that detects R-waves in the
ECG and calculates consecutive R–R intervals. PPG
sensor was attached to the first joint of the non-
dominant thumb and SKT signals were acquired by
an SKT electrode attached to the first joint of the
non-dominant ring finger. meanPPG and meanSKT
were calculated by averaging raw PPG and SKT
amplitude values during 30-seconds, respectively.
To analyse the physiological data, we chose the
most stable 30-seconds section from the baseline and
the most emotional 30-seconds section from each
emotional states. The emotional conditions were
determined based on the results of the participant’s
self-reporting, in which an emotion was most
strongly expressed during the presentation of a
stimulus. A t-test was conducted to examine any
statistically significant (alpha level at .05)
differences between two conditions which is before
(baseline) and during the presentation of emotional
stimulus (emotional condition). Cronbach’s alpha
(Cronbach, 1951), which means internal consistency
was also used to examine the reliability of
physiological responses observed during the 10
sessions. Cronbach's alpha is a useful coefficient for
assessing internal consistency. The formula is:
α=
−1
(1 −
∑
)
(1)
where k is the number of items (session), s
i
2
is
the variance of the ith item (session) and s
T
2
is the
variance of the total score formed by summing all
the items (sessions).
3 RESULTS
3.1 Validity of Emotion Induction
The results of appropriateness and effectiveness by
Table 2: Participants’ mean ratings of intensity for each
intended emotion condition.
Emotion
M
HAP SAD ANG FEA DIS SUR
1
100
(8.4)
92
(9.5)
75
(9.7)
75
(10)
75
(10.2)
75
(9.3)
83
(9.5)
2
100
(8.9)
100
(9.1)
75
(9.9)
100
(9.9)
92
(10.8)
92
(9.7)
94
(9.6)
3
100
(8.8)
100
(8.7)
75
(9.7)
83
(9.8)
92
(9.9)
100
(9.7)
93
(9.3)
4
100
(9.6)
100
(9.7)
75
(9.5)
92
(9.6)
100
(10.4)
100
(9.9)
95
(9.7)
5
100
(9.6)
100
(9.3)
92
(9.8)
92
(9.7)
92
(9.7)
83
(9.6)
94
(9.6)
6
100
(9.3)
100
(9.3)
92
(9.4)
92
(9.7)
100
(10.3)
83
(9.6)
95
(9.5)
7
100
(9.3)
75
(8.9)
92
(8.9)
83
(9.6)
100
(9.3)
100
(9.5)
92
(9.3)
8
92
(8.0)
100
(9.0)
83
(9.2)
100
(9.3)
83
(10.2)
83
(9.4)
92
(9.2)
9
100
(9.7)
100
(9.2)
92
(9.5)
100
(9.3)
100
(10.1)
83
(8.6)
96
(9.4)
10
92
(8.8)
100
(9.3)
92
(9.7)
75
(8.7)
100
(10.1)
75
(10.3)
91
(9.5)
M
98
(9.1)
96
(9.2)
84
(9.5)
89
(9.6)
94
(10.1)
89
(9.5)
93.3
(9.4)
Abbreviations of each emotion are as follows. HAP
happiness, SAD sadness, ANG anger, FEA fear, DIS:
disgust, SUR: surprise
the participants’ ratings mean their psychological
responses to emotional stimuli. Results on
psychological responses of each session showed that
the emotional stimuli have the appropriateness of
93.3% and an effectiveness of 9.4 points on average
for 10 times. Also, the results showed that the
appropriateness ranges from 75% to 100 % and the
effectiveness ranges from 8.7 points up to 10.8
points on emotions (Table 2). These results show
that our stimuli appropriately and effectively
provoked both emotions.
3.2 Reliability of Bio-Signals Induced
by Emotional Stimuli
To examine the reliability of the physiological data
obtained during the 10 sessions, Cronbach’s alpha was
used as the reliability coefficients. Table 3 to table 8
show the descriptive statistics (mean and standard
deviation) and Cronbach’s alpha to physiological
parameters from 12 participants during each emotion
over 10 sessions. The results showed that Cronbach’s
alpha of emotional conditions had the range from .42
to .96 and they were greater than that of baseline
ranging from .10 to 71. Figure 1 shows Cronbach’s
alpha of physiological parameters during six baselines
SPCS 2016 - International Conference on Signal Processing and Communication Systems
112

and emotions. In all parameters, coefficients during
emotional states are higher than baseline.
Table 3: Cronbach’s alpha of physiological features during
happiness.
Time
SCL HR meanSKT meanPPG
BAS EMO BAS EMO BAS EMO BAS EMO
1
5.13
(3.07)
5.14
(4.74)
72.21
(10.34)
72.75
(11.07)
90.31
(0.03)
90.31
(0.01)
-8.38
(0.84)
-8.36
(0.86)
2
3.46
(3.27)
3.76
(3.11)
72.87
(11.25)
70.93
(10.10)
90.33
(0.04)
90.30
(0.04)
-8.39
(0.61)
-8.26
(0.70)
3
4.71
(2.69)
4.48
(2.91)
71.62
(8.84)
70.24
(9.36)
90.31
(0.02)
90.28
(0.03)
-8.17
(0.81)
-8.21
(0.66)
4
3.64
(2.01)
4.16
(2.57)
74.96
(9.08)
73.08
(9.38)
90.31
(0.03)
90.29
(0.02)
-8.69
(0.93)
-8.68
(0.98)
5
3.97
(2.99)
4.31
(2.81)
72.36
(10.68)
73.08
(11.77)
94.22
(1.96)
94.52
(1.31)
-8.82
(0.61)
-8.72
(0.66)
6
4.42
(2.97)
4.10
(3.61)
76.04
(9.58)
76.80
(12.22)
94.26
(1.72)
94.49
(1.53)
-8.20
(0.63)
-8.21
(0.57)
7
4.38
(2.78)
3.14
(2.68)
76.41
(10.36)
75.72
(9.01)
94.65
(1.44)
93.46
(2.79)
-8.27
(0.61)
-8.21
(0.67)
8
4.69
(3.13)
3.91
(3.88)
74.38
(10.51)
72.67
(11.89)
94.09
(1.90)
94.08
(2.52)
-8.10
(0.71)
-8.62
(0.74)
9
4.05
(2.85)
2.96
(2.02)
79.06
(11.78)
76.52
(16.09)
94.54
(1.62)
94.71
(2.83)
-8.21
(0.64)
-8.50
(0.67)
10
4.35
(2.81)
3.29
(3.73)
80.00
(14.37)
78.60
(13.24)
94.50
(1.53)
95.07
(1.84)
-8.35
(0.59)
-8.85
(0.65)
M
4.28
(2.86)
3.93
(3.21)
74.99
(10.68)
74.09
(11.72)
92.8
(1.03)
92.75
(1.29)
-8.35
(0.70)
-8.46
(0.72)
α .61 .95 .44 .92 .10 .76 .63 .95
Table 4: Cronbach’s alpha of physiological features during
sadness.
Time
SCL HR meanSKT meanPPG
BAS EMO BAS EMO BAS EMO BAS EMO
1
4.99
(2.87)
5.48
(4.42)
70.54
(10.15)
70.79
(10.20)
90.31
(0.02)
90.31
(0.02)
-8.48
(0.91)
-8.38
(0.92)
2
3.90
(2.48)
3.33
(2.50)
69.19
(8.57)
68.05
(8.32)
90.30
(0.02)
90.31
(0.04)
-8.11
(0.85)
-8.14
(0.80)
3
4.65
(2.62)
3.84
(2.42)
69.42
(7.78)
68.98
(8.74)
90.30
(0.04)
90.29
(0.01)
-8.07
(0.80)
-8.12
(0.84)
4
4.13
(2.03)
3.60
(2.15)
73.27
(9.84)
74.49
(11.83)
90.32
(0.03)
90.28
(0.04)
-8.52
(0.87)
-8.48
(0.85)
5
4.54
(2.46)
4.23
(2.89)
72.90
(10.07)
71.66
(11.61)
93.44
(3.39)
93.86
(3.45)
-8.63
(0.91)
-8.60
(0.98)
6
4.36
(3.21)
4.44
(2.68)
73.11
(9.56)
73.33
(10.57)
93.17
(2.86)
94.84
(1.78)
-8.19
(0.76)
-8.25
(0.70)
7
4.32
(2.55)
4.27
(3.20)
75.17
(9.57)
71.05
(10.07)
93.99
(1.84)
92.57
(4.74)
-7.93
(0.75)
-8.10
(0.87)
8
4.18
(2.89)
4.21
(2.97)
74.56
(10.31)
70.01
(9.98)
92.78
(4.93)
93.36
(3.75)
-8.29
(0.75)
-8.47
(0.94)
9
4.49
(2.56)
3.70
(2.05)
75.14
(10.77)
71.72
(11.32)
93.99
(2.51)
95.27
(1.25)
-8.02
(0.73)
-8.25
(0.91)
10
3.94
(3.41)
3.83
(2.84)
76.96
(12.14)
75.54
(11.15)
92.66
(4.40)
94.60
(2.52)
-8.21
(0.89)
-8.58
(0.99)
M
4.35
(2.71)
4.09
(2.79)
73.03
(10.18)
71.56
(10.88)
92.13
(2.00)
92.57
(1.76)
-8.25
(0.83)
-8.34
(0.88)
α .63 .95 .48 .96 .22 .53 .57 .96
Table 5: Cronbach’s alpha of physiological features during
anger.
Time
SCL HR meanSKT meanPPG
BAS EMO BAS EMO BAS EMO BAS EMO
1
5.22
(3.36)
4.92
(3.00)
71.50
(9.45)
70.99
(11.13)
90.32
(0.04)
90.29
(0.03)
-8.42
(0.91)
-8.37
(0.90)
2
4.05
(2.42)
3.56
(2.33)
71.35
(9.31)
68.57
(10.47)
90.32
(0.05)
90.30
(0.03)
-8.14
(0.78)
-8.18
(0.71)
3
4.64
(2.63)
4.29
(3.11)
71.01
(8.91)
68.12
(9.99)
90.30
(0.05)
90.30
(0.05)
-8.07
(0.79)
-8.27
(0.78)
4
3.91
(2.21)
3.77
(2.69)
73.07
(9.62)
71.82
(10.33)
90.31
(0.05)
90.32
(0.03)
-8.55
(0.94)
-8.62
(0.95)
5
4.25
(2.39)
4.45
(3.15)
70.80
(11.11)
68.60
(9.93)
94.36
(1.64)
94.40
(2.03)
-8.64
(0.92)
-8.58
(0.95)
6
4.17
(3.43)
3.93
(2.73)
74.33
(9.06)
74.67
(11.42)
93.13
(3.74)
94.23
(2.05)
-8.64
(0.92)
-8.22
(0.60)
7
4.56
(3.39)
4.11
(3.12)
74.12
(10.23)
71.28
(8.94)
92.15
(4.16)
93.86
(2.10)
-8.34
(0.81)
-8.11
(0.86)
8
3.56
(2.54)
4.80
(3.19)
73.08
(11.06)
70.92
(10.43)
93.55
(4.23)
94.08
(2.22)
-8.26
(0.80)
-8.46
(0.90)
9
3.72
(3.03)
3.31
(2.18)
75.50
(11.79)
73.45
(12.18)
91.80
(4.52)
94.84
(1.98)
-8.29
(0.81)
-8.26
(0.79)
10
4.22
(2.68)
4.23
(3.31)
78.15
(14.77)
75.29
(13.70)
92.56
(3.21)
95.26
(1.27)
-8.27
(0.72)
-8.59
(0.87)
M
4.23
(2.81)
4.14
(2.88)
73.29
(10.53)
71.37
(11.05)
91.88
(2.17)
92.79
(1.13)
-8.31
(0.84)
-8.37
(0.83)
α .47 .96 .26 .96 .43 .57 .41 .96
Table 6: Cronbach’s alpha of physiological signal during
fear emotion.
Time
SCL HR meanSKT meanPPG
BAS EMO BAS EMO BAS EMO BAS EMO
1
5.07
(3.11)
5.56
(4.06)
72.77
(10.09)
70.80
(12.05)
90.32
(0.02)
90.29
(0.02)
-8.40
(0.90)
-8.33
(0.90)
2
3.93
(2.75)
4.80
(3.66)
70.49
(7.86)
69.27
(9.55)
90.33
(0.02)
90.27
(0.04)
-8.32
(0.77)
-8.20
(0.74)
3
4.61
(2.86)
4.82
(3.07)
71.60
(7.52)
71.59
(8.77)
90.31
(0.02)
90.29
(0.03)
-8.17
(0.64)
-8.21
(0.64)
4
3.97
(2.00)
4.63
(2.37)
73.84
(10.17)
71.99
(10.39)
90.30
(0.03)
90.29
(0.04)
-8.59
(0.87)
-8.47
(0.85)
5
4.53
(2.27)
5.10
(2.74)
71.77
(10.65)
67.23
(11.02)
94.01
(1.87)
93.86
(1.75)
-8.64
(0.86)
-8.60
(0.90)
6
3.68
(2.59)
5.35
(3.12)
75.30
(11.05)
73.51
(9.46)
94.27
(2.62)
94.35
(1.85)
-8.47
(0.89)
-8.18
(0.69)
7
3.43
(2.19)
4.74
(3.13)
75.99
(10.11)
73.98
(9.19)
92.81
(4.88)
92.44
(3.98)
-8.35
(0.64)
-8.30
(0.85)
8
3.92
(2.64)
5.83
(3.43)
73.33
(10.27)
68.99
(9.98)
94.82
(1.15)
93.63
(2.48)
-8.55
(0.81)
-8.50
(0.82)
9
4.07
(2.51)
4.21
(2.25)
78.05
(6.74)
75.27
(12.91)
94.37
(1.89)
94.90
(1.23)
-8.34
(0.94)
-8.17
(0.87)
10
3.83
(2.83)
4.09
(2.04)
77.58
(12.94)
73.59
(12.04)
95.10
(1.23)
95.14
(1.77)
-8.37
(0.94)
-8.59
(0.93)
M
4.10
(2.58)
4.91
(2.99)
74.07
(9.74)
71.62
(10.54)
92.66
(1.37)
92.55
(1.32)
-8.42
(0.84)
-8.35
(0.82)
α .57 .94 .46 .96 .37 .71 .71 .96
Internal Consistency of Physiological Responses during Exposure to Emotional Stimuli using Biosensors
113
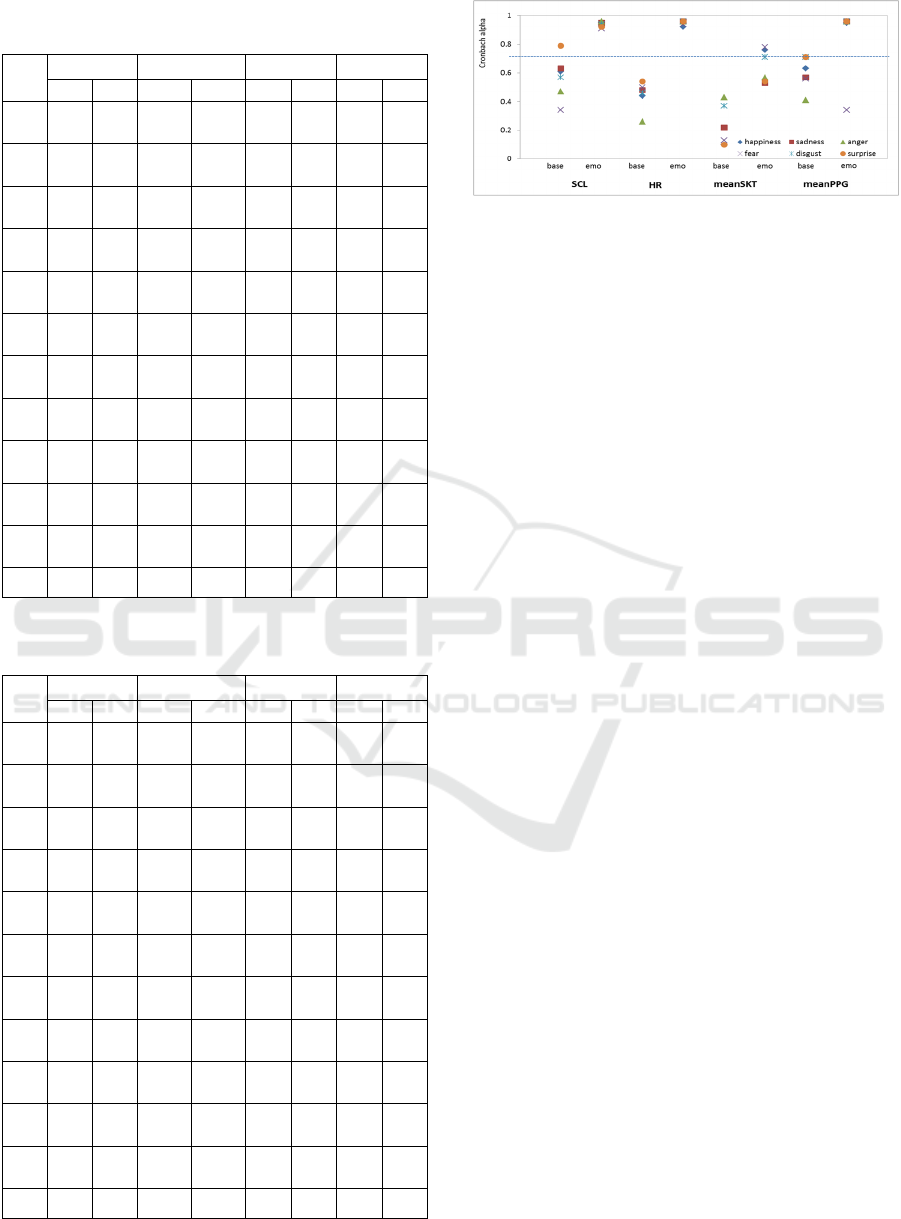
Table 7: Cronbach’s alpha of physiological signal during
disgust emotion.
Time
SCL HR meanSKT meanPPG
BAS EMO BAS EMO BAS EMO BAS EMO
1
5.07
(3.11)
5.56
(4.06)
72.77
(10.09)
70.80
(12.05)
90.32
(0.02)
90.29
(0.02)
-8.40
(0.90)
-8.33
(0.90)
2
3.93
(2.75)
4.80
(3.66)
70.49
(7.86)
69.27
(9.55)
90.33
(0.02)
90.27
(0.04)
-8.32
(0.77)
-8.20
(0.74)
3
4.61
(2.86)
4.82
(3.07)
71.60
(7.52)
71.59
(8.77)
90.31
(0.02)
90.29
(0.03)
-8.17
(0.64)
-8.21
(0.64)
4
3.97
(2.00)
4.63
(2.37)
73.84
(10.17)
71.99
(10.39)
90.30
(0.03)
90.29
(0.04)
-8.59
(0.87)
-8.47
(0.85)
5
4.53
(2.27)
5.10
(2.74)
71.77
(10.65)
67.23
(11.02)
94.01
(1.87)
93.86
(1.75)
-8.64
(0.86)
-8.60
(0.90)
6
3.68
(2.59)
5.35
(3.12)
75.30
(11.05)
73.51
(9.46)
94.27
(2.62)
94.35
(1.85)
-8.47
(0.89)
-8.18
(0.69)
7
3.43
(2.19)
4.74
(3.13)
75.99
(10.11)
73.98
(9.19)
92.81
(4.88)
92.44
(3.98)
-8.35
(0.64)
-8.30
(0.85)
8
3.92
(2.64)
5.83
(3.43)
73.33
(10.27)
68.99
(9.98)
94.82
(1.15)
93.63
(2.48)
-8.55
(0.81)
-8.50
(0.82)
9
4.07
(2.51)
4.21
(2.25)
78.05
(6.74)
75.27
(12.91)
94.37
(1.89)
94.90
(1.23)
-8.34
(0.94)
-8.17
(0.87)
10
3.83
(2.83)
4.09
(2.04)
77.58
(12.94)
73.59
(12.04)
95.10
(1.23)
95.14
(1.77)
-8.37
(0.94)
-8.59
(0.93)
M
4.10
(2.58)
4.91
(2.99)
74.07
(9.74)
71.62
(10.54)
92.66
(1.37)
92.55
(1.32)
-8.42
(0.84)
-8.35
(0.82)
α .57 .94 .46 .96 .37 .71 .71 .96
Table 8: Cronbach’s alpha of physiological signal during
surprise emotion.
Time
SCL HR meanSKT meanPPG
BAS EMO BAS EMO BAS EMO BAS EMO
1
5.06
(3.45)
6.52
(3.11)
71.08
(11.06)
70.46
(10.52)
90.32
(0.03)
90.30
(0.03)
-8.33
(0.86)
-8.33
(0.95)
2
4.03
(2.85)
4.62
(2.26)
72.96
(9.13)
69.71
(8.49)
90.32
(0.04)
90.30
(0.03)
-8.29
(0.83)
-8.22
(0.74)
3
3.85
(3.39)
3.68
(3.11)
72.04
(7.19)
69.85
(8.17)
90.29
(0.04)
90.30
(0.02)
-8.29
(0.71)
-8.40
(0.59)
4
3.95
(3.03)
4.82
(1.98)
73.75
(8.71)
73.83
(10.51)
90.30
(0.03)
90.31
(0.04)
-8.70
(0.86)
-8.57
(0.87)
5
4.09
(2.21)
4.11
(2.35)
72.44
(13.69)
68.19
(10.48)
93.96
(1.97)
93.87
(2.01)
-8.71
(0.81)
-8.65
(0.87)
6
4.16
(2.90)
5.84
(3.01)
74.75
(10.90)
72.36
(10.94)
94.57
(2.24)
94.38
(1.90)
-8.49
(0.86)
-8.17
(0.71)
7
3.66
(1.55)
4.63
(3.09)
75.60
(11.40)
74.20
(10.11)
94.37
(1.52)
92.40
(4.28)
-8.62
(0.93)
-8.12
(0.75)
8
3.96
(2.38)
5.89
(3.02)
75.94
(11.75)
71.06
(12.19)
93.93
(3.24)
93.02
(4.38)
-8.37
(0.98)
-8.51
(1.00)
9
4.50
(3.14)
4.73
(2.52)
73.68
(10.91)
72.51
(10.93)
94.97
(1.65)
94.71
(1.08)
-8.52
(0.94)
-8.28
(0.98)
10
3.91
(2.50)
4.74
(2.45)
77.85
(11.84)
75.41
(14.23)
94.59
(1.33)
94.89
(2.34)
-8.36
(0.89)
-8.58
(0.96)
M
4.12
(2.74)
4.96
(2.89)
74.01
(10.66)
71.76
(10.66)
92.76
(1.21)
92.45
(1.61)
-8.47
(0.88)
-8.38
(0.84)
α .79 .92 .54 .96 .10 .54 .71 .96
Figure 1: Cronbach’s alpha of physiological signal during
all emotions.
4 CONCLUSIONS
We have attempted to investigate the consistency on
changes of bio-signals induced by emotional stimuli.
The used emotional stimuli have been proved to be
appropriate and effective in inducing targeted
emotions regardless of variety of stimulus (Table 2).
They were not only designed to produce active and
vivid images, even more effective than those of
static emotional stimuli (e.g., facial expressions,
slides, and imagery), but also considered particularly
advantageous for the clips have already been
standardized for conditioning purposes, require little
or no deception, and possess a high degree of
ecological validity in so far as to effectively evoke
emotions via dynamic auditory and visual situations
external (Gross and Levenson, 1995; Christie and
Friedman, 2004).
In physiological results, despite a small sample
size (n=12), Cronbach’s alpha, coefficient of internal
consistency had range from .10 to .71 in responses
during baseline. The lower consistency during
baseline may reflect the inter-individual differences
of physiological responses. Nevertheless, except for
meanSKT, the coefficients of SCL, HR, and
meanPPG during each emotional condition were
very high, having the range from .91 to .96. The
value of alpha greater than .9 means that internal
consistency is excellent and alpha value from .7 to .9
is good (George and Mallery, 2003; Kline, 2000).
Our result means that physiological responses during
emotional conditions are very stable and consistent
regardless of variety of emotional stimuli over time.
In conclusion, we have identified the reliability
of physiological responses induced by emotional
stimuli regardless of various stimuli and time. Our
results suggest that physiological responses such as
SCL and HR induced by emotional stimuli are very
stable and consistent. They can be useful in emotion
recognition, developing an emotion theory, or
profiling emotion-specific physiological responses,
SPCS 2016 - International Conference on Signal Processing and Communication Systems
114

as well as establishing the basis for an emotion
recognition system in human-computer interaction.
ACKNOWLEDGEMENTS
This work was supported by Institute for
Information & communications Technology
Promotion (IITP) grant funded by the Korea
government (MSIP) (No. B0132-15-1003).
REFERENCES
Wagner, J., Kim, J., Andre, E., 2005. From physiological
signals to emotions: Implementing and comparing
selected methods for feature extraction and
classification. IEEE International Conference on
Multimedia and Expo, pp.940-943.
Drummond, P. D., Quah, S. H., 2001. The effect of
expressing anger on cardiovascular reactivity and
facial blood flow in Chinese and Caucasians,
Psychophysiology, vol. 38, pp. 190-196.
Tefas, A., Kotropoulos, C., Pitas, I., 2001. Using support
vector machines to enhance the performance of elastic
graph matching for frontal face authentication, IEEE
Transactions on Pattern Analysis and Machine
Intelligence, vol. 23, pp. 735-746.
Hinz, A., Hueber, B., Schreinicke, O., Seibt, R., 2002.
Temporal stability of psychophysiological response
patterns: concepts and statistical tools. International
Journal of Psychophysiology, vol. 44, pp. 57-65.
Lacey, J. I., Lacey, B. C., 1962. The law of initial value in
the longitudinal study of autonomic constitution:
reproducibility of the autonomic responses and
response patterns over a four years interval. Annals of
the New York Academy of Sciences, vol. 98, pp. 1257-
1290.
Fredrikson, M., Danielssons, T., Engel, B. T., Frisk-
Holmberg, M., Strom, G., Sundin, O., 1985.
Autonomic nervous system function and essential
hypertension: individual response specificity with and
without beta-adrenergic blockade. Psychophysiology,
vol. 22, pp. 167-174.
Robinson, J. W., Whitsett, S. F., Kaplan, B. J., 1987. The
stability of physiological reactivity over multiple
sessions. Biological Psychology, vol. 24, pp. 129-139.
Waters, W. F., Williamson, D. A., Bernard, B. A., Blouin,
D. C., Faulstich, M. E., 1987. Test-retest reliability of
psychophysiological assessment. Behaviour Research
and Therapy, vol. 25, pp. 213-221.
Arena, J. G., Goldberg, S. J., Saul, D. L., Hobbs, S. H.,
1989. Temporal stability of psychophysiological
response profiles: Analysis of individual response
stereotypy and stimulus specificity. Behavior Therapy,
vol. 20, pp. 609-618.
Marwitz, M., Stemmler, G., 1998. On the status of
individual response specificity. Psychophysiology, vol.
35, pp. 1-15.
Manber, R., Allen, J. J. B., Burton, K., Kaszniak, A. W.,
2000. Valence-dependent modulation of psychophysi-
ological measures: Is there consistency across repeated
testing. Psychophysiology, vol. 37, pp. 683-692.
Larson, C. L., Ruffalo, D., Nietert, J. Y., Davidson, R. J.,
2000. Temporal stability of the emotion-modulated
startle response. Psychophysiology, vol. 37, pp. 92-101.
Bradley, M. M., Gianaros, P., Lang, P., 1995. As time
goes by: Stability of startle modulation. SPR abstracts,
S21.
Doussard-Roosevelt, J. A., Montgomery, L. A., Porges, S.
W., 2003. Short-term stability of physiological
measures in kindergarten children: respiratory sinus
arrhythmia, heart period, and cortisol. Developmental
Psychobiology, vol. 43, pp. 230-242.
Lazarus, R. S., Speisman, J. C., Mordkoff, A. M.,
Davidson, L. A., 1962. A Laboratory study of
psychological stress produced by an emotion picture
film. Psychological Monographs, vol. 76, pp. 553.
Davis, M. H., Hull, J. G., Young, R. D., Warren, G. G.,
1987. Emotional reactions to dramatic film stimuli: the
influence of cognitive and emotional empathy. Journal
of Personality and Social Psychology, vol. 52, pp.
126-133.
Palomba, D., Sarlo, M., Angrilli, A., Mini, A., Stegagno,
L., 2000. Cardiac responses associated with affective
processing of unpleasant film stimuli. International
Journal of Psychophysiology, vol. 36, pp. 45-57.
Park, B.H., Jang, E.H., Chung, M.A., Kim, S.H., 2013.
Design of prototype-based emotion recognizer using
physiological signals, ETRI Journal, vol. 35, pp. 869-
879.
Likert, R., 1932. A technique for the measurement of
attitudes. Arch of Psychol, vol. 140, pp. 1–55.
Cronbach, L. J., 1951. Coefficient alpha and the internal
structure of tests. Psychometrika, vol. 16, 1951, pp.
297–334.
Gross, J. J., Levenson, R. W., 1995. Emotion elicitation
using films. Cognition & emotion, vol. 9, pp. 87-108.
Christie, I., Friedman, B., 2004. Autonomic specificity of
discrete emotion and dimensions of affective space: A
multivariate approach. International Journal of
Psychophysiology, vol. 51, pp. 143-153.
George, D., Mallery, P., 2003. SPSS for Windows step by
step: A simple guide and reference. 11.0 update (4th
ed.). Boston: Allyn & Bacon.
Kline, P., 2000. The handbook of psychological testing
(2nd ed.),” London: Routledge, pp. 13.
Internal Consistency of Physiological Responses during Exposure to Emotional Stimuli using Biosensors
115
