
Social Evaluation of Learning Material
Paolo Avogadro, Silvia Calegari and Matteo Dominoni
DISCo, University of Milano-Bicocca, viale Sarca 336/14, 20126, Milano, Italy
Keywords:
Social Learning Management System, Learning Material, KirckPatrick-Philips Model, Wall.
Abstract:
In academic environments the success of a course is given by the interaction among students, teachers and
learning material. This paper is focused on the definition of a model to establish the quality of learning
material within a Social Learning Management System (Social LMS). This is done by analyzing how teachers
and students interact by: (1) objective evaluations (e.g., grades), and (2) subjective evaluations (e.g., social data
from the Social LMS). As a reference, we use the Kirkpatrick-Philips model to characterize learning material
with novel key performance indicators. As an example, we propose a social environment where students and
teachers interact with the help of a wall modified for the evaluation of learning material.
1 INTRODUCTION
Many higher education institutions conduct evalua-
tions for assessing the whole learning process. The
methodologies which are usually employed try to give
a measure of the general growth of the people (i.e.,
teachers and students) involved in the learning pro-
cess. The reason is to keep improving the quality of
the courses. In (Larsson et al., 2007), the authors try
to answer to the following question: “What impacts
course evaluations?” This is a very difficult subject
that involves the quality of three main factors: (1)
teachers, (2) students, and (3) learning material. For
a given course, the overall quality of the academic
process is a complex interaction among these three
elements. This interdependence considers many fac-
tors which are difficult to control and dissociate (e.g.,
how the material was presented, teacher items, time
spent per week, student-teacher interaction, etc.). The
evaluations of teachers are mainly based on question-
naires carried out by students; while evaluationsof the
students are performed by teachers, managers or sup-
port specialists. In our opinion, a key role for the suc-
cess of a course is played by the value of the learning
material that can contribute positively (or negatively)
to the overall success. However, a structured process
devoted to the assessment of the quality of learning
material is not common.
The goal of this work is to provide a methodol-
ogy to evaluate the learning material. With the ad-
vent of the LMS, the learning material has become
increasingly important as it comprises of both formal
and informal elements in an augmented vision of the
blended learning paradigm (Osguthorpe and Graham,
2003). Given the heterogeneity of the sources (i.e.,
textbooks, videos, websites, unit outlines, slides, stu-
dents productions, syllabuses, etc.), it is difficult to
provide a unique approach valuable for all these types
of information. Our idea is to go beyond the standard
questionnaires (Guerin and Michler, 2011) with the
objective to analyze the actions of teachers and learn-
ers related to the formal material during a course. In
addition, the final judgement on the material is given
by the evaluation of each its individual fragments; this
means that we perform an assessment of the learning
material at different granular levels based on the con-
tent.
The starting point of our methodology is
the Kirckpatrick-Phillips model (Newstrom, 1995;
Phillips and Phillips, 2003; Kirkpatrick and Kirk-
patrick, 2010); we propose a new instance of it to
evaluate the learning material by considering the case
of classes connected via Social LMS. Our approach
involves the use of a wall associated with the learning
material which serves both as a studying tool and as
a mean in order to gather social evaluations based on
the users’ actions. The main idea is to use the syl-
labuses, which are supposed to provide the detailed
structure of the course, to give a utilization frame-
work for the material, to collect information about its
usage, and to help the students and the teachers to ex-
ploit better its features.
164
Avogadro, P., Calegari, S. and Dominoni, M.
Social Evaluation of Learning Material.
DOI: 10.5220/0005994401640169
In Proceedings of the 5th International Conference on Data Management Technologies and Applications (DATA 2016), pages 164-169
ISBN: 978-989-758-193-9
Copyright
c
2016 by SCITEPRESS – Science and Technology Publications, Lda. All rights reserved

2 THE KIRCKPATRICK-PHILIPS
MODEL FOR LEARNING
MATERIAL
The Kirkpatrick-Philips model (KP) (Phillips and
Phillips, 2003; Kirkpatrick and Kirkpatrick, 2010) is
a method for assessing the success of a training for
companies (Tour´e et al., 2014). The KP model is
structured in 5 levels: Reaction, Learning, Behav-
ior, Results and Return on Investment (ROI). Reac-
tion analyses the judgement of the participants with
the intent to answer to questions as - Did they like it?
How hard was it? Was the speaker addictive? Was the
content interesting? A positive reaction is expected
to help learning, while a negative reaction most likely
renders the learning process more difficult. Within the
Learning phase it is measured how much of the pro-
posed information has been understood and retained
by the participants. The Behavior level is used to es-
tablish the impact on the actions of the learners. Are
the newly acquired skills, knowledge, or attitude be-
ing used in the everyday environment of the learner?
How did the performance change due to the training
provided? The Results level was aimed at giving a fi-
nal assessment on the training by considering all the
steps just mentioned. Good results are achieved if
some indicators are improved in the organization such
as the increased efficiency, decreased costs, improved
quality, etc. The ROI indicator relates the beneficial
effects of the training with the costs that the com-
pany sustained for doing it. The question asked is:
“Is there a reasonable return on investment?” The ROI
formula (Phillips and Phillips, 2003) is calculated as
ROI = (Benefit −Cost)/Cost × 100.
2.1 Definition of the Learning Elements
for the KP Model
This section presents a revised definition of the KP
model in order to evaluate the formal material (here-
after referredto as learning material or material) used
during scholastic courses within a Social LMS. In or-
der to be able to evaluate the material alone, we re-
strict the possible sources of knowledge to be rated
and the student populations which use them:
Material: we analyze those learning sources
which can be defined as a union of fragments (even-
tual synergy among the fragments should be ne-
glectable). Formally, LM = FR
1
∪ FR
2
∪ ··· ∪ FR
n
=
S
n
f=1
FR
f
, where LM is a given learning material, and
FR is the set of its fragments. At the end of a course
it is possible combine the fragments to define the final
evaluation of the material as a whole.
Students: we restrict our analysis to a subset of
the whole population of learners. This is done for
better disentangling the ratings due to the character-
istics of the learner and those pertaining more to the
material itself. We define a quantity related to the dif-
ficulty level perceived by learner l (d
l
). The difficulty
level, d
l
, is defined by four social grades of judgement
that are:very hard (3 points), hard (2 points), easy
(1 points), and very easy (0 points). This difficulty
judgement has to be filtered by considering its pos-
sible interaction with the quality of the learner. For
example, one can expect that a learner with very bad
average grades would rate the material as very diffi-
cult; on the other hand, a very bright student might
consider simple almost all the material. We classify
the learners in four categories from very good to very
bad and assign to them an index g
l
: 0 for very good, 1
for good, 2 for bad and 3 for very bad. In practice,
this is achieved by considering the average grades
of the learners in the other subjects (but for the best
and worst grade) and bin the results in 4 parts. For
example, in a 0 to 10 scale system, those students
whose grade are in the interval [0,2.5) will have in-
dex 3, those in [2.5,5) index 2, those between [5,7.5)
index 1 and the very best ones [7.5,10] will have in-
dex 0. According to this selection the number of stu-
dents involved in the calculation of the indicator be-
comes L =
∑
l
1− δ
g
l
,d
l
, where the index l runs on
all the learners of the course; g
l
and d
l
are integer
numbers (in the range [0,3]) associated with the qual-
ity of student l and the difficulty he/she preceived re-
garding some material; δ
g
l
,d
l
is the Kronecker delta
being equal to 1 in the case where the first index is
identical to the second index, and zero otherwise. For
example, the student associated with l = 13 is very
good (g
13
= 0) and considers the material as very easy
(d
13
= 0) thus we remove him/her from the interest-
ing population (δ
0,0
= 1), whereas student 18 is also
very bright (g
18
= 0) but he/she thinks that the mate-
rial is rather hard (d
18
= 2), and as such we consider
him/her in the restricted population (δ
0,1
= 0). Since
this is a filtering procedure, in principle it is possible
that all the students are removed from the total popu-
lation, in this case our method becomes less effective,
but one can continue to use it by taking into account
the whole student population of a course.
2.2 The Novel KirckPatrick-Philips
Model
The novel interpretation of the KP model dedicated to
the assessment of a formal learning material is defined
as follows (see Figure 1):
Reaction: “What is the impression of learners
Social Evaluation of Learning Material
165

Figure 1: The Kirkpatrick-Phillips model to evaluate formal
learning material.
about the Learning Material?” This quantity can be
analyzed with two main techniques: explicit and im-
plicit (Claypool et al., 2001). With the explicit ap-
proach the users must openly specify their prefer-
ences. With the implicit approach, the user’s prefer-
ences are automatically gathered by monitoring the
user’s actions. In this work, we consider an ex-
plicit approach by estimating the grade of difficulty
that learners have during their studies. The difficulty
value, D
LM
, is defined as D
LM
=
1
L
∑
L
l=1
d
l
, where d
l
is
the difficulty judgement selected by learner l (belong-
ing to the restricted population) on the material LM.
In our method, d
l
= { 0,1,2, 3} where each point is as-
sociated with the social grade of judgement explained
in Section 2.1.
Learning: “To what extent does the learning
material affect the knowledge transfer of learners?”
Learning refers to the idea of assessing how much
of the information which was presented has been un-
derstood and retained by the learners of the training.
A formal assessment can be defined by the teacher’s
judgment or by official tests after the use of the learn-
ing material by analyzing if an improvement of the
student’s academic performance has occurred. In de-
tail, implying the use of the same learning mate-
rial (LM) for the whole set of tests performed by a
learner (l), a new indicator called expected perfor-
mance, EP
LM
, is defined as EP
LM
=
1
L
∑
L
l=1
g
l
, where
g
l
is the average value of grades obtained by l as eval-
uations of exams involving the learning material LM.
Behavior: “How does the Learning Material
stimulate discussions?” A good assessment of a learn-
ing material can be evaluated by analyzing its index
of popularity. The idea is to measure how a mate-
rial becomes influential and stimulates the network of
learners. The popularity associated with a learning
material is the ability of being accepted, shared, to
provide solutions for a large number of users, and in
practice to be a stimulus for their interest. The popu-
larity factor that we defined is focused on an explicit
approach where several indicators come into play. In
fact, an explicit judgement is defined by: (1) social
evaluation, such as the classic liking/not-liking ap-
proach, (2) posts, i.e. the textual information writ-
ten by the users (e.g., teacher, learners), such as com-
ments, questions/answers, and (3) hashtags used to
classify posts on discussions related to specific topics.
At this level, a great number of explicit actions can be
taken into account (Dominoni et al., 2010). Accord-
ing to these purposes the quality of a post considers:
(1) learner’s expertise by analyzing the academic level
of the author that is givenby the EP
LM
(l) value (based
on the restricted population), and (2) significance of
the learning material by the index of understanding
that is a social indicator of how learners perceive tex-
tual fragments according to their skills e.g., a defini-
tion of a social traffic light where users can indicate
with the green (a solution of a problem is present),
yellow (associated with neutral comments) and red
colors (connected to a part of a text which is difficult
or even wrong). We assign the following points to the
light: 1 for green, 0 for yellow and -1 for red. Also
teachers can add comments on the material to help the
students when there is a problematic point (e.g., a dis-
cussion with many red lights). However, the teacher’s
comments are not taken into account in the evaluation
of the popularity. Finally, the popularity P( f) of a
given fragment f is P( f) =
1
N
∑
N
k=1
U(k, f), where N
is the total number of posts related to a given learn-
ing unit of the material, U(k, f) is the value of un-
derstanding (via the traffic light) in the k-th post to
the fragment f. For example, let us consider 5 posts
associated with the 4th fragment. After the selec-
tion of the traffic light social grade, each post is de-
fined as red (U(1,4) = −1), yellow (U(2,4) = 0),
red (U(3, 4) = −1), green (U(4, 4) = +1) and yel-
low (U(5,4) = 0); thus, the index of understanding
of fragment 4 is: P(4) = −1. This value implies that
the material is difficult to understand.
Since we consider a material as a union of its
fragments, it is meaningful to combine the popu-
larity of the different fragments by adding them as
P =
∑
F
f=1
P( f), where the index f runs on all the
F fragments. The quantity P can assume values in
the range [−F,F]. In order to compare the popular-
ity with the other indicators, it is meaningful to use a
linear re-parametrization P
LM
=
3P
2F
+
3
2
, where the re-
sulting indicator P
LM
has the same meaning of P but
it is in the range [0,3].
Results: “Did the Learning Material help learners
to grow globally?” This is a statement which encloses
whether there has been a global academic growth due
to the usage of the learning material (with the help of
the Social LMS). The data obtained from the Learn-
DATA 2016 - 5th International Conference on Data Management Technologies and Applications
166

ing and Behavior indicators are combined in this level
to describe the academic path of the learner. The eval-
uation is a mush-up of data collected ranging from
formal evaluations (e.g., tests, grades, etc.) to infor-
mal evaluations (e.g., social evaluations, judgement
of peers, etc.). It can be useful to consider a com-
parison between the growth and a journey, where the
academic result (learning) is related to the position
within the path, while the attitude of the learner and
his/her disposition to grow and interact (behavior) is
similar to the velocity at the point. This second at-
tribute is a potential quantity which can allow to pre-
dict the development of the person. The indicator for
the results is thus G
LM
= αEP
LM
+(1− α)P
LM
, where
0 ≤ α ≤ 1. When α has a value of 0, the expected
performance value, EP
LM
, is not considered, and the
final weight is equivalent to the weight obtained by
analyzing the popularity value, P
LM
. If α has a value
of 1, the popularity value is ignored and only the ex-
pected performance value is considered. The impor-
tance of popularity value with respect to expected per-
formance value can be balanced by varying the value
of parameter α.
ROI: “Did the use in Learning Material provide
a positive return on scholastic effort?” In an educa-
tional context, we define the ROI
LM
in order to eval-
uate whether the effort required by the learning ma-
terial was worth the results obtained. The ROI
LM
is
calculated as:
ROI
LM
=
G
LM
− D
LM
D
LM
× 100
This quantity gives the percentage gain due to the ma-
terial once the difficulty cost has been taken into ac-
count. The gain is calculated with the Results indica-
tor, while we associate the cost with the difficulty of
the material (see the Behavior level).
3 MODELLING THE LEARNING
MATERIAL
In order to clarify the framework proposed, we show
examples of the possible appearence of a wall and of
a knowledge graph. For a given class, the aim is to es-
tablish an inter-correlation among the structure of the
course, the learning material and the network of learn-
ers and teachers. In particular, it is rather widespread
the use of syllabuses which contain a detailed descrip-
tion of the structure of the course, the material to
be used, and the relevant information related to the
course (e.g., teacher’s contacts). This work proposes
a social definition of the syllabus as a new add-on
for the Social LMS; the idea is to use/define a syl-
labus and to model it as a social wall. In a social
environment (like Facebook) the wall is the location
where people post pictures, add material, comments
and in general share information. In a wall these
forms of interaction are usually displayed on prior-
ity basis, where recent discussions have a higher pri-
ority and thus, are displayed at the top, while older
ones are in the lower part of the wall. For this reason,
there is a limited topic grouping of the discussions
and it becomes more difficult to navigate information
which belongs to a “learning unit”. Instead, the use of
a wall derived from the syllabus of the course can: (1)
help in gaining a more structured observation of the
subjective appreciation of the learning material by the
students, (2) allow to collect objective information,
and (3) ease the interaction with the material itself.
These can be achieved by framing the wall of the So-
cial LMS to the syllabus and associate it to chapters
and sections of the textbook related to the units.
3.1 A Learning Material Centered Wall
The creation of a syllabus is already part of the re-
sponsibilities of a teacher, thus the definition of the
outline of the wall is not expected to require a major
increase of workload. At the contrary, the creation in-
terface of a wall can ease the teacher’s work by divid-
ing the units and adding connections among them. In
this way, students can understand the relations which
link different parts of the course instead of focusing
only on the present unit. Let us consider a literature
course about British poets, where unit 6 is devoted to
the poets of the 15th century and unit 7 is about the
ones of the 16th century. Let us also suppose that the
knowledge of the ones of the 15th century is neces-
sary for a better understanding of the ones of the 16th
century. In this case, the teacher would make a con-
nection between unit 6 and unit 7. The connections
which are created among units can go beyond a single
course and can help in creating inter-cultural learning
networks. This allows a teacher to create links from
his/her own wall to the walls of different subjects, for
example by forming a link from the the unit devoted
to the British poets of the 16th century of the litera-
ture wall to the History wall and the unit devoted to
the 16th century.
The creation of a wall is simplified with a user
friendly interface that allows to model the content
structure of the learning unit in the form of Venn di-
agrams. The syllabus/wall becomes an active map
between the students and the material itself. Once
all the units have been created a teacher should dy-
namically add (directional) links between them. The
network formed can be considered as a “knowledge
graph” where the units are the nodes and the links
Social Evaluation of Learning Material
167
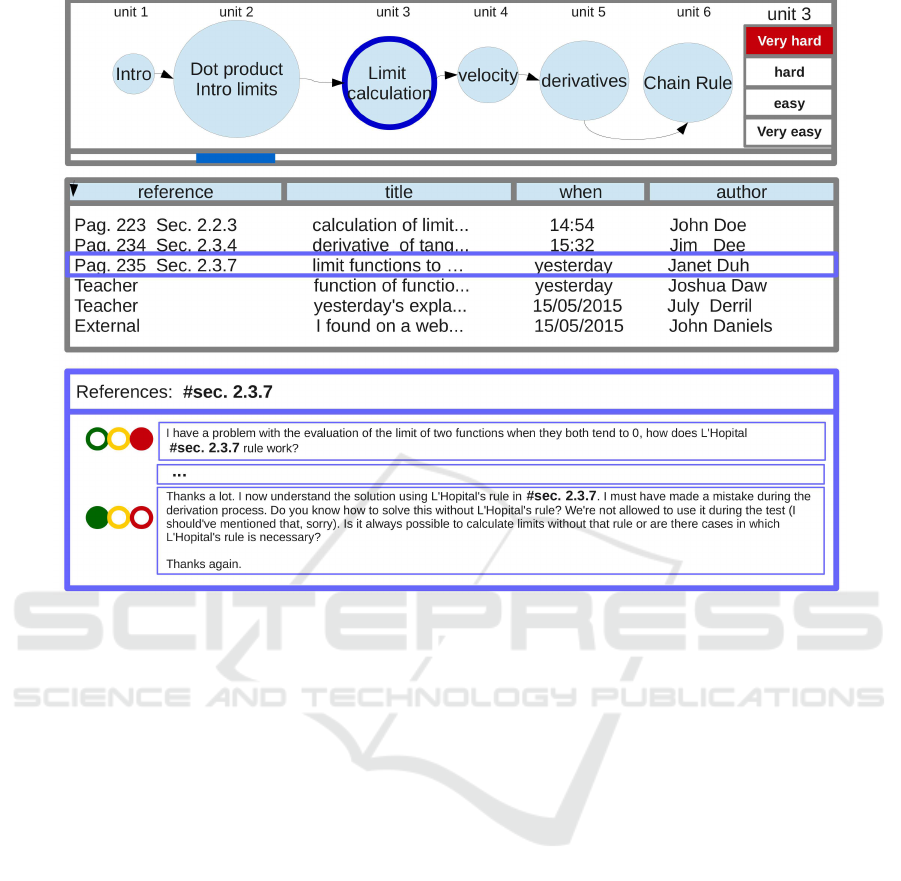
Figure 2: Wall: a portion of its concept design.
represent the connection between them. This knowl-
edge graph visually returns the correlations between
the topics and acts as a general learning map for both
students and teachers.
3.1.1 The Social Wall and the KP Model
This section presents how the indicators of Section 2
can assess the information within a social wall.
Reaction: the difficulty level is openly expressed
by the learners when they interact with the wall. In
fact, the unit guides are shown to the users in the form
of a knowledge graph representation. A learner can
select each unit guide to indicate his/her subjective
level of difficulty. In the example of Figure 2, the
Unit 3 is selected and the judgement very hard has
been assigned to it.
Learning: the indicator which should be used has
to take into account the average quality of the student.
The approach presented in Section 2.1 allows to prune
the set of learners by maintaining only those students
which express difficulty judgements not too closely
related with their own quality level in order to con-
sider realistic (not-influenced) judgements.
Behaviour: the quantity expresses how much the
material leverages a change in the students behav-
ior during their academic path. An important role is
played by the hashtag system associated with the dis-
cussions in the wall. The idea is that hashtags are used
to relate the questions and answers (and/or comments)
to sections and subsections of the learning material.
In order to incentivize a correct usage of the hashtags,
the concept of gamification could play an important
role. We proposea reward system such that the more a
student posts one the wall the more points he/she gets
as a reward/badge (gamification of the wall). By co-
ordinating with the teacher, certain amounts of points
can give rise to points awarded for the final grades. A
strict constraint of the message writing window is the
need of (at least one) hashtag reference to the sources
utilized for the question or the answers. Posts are ac-
cepted for publication only in the case the reference
has been added.
Another key element is the social traffic light de-
fined in Section 2 associated with posts, where a red
light signals a problem in that post or a green light
means that the section contains good information or
the solution of the problem (yellow is left for the com-
ments). This quality light contains the level of the stu-
dent’s satisfaction about the current understanding of
the topic. Let us suppose that a person asks a ques-
tion about literature and Shakespeare; at the end of
the question, he/she has to insert the page number or
DATA 2016 - 5th International Conference on Data Management Technologies and Applications
168

the section of the textbook where this question is ad-
dressed. For example, Figure 2 shows an example of
discussion related to the topic on page 235 for Sec-
tion 2.3.7 of a fictional math wall. A learner posted a
question marked with red light, and after a thread of
messages, the same learner posted a message to thank
for getting an answer to him/her question by marking
with a green light.
This questions/answers/comments production di-
rectly related with the material can be considered as
the main part associated with the behavior of the KP
model. In fact this is a change of behavior which is
strongly correlated with the material itself. The pos-
sibility to tag other sources (including the teacher)
helps to disentangle whether the question is more re-
lated with the topic or other factors.
Results: the key performance indicator is an ag-
gregation of the quantity values calculated in the pre-
vious KP’s levels (see Section 2).
ROI: In order to gain a better insight of the devel-
opment, all the subjects will be given analytical tools
in the form of dashboards providing important infor-
mation and automatic analysis (Buckingham Shum
and Ferguson, 2012; Siemens and Baker, 2012). The
information provided is not to be intended as a re-
placement of the specific capabilities of the teachers,
but it is thought as a further tool to have a good un-
derstanding of the success or failure of their initiatives
for improving the quality of their materials.
4 CONCLUSIONS
The evaluation of a learning material is a complex
task; there are many difficulties associated with this
task which can be grouped in two main categories:
(1) the great variety of material (textbooks, slides, syl-
labi, handouts, etc.), and (2) the fact that the learning
process is related to the interaction among teachers
and students and the material itself. This paper has
presented a revised definition of the KP model with
the intent to assess the quality of the material within
a Social LMS. To this goal, we introduced some new
key performance indicators associated with both sub-
jective (e.g., social data), and objective aspects (e.g.,
grades). The newly proposed steps of the KP model
include: the difficulties found by the learners in ap-
proaching the material, the increased performances
due to the material, how much has been produced
about the material, and a final assessment on the re-
sults. At the end, the final evaluation (ROI) takes into
account if the improved results due to the material are
worth the difficulties in its usage. As an example, we
proposed how to instance the material evaluation pro-
cedure with a modified version of a wall structured
on the syllabus of a course. Our wall is a dynamic ob-
ject where the topics of a course are graphically repre-
sented as a knowledge graph to provide an immediate
logical connections between the arguments.
In future works, we are planning to investigate
new applications of the wall. Normally a class journal
is kept during the year, where one can find the daily
work of the class (teaching of the day, whether a test
has been performed, etc.). The journal’s activities can
be structured by the proposed wall. This triggers a
timing of the unit itself which can be used later in or-
der to consider a realistic workload for the students
and compare it with the expected one.
REFERENCES
Buckingham Shum, S. and Ferguson, R. (2012). Social
learning analytics. Ed. Tech. & Society.
Claypool, M., Brown, D., Le, P., and Waseda, M. (2001).
Inferring user interest. IEEE Internet Computing,
5:32–39.
Dominoni, M., Pinardi, S., and Riva, G. (2010). Omega
network: An adaptive approach to social learning. In
10th Inter. Conference on Intelligent Systems Design
and Applications, ISDA 2010, November 29 - Decem-
ber 1, 2010, Cairo, Egypt, pages 953–958. IEEE.
Guerin, J. T. and Michler, D. (2011). Analysis of under-
graduate teaching evaluations in computer science. In
Proceedings of the 42Nd ACM Technical Symposium
on Computer Science Education, SIGCSE ’11, pages
679–684, New York, NY, USA. ACM.
Kirkpatrick, D. L. and Kirkpatrick, J. D. (2010).
Evaluating training programs : the four levels.
ReadHowYouWant.com ; Berrett-Koehler Publishers,
[Sydney, NSW, Australia]; San Francisco, CA.
Larsson, E., Amirijoo, M., Karlsson, D., and Eles, P. I.
(2007). What Impacts Course Evaluation?
Newstrom, J. W. (1995). Evaluating training programs: The
four levels, by donald l. kirkpatrick. (1994). Human
Resource Development Quarterly, 6(3):317–320.
Osguthorpe, R. T. and Graham, C. R. (2003). Blended
learning environments: Definitions and directions.
Quarterly Review of Distance Education, 4(3):227–
233.
Phillips, J. J. and Phillips, P. P. (2003). Using action plans to
measure roi. Performance Improvement, 42(1):24–33.
Siemens, G. and Baker, R. S. J. d. (2012). Learning ana-
lytics and educational data mining: Towards commu-
nication and collaboration. In Proceedings of the 2Nd
International Conference on Learning Analytics and
Knowledge, LAK ’12, pages 252–254, New York, NY,
USA. ACM.
Tour´e, F., A¨ımeur, E., and Dalkir, K. (2014). AM2O - An
Efficient Approach for Managing Training in Enter-
prise. In Proceedings of the International Conference
on Knowledge Management and Information Sharing,
pages 405–412.
Social Evaluation of Learning Material
169
