
Tactile Display Design for Securing Flight and Reducing the Saturation
of Pilot’s Visual Channel
Khaled Fellah and Mohamed Guiatni
Control Laboratory, Ecole Militaire Polytechnique, Bordj El Bahri, Algiers, Algeria
Keywords:
Tactile Feedback, Fuzzy Logic Controller (FLC), Pilot’s Visual Channel Satuation, Inverse Dynamic, Flight
Simulation, Xplane, Tactors.
Abstract:
Visual channel dominates the design of the cockpit, and auditory channel is progressively being used as well.
However, tactile displays are almost abstract in the cockpit designs. Whereas, many research proved that
several applications exist where the tactile displays may become an important or even essential choice. This is
due to the fact that the visual feedback is not suitable, not adequate, or surcharged and that the visual attention
is usually limited to a simple entity. In this paper, we propose a design of a low-cost tactile feedback system
to provide the pilot with better insight in the flight path and prevent limitations during flight. In the first part
of the paper, we develop an effective control strategy based on inverse dynamic to solve the problems of use
of the low-cost tactors. The obtained results showed reduction of 48 % in settling time. The second part
describes the use of Fuzzy Logic Controllers (FLC) to compute a new form of tactile output of the translation
of a pertinent flight data information and flight envelope to vibrotactile feedback signals. And in the last part,
we develop a wireless (and USB) vibrotactile feedback device consisting of 16 embedded tactors controlled
with an inverse dynamic strategy via an arm Cortex M3 architecture. Pilots equipped with the developed tactile
display were capable of successfully flying in a simulator. They confirm that tactile feedback is an interesting
way of feeding back information about the airplane’s state, in order to give a better understanding of what the
airplane is doing during controlled flight.
1 INTRODUCTION
The human vision is a very convenient channel for
processing large amounts of data because our brain
receives around 80% of all information from visual
cues (Rosenblum, 2011). However, a pilot interacts
with the modern cockpit displays through cursor con-
trol devices (CCD) or multi-function displays (MFD),
and the total quantity of information which is at the
disposal of pilot is offered mainly in a visual format
(Thomas et al., 2015). The problems which the de-
velopers of the human-machine interfaces encounter
in the modernization of the new cockpits are primar-
ily caused by the limit of the capacities of the pi-
lots to process the information related to the data of
flight (Van Veen and Van Erp, 2001). In addition, the
excess of visual information channel can cause fatal
accidents if a pilot cannot analyze or perceive stim-
uli at the right time (Petit, 2013). This menace of
sensory overload makes the designers of cockpit pro-
gressively apply multimodal interfaces (Lloyd et al.,
2003). Traditionally, the auditory display is consid-
ered as an alternative or complementary to visual dis-
plays. However, the visual and auditory channels of a
pilot are sometimes strongly loaded, degraded or not
available (Van Erp and Self, 2008). Several research
tasks to integrate tactile display applications, in order
to provide countermeasures of the spatial disorienta-
tion (SD) and solutions to the threats of the sensory
and/or cognitive overload (Self et al., 2008). Appli-
cation of the touch screens in the cockpits of different
types of aircraft got much attention. In 2015, Salzer
et al. (Salzer and Oron-Gilad, 2015) designed a tac-
tile feedback system display on-thigh part in a cock-
pit to improve flight safety by improving the situa-
tional awareness of helicopter pilots and reducing the
collisions probabilities. Schmidt-Skipiol (Schmidt-
Skipiol, 2015) presented a new concept of the use
of tactile feedback with Flight Envelope Protection.
Coalition Warfare Program (CWP) (Lawson and Ru-
pert, 2014) developed a Tactile Situation Awareness
System (TSAS) on-torso in UH-60 Black Hawk. The
results showed that landing performance in degraded
visual environments was significantly improved when
ground speed and altitude were presented on a tac-
tile display (Jansen et al., 2008). Nojima et al. (No-
362
Fellah, K. and Guiatni, M.
Tactile Display Design for Securing Flight and Reducing the Saturation of Pilot’s Visual Channel.
DOI: 10.5220/0005984303620373
In Proceedings of the 13th International Conference on Informatics in Control, Automation and Robotics (ICINCO 2016) - Volume 1, pages 362-373
ISBN: 978-989-758-198-4
Copyright
c
2016 by SCITEPRESS – Science and Technology Publications, Lda. All rights reserved

jima and Funabiki, 2005) developed a tactile display
system consisting of 6x4 pin-array tactors placed on
an aircraft control side-stick to inform a pilot about
altitude and vertical speed and increase situational
awareness during flight path. VanErp et al. (Van Erp
et al., 2005) examined the possibility to present the
helicopter navigation information on a belt tactile dis-
play, including the translation of distance to vibration
rhythm and the direction to vibration location. Mc-
Grath (McGrath, 2000) used a tactile display of 12
tractors to demonstrate that it is possible to manually
fly an airplane (T34-C) without visual instruments
and outside view by feeding back the pitch and the
bank angle simultaneously to the pilot. In this study,
we aim to design a vibrotactile display to provide a
current optimal state of the aircraft to the pilot and
display the warning signal about a limitation of the
flight envelope, flight path climb, pitch or bank angles
limitations. A new approach is adopted by exploiting
the results of the work of McGrath (McGrath, 2000)
with the use of a low cost tactors. In this study, we
aimed at finding quantitative and qualitative perfor-
mance differences while combining a low cost tactile
system with the flight envelope generating an artificial
stress situation.
2 VIBROTACTILE DISPLAY
DESIGN
2.1 Vibrotactile Actuators
Devices that are used to stimulate the human skin
in embedded tactile display communication systems
must create a range of sensations which vary ac-
cording to the intensity, duration of stimulation, lo-
cus of stimulation, frequency and waveforms (Jones
and Sarter, 2008). Other important engineering con-
siderations factors generally include weight, shape,
size, power consumption, cost, durability, reliabil-
ity, availability, and wearability (Jones and Sarter,
2008). Two types of actuators are commonly used
for tactile stimulation, electrotactile and vibrotactile,
which are distinguished on the basis of the mecha-
nism used to stimulate the human skin (Jones and
Sarter, 2008). Electrotactile actuators stimulate the
human skin by passing a current through surface elec-
trodes. Vibrotactile actuators stimulate the skin by
converting electrical energy into a mechanical dis-
placement. Vibrotactile stimulation can be divided
into four broad classes, piezo-actuators, Shape mem-
ory alloy (SMA), linear resonant actuators (LRAs) or
eccentric rotating masses (ERMs) could be utilized
(Van Erp et al., 2005). Tactors type ERM actuators are
compact and lightweight, and have a larger bandwidth
than LRA actuators. Moreover, coin LRA actuators
vibrate in the axial direction (i.e. normal to the coin
surface) whereas coin type ERM actuators produce
radial vibrations (Renwick, 2008). Brown and Kaare-
soja (Brown and Kaaresoja, 2006) compared the ERM
to the C2 tactors by varying the rhythm and intensity
of the vibration. They found that the overall vibro-
tactile signal recognition of human study participants
using an ERM actuator was nearly identical to the par-
ticipants signal recognition using a C2 tactor (Choi
and Kuchenbecker, 2013). This result is promising,
as it suggests that the pager motors may provide the
same performance in terms of recognizing and iden-
tifying vibratory signals as much more expensive tac-
tors. Therefore, we have chosen the 308-102 tactors,
manufactured by Precision Microdrives. These are
ERM actuators which offer peak amplitude of 5.5G,
with a body diameter of 8mm, and they cost less than
20 $. However, this type of actuators presents a de-
lay of few hundred milliseconds (Choi and Kuchen-
becker, 2013). In order to overcome this problem, we
have developed a inverse dynamics based controller
with friction compensation.
2.2 System Design and Discussion
The developed tactile feedback system consists of 16
tactors placed in defined position in the skin, and a
control device containing a FLC for the conversion of
the flight data into tactile signal. Another controller
base on dynamic inverse to modify the dynamics of
the tactors to use them in the prevention from the pi-
lotes capacities degradation.
To study and analyze the developed tactile system,
a platform of tests is proposed. This tests must be
near as possible as to the real conditions. For that,
we implement the Hardware-in-the-Loop-Simulation
(HILS) including a developed tactile display system,
aircraft dynamic model and X-plane.
The model of an aircraft is implemented in Mat-
lab/ Simulink. A series of tests on X-plane environ-
ment is performed to see the behavior of the devel-
oped model in different flight situations. As an ex-
periment we sent the measured geodetic latitude, lon-
gitude and altitude inputs from the model to flight
control surfaces of an aircraft in the X-Plane envi-
ronment. The tactile display system recieved the cal-
culated flight envelope limit, flight path climb, pitch,
bank and turn rate angles and translated it into effec-
tive vibrotactile signal. Through this HIL simulation,
the tactile display system can be tested on real aircraft
minimizing risks.
Tactile Display Design for Securing Flight and Reducing the Saturation of Pilot’s Visual Channel
363
2.3 Hardware-in-the-Loop Simulation
The main components of the Design of the hardware-
in-the-loop simulation structure is :
• Aircraft Dynamics.
• Flight Simulator X-Plane application.
• Tactile display hardware and software system.
The pilot commands the aircraft surface in the X-
plane environment by introducing inputs form the
stick to the aircraft model. The flight simulator X-
Plane application is used as a visualization of the air-
craft movement. Thus, the objective is to establish
the communication between aircraft model, X-Plane
and tactile display system to visualize movement of
plane and encode the flight data and warning signal
into tactile signal. The aircraft model calculates po-
sition, flight envelope, flight path climb and turn rate
angles according to the pilot’s inputs. Tactile display
hardware system communicates with computer that
contains Aircraft dynamics block using USB commu-
nication or XBEE interface, while the communication
between Aircraft dynamics block and Flight Simula-
tor X-Plane application is the standard protocol UDP
(User Datagram Protocol).
2.4 Flight Simulation Software:
X-Plane
X-Plane offers the most realistic flight model that can
be used to predict the flying qualities of 30 aircraft
in the default installation with incredible accuracy.
X-Plane is not a game, but it’s an engineering tool
and has the ability to send and receive flight data
via User Datagram Protocol (UDP) communication.
These parameters are sent by the Matlab/Simulink air-
craft models in the IEEE754 format. The data needed
by X-plane to visualize the movement of an aircraft
in the hardware simulation is in fact the position data
of the aircraft (longitude, latitude, altitude) and the
attitude of aircraft (roll angle, pitch angle, and yaw
angle).
The triple of states that can be sent to describe
the position of an aircraft in X-plane application are
geodetic latitude µ, the geodetic longitude λ and the
geodetic height h with respect to the ECEF-Frame and
given by equation (1).
˙
λ
˙µ
˙
h
E
O
=
(V
G
K
)
E
K
sinχ
G
K
cosγ
G
K
(N
µ
+(h)
E
0
)cos(µ)
E
0
(V
G
K
)
E
K
cosχ
G
K
cosγ
G
K
M
µ
+(h)
E
0
(V
G
K
)
E
K
sinγ
G
K
(1)
Where
N
µ
=
a
q
1 − e
2
sin
2
(µ)
E
0
M
mu
=
1 − e
2
1 − e
2
sin
2
(µ)
E
0
(2)
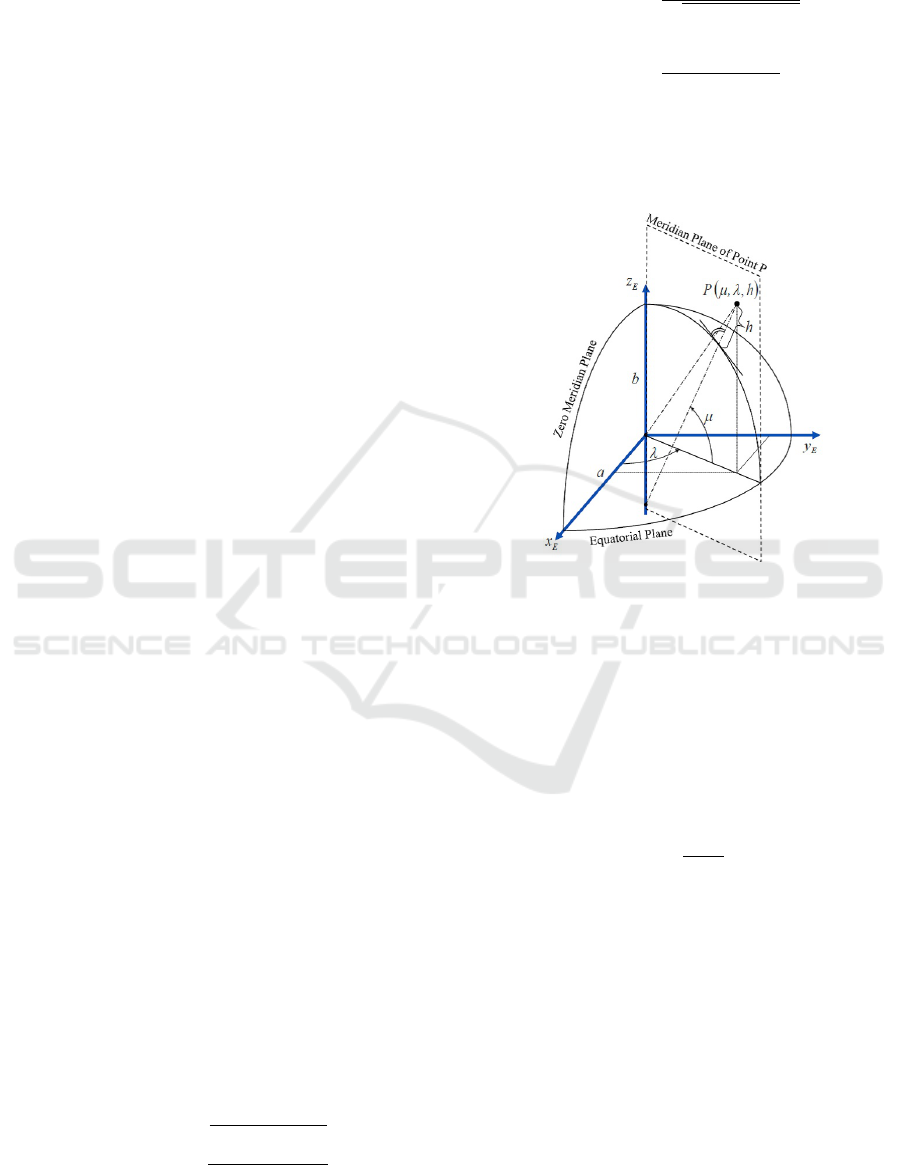
The position of a point in space is specified according
to the World Geodetic System WGS84 (Fig.1) utiliz-
ing two angles and the altitude.
Figure 1: Geodetic system WGS84.
The radius of curvature in the prime vertical Nµ
and the meridian radius of curvature Mµ are computed
from the semi-major axis length a of the reference el-
lipsoid and the first eccentricity e, where the first ec-
centricity e has to be calculated from the flattening f :
e
2
= 2 f − f
2
The flattening f is defined as:
f =
a − b
a
2.5 Tactile Display System Inputs
The Results of (McGrath, 2000) showed that roll and
pitch information could be provided by tactile cues
via an array of tactors placed in belt which is incorpo-
rated into a torso harness. Which means that banking
to the left is displayed on a column of tactors on the
left side of the torso and vice versa. A display flight
paths going down on the abdomen and flight paths go-
ing up on the back, to have a clear distinction between
going down and up.
But in reality the pilot did not need to perceive
the pitch and bank angles during the flight. On the
ICINCO 2016 - 13th International Conference on Informatics in Control, Automation and Robotics
364
other hand, the turn rate and the flight path climb an-
gles are two very important informations for the pi-
lot. For more details we suggestd to change the hori-
zontal feedback from feeding back the bank angle to
feeding back the turn rate angle to give a better sen-
sation of whether the aircraft was veering to the right
direction or not (which is not always directly related
to the banking angle). And the vertical feedback was
changed from feeding back the pitch angle to feed-
ing back the flight-path inclination angle. This is less
complex and might be easier to understand. These
two variables take into account the aircraft’s flight en-
velope and the optimal recommendation to prevent
and avoid the crash plane.
This implementation would require two columns
of tactors to display the vertical direction: one on the
abdomen and one on the back, and two columns of
tactors on each side of the torso to display the hori-
zontal flight path changes.
For the acquisition of the flight-path inclination
angle and the turn rate angle we use the aircraft model
implemented in Matlab/Simulink environment.
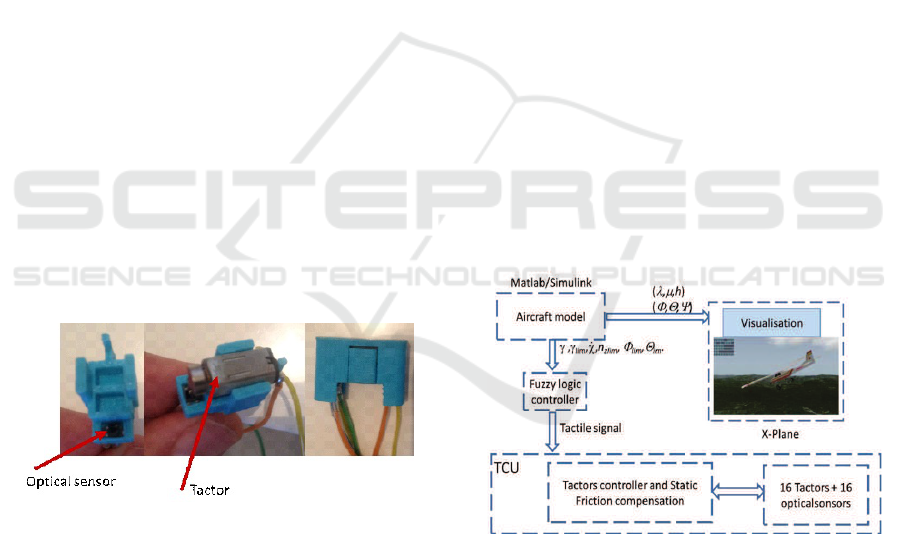
2.6 Design of the Tactile Display System
We have developed a tactile display system consisting
of 16 vibrating elements (tactors). We used 4 columns
of 4 tactors. Each tactor is placed in the box devel-
oped by a 3D printer and designed in the Institute of
Flight System Dynamics(FSD)/ Technical University
Munich of Germany (Fig.2).
Figure 2: Box of tactor.
The turn rate and the flight path climb angles were
encoded using a combination of column selection.
For instance, when turn rate left, the column of tactors
on the left side of the torso was selected as the load
factor was not reached and the bank angle was not in
the boundary zone. We follow the same approach and
display flight paths going down on the abdomen and
flight paths going up to the back, to have a clear dis-
tinction between going down and up to avoid confu-
sion the horizon was displayed on the same side as the
flight path climb angle. When the airplane was flying
level (flight path climb angle equals zero), the flight
path climb angle and the horizon were displayed on
both sides, the abdomen and the back. Also the tactor
location was used to encode the information for turn
rate or flight path climb angle. The range for the hori-
zontal feedback (turn rate) was set to [-6.0, -4.0, -2.0,
-0.7, 0.7, 2.0, 4.0, 6.0] degrees per second. For the
vertical (flight path climb angle) it was set to [-7.0, -
5.0, -3.0, -0.7, 0.7, 3.0, 5.0, 7.0] degrees. We add with
these two flight data, turn rate and flight path climb
angle, the flight envelope, pitch, flight path climb and
bank angles limits to generate a warning signal wich
warns the pilot of any wrong control. For that, we im-
plemented a fuzyy logic controller block that gener-
ates the warning signal or the display of turn rate and
flight path climb angles using the following logic.
As long as the limits on the flight envelope, pitch,
bank or flight path climb angles are not reached we
display the turn rate and the flight path climb an-
gles with the recomanded frequency. If the limit of
the flight path or pitch angles is reached we activate
the eight tactors on the horizontal feedback and if the
limit of the bank angle is reached we activate the other
eight tactors on the vertical feedback. The limit of the
flight envelope involves the activation of all the six-
teen tactors with specific frequency.
The used flight data, turn rate, flight path climb,
pitch, bank angles and flight envelope must be con-
verted into tactile signals ie intensity and location on
the skin by using the fuzzy logic controller (Fig.3).
Figure 3: Design of the tactile display system.
As shown in Fig.4 and Fig.5, an ARM Cortex M3
microcontroller forms the core of the Tactile Control
Unit (TCU). The modified speed controller imple-
mented on the microcontroller is used for amplitude
control, temporal rhythm generation and compensate
the static friction. Sixteen interruptions pins of the
ARM Cortex M3 are configured to read a frequency
of each tactors in the real time. All of the 16 tactors
listen to the main controller for specific commands
on the amplitude and the timing of vibration through
Tactile Display Design for Securing Flight and Reducing the Saturation of Pilot’s Visual Channel
365
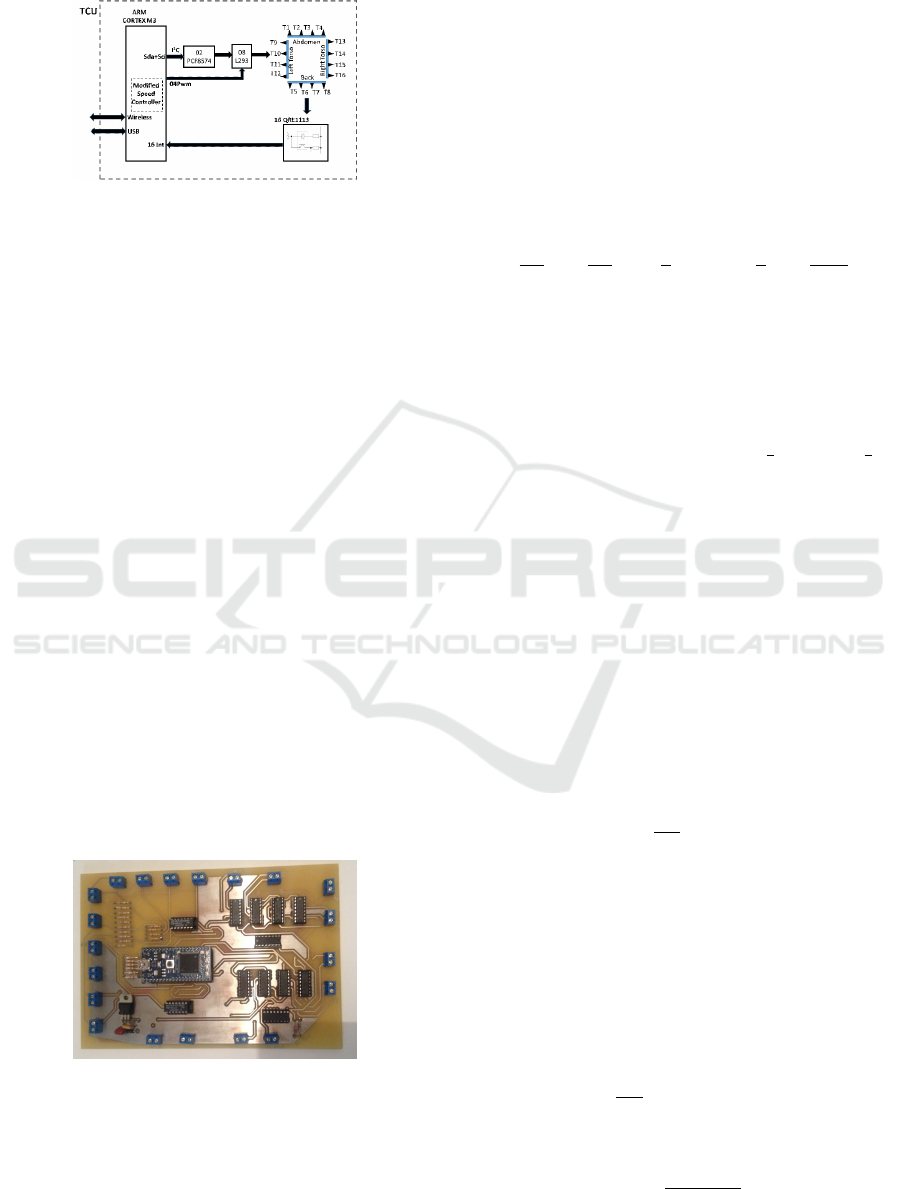
the I2C bus. The spatial coordinates of a stimulus
Figure 4: Tactile controller unit schematic.
applied to the skin are accurately represented in the
central nervous system, and so it has been proposed
that spatial information about the external world may
be communicated via tactile stimulation of the skin
(Van Veen and Van Erp, 2001). In general, the abil-
ity to localize a point of vibrotactile stimulation on
the body is best when it is presented near anatomi-
cal points of reference such as the wrist, elbow, spine,
or navel (Cholewiak et al., 2004). Cholewiak et al.
(Cholewiak et al., 2004) determined the number of
sites around the waist at which participants could ac-
curately localize vibrotactile stimulation. The tactile
array comprised a belt with 12 (intertactor spacing of
72 mm), 8 (spacing of 107 mm), or 6 (spacing of 140
mm) tactors equidistantly spaced. Localization ac-
curacy averaged 74% correct with 12 tactors, and it
improved to 92% with 8 tactors and to 97% when 6
tactors were used. In our case the tactors were af-
fixed to the band, with a 107 mm vertical spacing in
the torso, and spacing of 100 mm in the abdomen and
back. All communications from the fuzzy logic con-
troller or block logic are received through the IEEE
802.15.4 wireless module or USB by the ARM Cor-
tex M3. The data received are automatically used by
the modified speed controller to compensate the static
friction (Fig.5).
Figure 5: Tactile controller unit.
3 TACTILE CONTROLLER UNIT
DESIGN
3.1 Modeling, Parameters Identification
and Open Loop Experiments on
308-102 Tactors
Tactors are modelled as eccentric rotating mass actu-
tor with an imbalanced load fixed to the radial center
axe. The mathematical model of the vibration tactors
is given by (Vartholomeos and Papadopoulos, 2006):
¨
θ
t
=
K
T
JR
V
S
−
K
2
T
JR
˙
θ
t
− (
c
J
sign(
˙
θ) +
b
J
˙
θ) −
m
t
gr
J
sinθ
t
(3)
Where K
T
is the tactor’s torque constant, J is the
inertia of the eccentric load mass m
t
, R is the tactors
ohmic resistance, r is the length between the center of
the radial axis and the center of eccentric load mass.
the voltage, V
S
, is the input voltage to the actuator, and
the angle θ
t
is the angular position of the tactor with
respect to the radial axis. The term (
c
J
sign(
˙
θ
t
) +
b
J
˙
θ
t
)
is the coulomb and viscous friction.
Parameters identification is necessary for the sim-
ulation of a tactor dynamics and the design of the con-
troller strategies. Therefore, tactor parameters are de-
termined by recording a set of measurements. Never-
theless, an important constraint prevented from mea-
suring the angular positions by the use of the com-
mercial encoders due to the small dimensions of the
tactor. for that, an approach is adopted to overcom the
problem of measurement of the angular positions by
the implementation and design of an encoder.
The torque constant, K
T
is obtained by measuring
the steady state current i
ss
through the tactor and its
steady state rotational speed ω
ss
from the following
equation :
K
T
=
1
ω
ss
(V
S
− Ri
ss
) (4)
The coulomb friction reduces the torque applied by
the motor and is dependent on the direction of the ve-
locity. To obtain the coulomb friction we measure the
current i
s
necessary to start the tactor. The coulomb
friction coefficient c is :
c = i
s
K
T
(5)
The viscous friction coefficient b is obtained in the
steady state by :
b =
1
ω
ss
(i
ss
K
T
− csignω
ss
) (6)
Then, the total inertia of the tactor, J, is given by:
J =
τK
2
T
+ Rb
R
(7)
ICINCO 2016 - 13th International Conference on Informatics in Control, Automation and Robotics
366
Where, τ, is the time constant in the open loop re-
sponse of the equation (3). The identification of the
different parameters of the dynamic model were de-
termined as the average of ten series of experiment.
Figure 6 shows the open loop response of rota-
tional speed in simulation and real environement for
different values of input (2.9V-4V). We observe from
the responses of angular velocity in simulation and
real environement in Fig.6 that the model of tactor is
succefully identified. However, the time constant is
about 40 ms (for more precision see Fig.11). We no-
tice that this time constant is not suitable for the tac-
tile display applications which requires stimulation of
about 50 ms. In order to minimize the time constant
of the response of tactor a rotational speed controller
is designed and implemented in the ARM Cortex M3
microcontroller.
0 1 2 3
0
200
400
600
800
1000
Time (s)
Speed (rad/s)
Simulation
Real
Figure 6: Speed response for diffrent voltage input in open
looop.
3.2 Speed Controller Design
In this section we are interested to develop a design
controller strategie for the tactors to minimize the
time constant of the system. The use of batteries to
achieve the autonomy, impose restriction that the volt-
age input can not exceed 5V.
To this aim, the tactor is controlled using inverse
dynamics given by:
V
S
= (K
2
T
+ Rb)ω +Rm
t
gr sin(ω)+cRK
−1
T
+
JR
K
T
u
(8)
Where u is actuating signal incorporating in pro-
portional plus integral control:
u = K
p
(ω
re f
− ω) + K
I
Z
(ω
re f
− ω)dt (9)
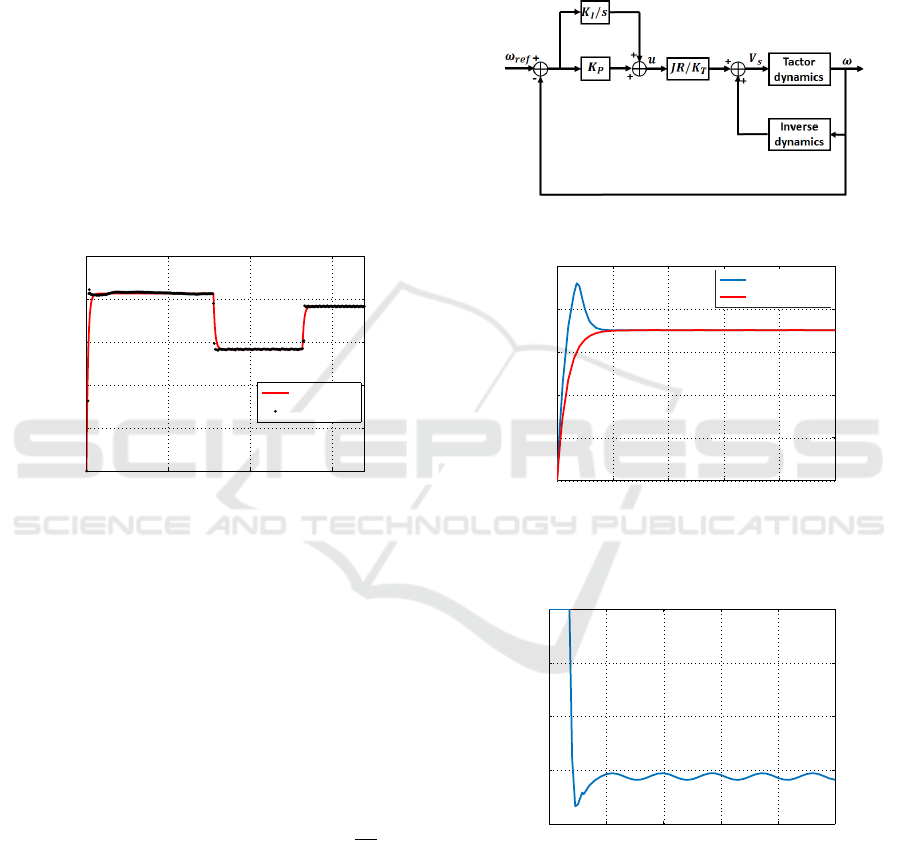
The controller is described in Fig.7. The inverse dy-
namics compensate the two non linear terms. The
K
p
, K
I
eliminate the permanent state error of the tac-
tor’s speed and result to a much faster response. Fig.8
shows the comparison between the open and closed
loop speed response for the desired value 700 rad/s. A
presence of overshoot is due to the closed loop zero,
and due to the limit power of the LiPo battery with
regulator (5V) while the controller requires more volt-
age (Fig.9). So, in order to overcome the problem of
overshoot we modify the strategie of controller.
Figure 7: Rotational speed controller design.
0 0.1 0.2 0.3 0.4 0.5
0
200
400
600
800
1000
Time (s)
Speed (rad/s)
Closed Loop
Open Loop
Figure 8: Closed and open loop simulation of speed re-
sponse.
0 0.1 0.2 0.3 0.4 0.5
3
3.5
4
4.5
5
Time (s)
Voltage (V)
Figure 9: Evolution of the input voltage in closed loop with
PI controller.
The modified controller speed is shown in Fig.10,
and the actuating signal u becomes:
u = −K
p
ω + K
I
Z
(ω
re f
− ω)dt (10)
The poles of the system designed in Fig.10 are placed
Tactile Display Design for Securing Flight and Reducing the Saturation of Pilot’s Visual Channel
367
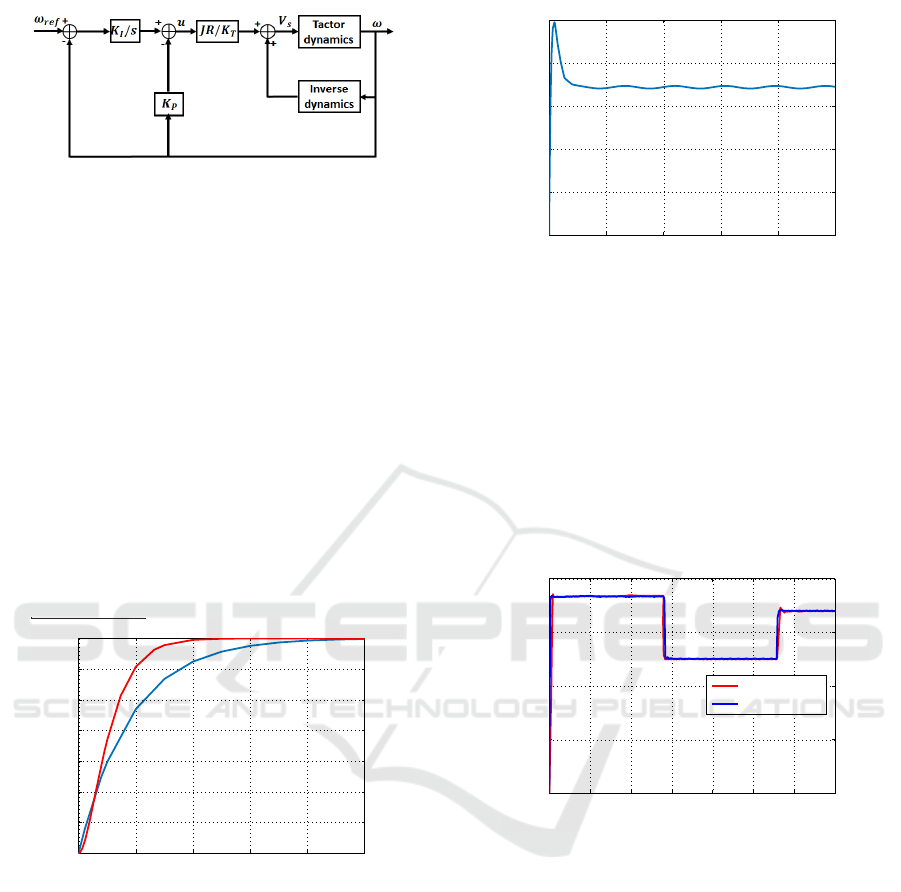
Figure 10: Modified speed controller design.
at the same point to avoid oscillations, ie the damp-
ing coefficient is equal to 1, and the settling time
t
s
= 4.7ω
n
. Where ω
n
is the natural frequency. The
gain parameters of the speed controller are K
p
= 354,
and K
I
= 31343 by choosing a desired settling time
as 26.44ms under the constraint of the limit voltage
of the battery (Lipo + regulator 5v).
Figure 11 shows the response of angular speed
of closed loop of the modified speed controller (red
line) and open loop simulation (blue line) for a de-
sired speed 700 rad/s. We obtain a reduction of 48%
in settling time, ie time constant is equal to 20.8ms.
In addition, there is no overshoot in the closed loop
modified controller response. Fig.12 shows that the
input voltage in the modified controller is under 5V
and no saturation is detected during its evolution.
0 0.02 0.04 0.06 0.08 0.1
0
100
200
300
400
500
600
700
Time (s)
Speed (rad/s)
Figure 11: Zoomed modified speed controller and open
loop simulation of speed response.
The modified controller is implemented in the
ARM CORTEX M3 microcontroller. Eight (08) L293
quadruple half-H drivers was used to drive sixteen
tactors. Pulsed Width Modulation (PWM) with the
modified speed controller strategie were applied to
control the angular speed of the tactors. To measure
the rotational speed, a very low cost opto-reflective
sensor QRE1113 was used for each tactor. However,
the output signal of the opto-reflective sensor is filtred
with a shmitt trigger HEF40106BP.
For the experimental procedure, we applied the
modified controller presented in equation 9, omitting
the term containing the angle of rotation, θ . During
0 0.1 0.2 0.3 0.4 0.5
0
1
2
3
4
5
Time (s)
Voltage (V)
Figure 12: Evolution of the input voltage in modified con-
troller.
the practice it was necessary to use the developed op-
tical encoder QRE1113 as explained in the previous
section.
Figure13 shows the response of the real and simu-
lation speed of the tactor for the closed loop with the
modified controller. We observe that the steady state
error is less than 3% and the time constant is 20.8
ms. The diagram of the developed tactile system is
0 0.5 1 1.5 2 2.5 3 3.5
0
200
400
600
800
Time (s)
Speed (rad/s)
Open Loop
Closed Loop
Figure 13: Real and simulation speed response of the mod-
ified controller for different voltage inputs.
divided into two parts. The first is the software unit
composed of fuzzy logic controller wich is used to
transform the flight data to tactile signals. The second
part is the hardware unit which consist in reducing the
time constant to adapt the low cost tactor to the tactile
display applications and control the tactors according
the transmitted flight data.
4 EXPERIMENTAL EVALUATION
4.1 Flight Data Constraints
Flight data constraints are used to check the limits of
the flight envelope, pitch, bank or the flight path climb
ICINCO 2016 - 13th International Conference on Informatics in Control, Automation and Robotics
368

angles and activate the embedded tactile display sys-
tem in the real time.
Most operating limitations can be translated to
limits other parameters. Enforcing the speed limits
can be impossible if the pilot has full authority over
the vertical motion of an aircraft. In this case only
the throttle could be used by the flight control system
for speed protection purposes. This is evidently no
sufficient for an effective protection when aircraft is
in steep climb or descent. Hence, it makes sence to
translate the speed limits to the flight path climb an-
gle limits. Equation ((11)) shows how the speed rate
is related to the flight path climb angle.
˙
V
k
= g(n
x
)
k
− g sinγ
k
(11)
The speed rate can be limited depending on the cur-
rent indicated airspeed and the limit indicated air-
speed ; as in equation (12) with a constant k (Zhang
et al., 2014).
˙
V
lim
= k(V
lim
−V
k
) (12)
By simple rewriting of equation (12), the upper and
lower limits on the flight path climb angle can be writ-
ten as in equations (13) and (14).
γ
lim,U
= arcsin((n
x
)
k
−
k(V
lim,U
−V
k
)
g
) (13)
γ
lim,L
= arcsin((n
x
)
k
−
k(V
lim,L
−V
k
)
g
) (14)
Where V
lim,U
is the never exceed speed V
NE
and V
lim,L
is the stall speed V
stall
(Fisch et al., 2012). The bank
angle limitation is a function of height above terrain
(equation (15)). When the aircraft center of gravity is
at or below 2m above terrain; the wings level attitude
is imposed. At higher altitudes, the bank angle limit
linearly increases to 15m, ie., at the end of take-off or
at beginning of landing, 20
0
are allowed.
Φ
lim,h
=
0 if x ≤ 2m
20
0
h−2m
13m
if x > 2m
(15)
To prevent excessive attitudes, the following limits on
pitch and bank angle are imposed.
Φ
lim,U
= 60
0
θ
lim,U
= 20
0
θ
lim,L
= −10
0
4.2 Fuzzy Logic Controller
The architecture of the tactile display system use a
Fuzzy Logic Controllers (FLC), to controls vibration
frequency, timing and location, from which vibrotac-
tile spatiotemporal patterns can be created. One main
characteristic of a fuzzy controller is its applicabil-
ity to systems with uncertainty or even with unknown
models (Sepehri and Lawrence, 1998). This makes
a fuzzy controller ideal for dynamically reproducing
the multimodal aerodynamic display of the flight data
parameters with the flight envelop and the optimal de-
cision in the torso and abdomen of the pilot.
This part focuses on design of a Mamdani fuzzy
model which shall generate adequate duration, loca-
tion and frequency of each tactors based on the aero-
dynamic data (see Fig.5). The fuzzy controller was
designed to account for the different parameters those
affect the horizontal and vertical flight path changes.
The stability aspect of the outer loop including the
fuzzy model is not addressed in this work and more
details about the design of fuzzy controllers can be
found in (Jantzen, 1998).
Six variables were used as input for fuzzy con-
troller those are, the flight envelope limit, turn rate,
the flight path climb, pitch limit, bank limit and flight
path climb limit angles. The outputs of FLC are the
desired frequency and location of tactors in horizon-
tal and lateral directions. To define the outputs we
need to understand the behaviour of the skin and the
amplitudes required for frequency of stimulation and
rhythm. So, The Optimal sensitivity is achieved at
frequencies between 25 and 320 Hz for abdomen site
(Cholewiak et al., 2004). Furthermore, in most tactile
displays, people prefer that the duration of the tactile
pulses has to be between 20 and 320 ms (optimally
near 50 ms), and when the tactile display is function-
ing as a simple alert the duration has to be between
50 and 200 ms (Kaaresoja and Linjama, 2005). In our
work, we created a rhythms together so as to group
vibrotactile pulses of varying durations (Brown et al.,
2005). In which we used a duration of 50 ms with
flight path climb and turn rate angles data display, a
duration of 150 ms to indicate alerts to keep the air-
craft in its flight envelope. The linguistic terms of
each input variable are defined as follows:
Flight Path Climb Angle: NVBG (Negative Very
Big Gamma), NBG (Negative Big Gamma), NMG
(Negative Medium Gamma), NSG (Negative Small
Gamma), ZG (Zero Gamma), PSG (Posive Small
Gamma), PMG (Posive Medium Gamma), PBG (Po-
sive Big Gamma), PVBG (Posive Very Big Gamma).
Turn Rate Angle: NVBT (Negative Very Big
Turn), NBT (Negative Very Big Turn), NMT (Neg-
ative Medium Turn), NST (Negative Small Turn), ZT
(Zero Turn), PST (Positive Small Turn), PMT (Po-
sive Medium Turn), PBG (Positive Big Turn), PVBG
(Positive Very Big Turn).
Pitch Limit: NLP (No Limit Pitch), LP (Limit
Pitch).
Tactile Display Design for Securing Flight and Reducing the Saturation of Pilot’s Visual Channel
369
Bank Limit: NLB (No Limit Bank), LB (Limit
Bank).
Flight Path Climb Angle Limit: NLG (No Limit
Gamma), LG (Limit Gamma).
Flight Envelope Limit: NLE (No Limit Enve-
lope), LE (Limit Envelope).
Once the proper inputs were created, the next
step is to create the output characteristic behavior of
the tactile signal being received by the TCU unit.
The outputs variables Vibration characteristics (Loca-
tion/Frequency/Timing) was classified as :
Vertical Tactor: VBT8 (Vertical Back Tactor 8),
VBT7 (Vertical Back Tactor 7), VBT6 (Vertical Back
Tactor 6), VBT5 (Vertical Back Tactor 5), ZVT (Zero
Vertical Tactor), VAT1 (Vertical Abdomen Tactor 1),
VAT2 (Vertical Abdomen Tactor 2), VAT3 (Vertical
Abdomen Tactor 3), VAT4 (Vertical Abdomen Tactor
5), VLT (Vertical Limit Tactors).
Side Tactor: RST8 (Right Side Tactor 8), RST7
(Right Side Tactor 7), RST6 (Right Side Tactor 6),
RST5 (Right Side Tactor 5), ZST (Zero Side Tactor),
LST1 (Left Side Tactor 1), LST2 (Left Side Tactor 2),
LST3 (Left Side Tactor 3), LST4 (Left Side Tactor 5),
SLT (Side Limit Tactors).
The next step is to create a rule base that would
govern the operation of the fuzzy controller. Proper
conditions must be created in order to implement a
system that will display the flight data and secure the
flight. In order to establish such a collection of fuzzy
rules, we questioned experts (pilots), using a carefully
organized questionnaire and to complete the rules ta-
ble system as shown in Table 1. The use of expert
knowledges is the most common approach to design
fuzzy controller rules and convert the flight data on
tactile signals.
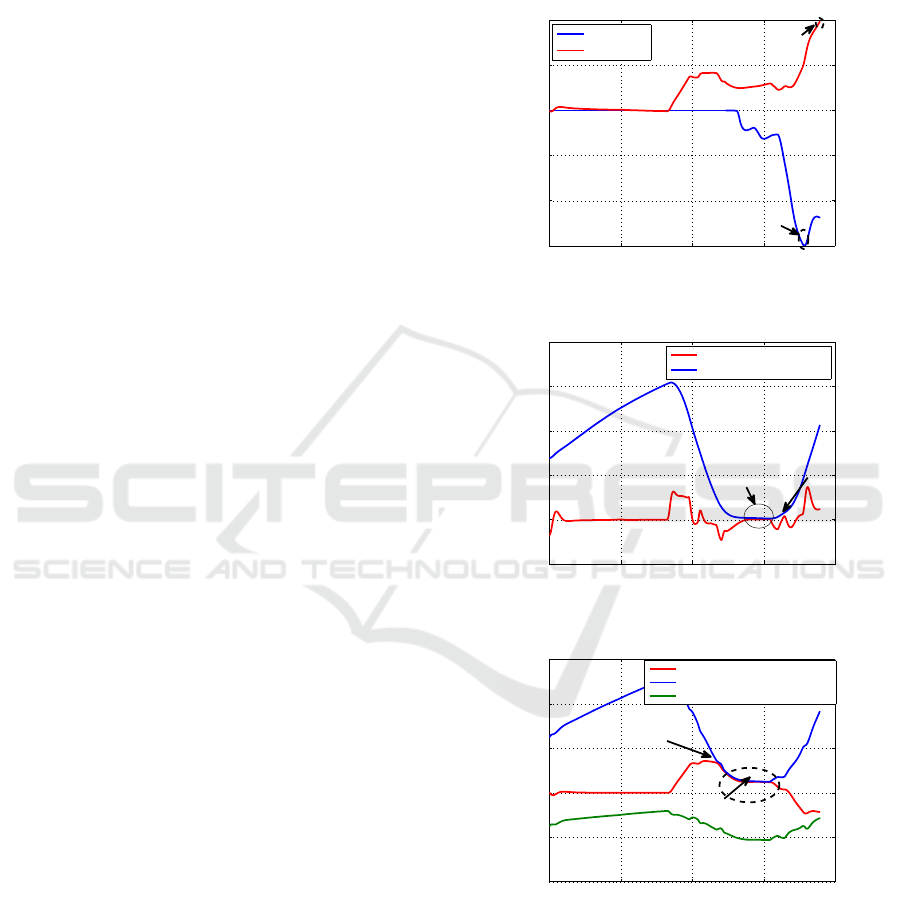
Figures (14), (15), (16), (17), (18),(19), (20) and
(21) show an example of simulated manoeuvres for a
model aircraft. Fig.14 shows the evolution of the pitch
and the bank angles and Fig.15 shows the historical
time of the normal load factor and the limits of the
normal load factor according to the airspeed. Fig.16
shows the historical time of the flight path climb an-
gles and its upper and lower limits while Fig.17 repre-
sents the location of each tactor in the abdomen site.
In this figure we find the activation of the tactors T1,
T2, T3, T4 according to the value of the flight path
climb angle. After 47 sec the flight climb angle ap-
proach the upper limit (Fig.16) and the four tactors
are activated during this period to display the warn-
ing signal of the limit approach. This limit will cause
an approach towards the limit of the flight envelope
for 14 sec (Fig.17). During this period the pilot is in-
formed of this situation by the tactile signal and tries
to avoid this approach by the action on the control
stick by decreasing the flight path climb angle. These
limits will activate all the eight tactors of the horizon-
tal site (Fig.18). We notice that the tactors are acti-
vated during the flight to informe the pilot about the
flight path climb angle by using the tactile display.
0 20 40 60 80
−30
−20
−10
0
10
20
Time (s)
Amplitude(degree)
Bank angle
Pitch angle
Limit
Limit
Figure 14: Pitch and bank angles limit.
0 20 40 60 80
0.5
1
1.5
2
2.5
3
Time (s)
Load normal factor
Load normal factor limit
Limit
Limit
Figure 15: Load factor limit.
0 20 40 60 80
−20
−10
0
10
20
30
Time (s)
Angle (deg)
Flight Path climb angle
Flight path climb angle uper limit
Flight path climb angle lower limit
Limit
Limit
Figure 16: Flight path climb angle limit.
Figures (19) and (20) show the tactors activation
on the right and left side. In Fig.19 the tactors are
activated only in the two limit of the flight envelope
(Fig. 15) and the limit of bank angle according to the
time of 70sec (Fig.14). While Fig.20 show the activa-
tion of the tactors when the pilot actuate the stick to
turn left. The limits of flight envelope and bank angle
ICINCO 2016 - 13th International Conference on Informatics in Control, Automation and Robotics
370
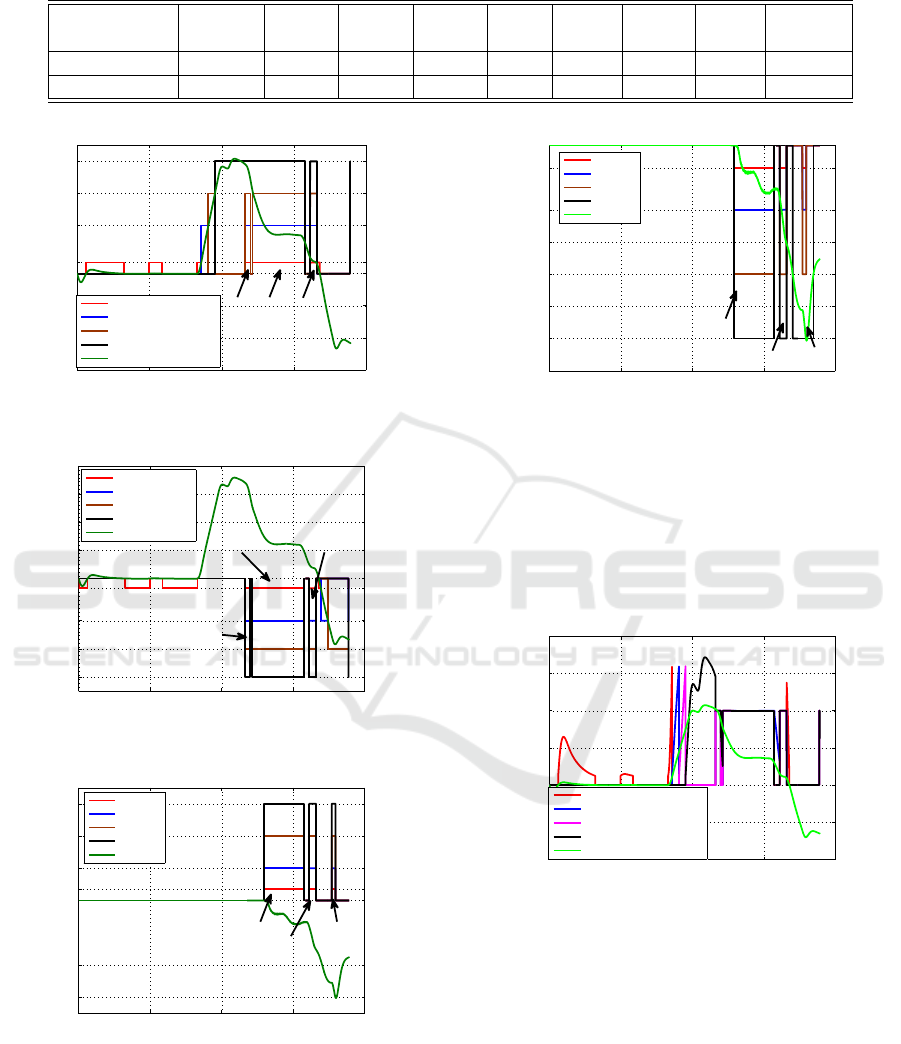
Table 1: Rule base system.
∆n
z,lim
/θ
lim
NVBG/ NBG/ NMG/ NSG/ ZG/ PSG/ PMG/ PBG/ PVBG /
γ/γ
lim
NLG NLG NLG NLG NLG NLG NLG NLG NLG
NLE/Nolimit VBT8 VBT7 VBT6 VBT5 ZVT VAT1 VAT2 VAT3 VAT4
NLE/Limit VLT VLT VLT VLT VLT VLT VLT VLT VLT
0 20 40 60 80
T1
T2
T3
T4
Time (s)
Tactors activation
Tactor 1
Tactor 2
Tactor 3
Tactor 4
Flight path climb angle
Limit1Limit2
Limit3
Figure 17: Tactors activation on the abdomen site.
0 20 40 60 80
T8
T7
T6
T5
Time (s)
Activation tactors
Tactor 5
Tactor 6
Tactor 7
Tactor 8
Flight path angle
Limit1
Limit2
Limit3
Figure 18: Tactors activation on the back site.
0 20 40 60 80
T9
T10
T11
T12
Time (s)
Activation tactors
Tactor 9
Tactor 10
Tactor 11
Tactor 12
Turn rate
Limit1
Limit2
Limit1
Figure 19: Tactors activation on the right side site.
are respected by generating the warning signal.
Fig.21 shows the frequency of tactors on the ab-
domen site calculated from the output signal of the
fuzzy logic controller. The maximum of frequency
correspond to 320Hz and the minimum is 25 Hz.
0 20 40 60 80
T16
T15
T14
T13
Time (s)
Activation tactors
Tactor 13
Tactor 14
Tactor 15
Tactor 16
Turn rate
Limit1
Limit2
Limit3
Figure 20: Tactors activation on the left side site.
When the pilot actuat commands a positive pitch by
deflecting the sidestick at the time of 33sec the air-
craft climbs. This action also increase the flight path
climb angle and the frequency of T1 is 320 Hz at 34
sec, T2 is 320 Hz at 36 sec, T3 is 320 Hz at 38 sec
and T5 is 270Hz at 40 sec.
0 20 40 60 80
−200
−100
0
100
200
300
400
Time (s)
Tactor T1(Hz)
Tactor T2 (Hz)
Tactor T3 (Hz)
Tactor T4 (Hz)
Flight path angle/30 (deg)
Figure 21: Frequency tactors on the abdomen site.
5 CONCLUSION
This paper reports a successful achievement of a new
hardware/software controller for realisation of tactile
display system used in the cockpit design. The assem-
bled prototype and the related built-in software have
been integrated successfully with a dynamic model of
an aircraft and commercial software that assure the
aircraft visualization. In order to achieve a success-
ful transformation of a flight data to tactile signal fea-
Tactile Display Design for Securing Flight and Reducing the Saturation of Pilot’s Visual Channel
371

tures, we have implemented a knowledge based fuzzy
system which allows deriving the amount of vibra-
tion to be reproduced on the mechanoreceptor in the
pilot skin. The designed controller imitates the real
features of tactile display and allows the pilot’s cen-
tral nervous. Also for the flight data and warning sig-
nals to control a virtual aircraft in stressed situations.
Experiments were performed in order to evaluate the
proposed control loop based on a modified speed con-
troller with a fuzzy logic controller. This idea is a step
to use the low cost tactors in the tactile display field by
reducing the settling time in comparison to the open
loop response and delete the overshoot. our own flexi-
ble tactile display can be reconfigured or dynamically
changed to inject different flight data or simulate dif-
ferent parts of the skin.
REFERENCES
Arasan, A., Basdogan, C., and Sezgin, T. M. (2013). Hap-
tic stylus with inertial and vibro-tactile feedback. In
World Haptics Conference (WHC), 2013, pages 425–
430. IEEE.
Brown, L. M., Brewster, S. A., and Purchase, H. C. (2005).
A first investigation into the effectiveness of tactons.
In Eurohaptics Conference, 2005 and Symposium on
Haptic Interfaces for Virtual Environment and Teleop-
erator Systems, 2005. World Haptics 2005. First Joint,
pages 167–176. IEEE.
Brown, L. M. and Kaaresoja, T. (2006). Feel who’s talking:
using tactons for mobile phone alerts. In CHI’06 ex-
tended abstracts on Human factors in computing sys-
tems, pages 604–609. ACM.
Choi, S. and Kuchenbecker, K. J. (2013). Vibrotactile dis-
play: Perception, technology, and applications. Pro-
ceedings of the IEEE, 101(9):2093–2104.
Cholewiak, R. W., Brill, J. C., and Schwab, A. (2004).
Vibrotactile localization on the abdomen: Effects
of place and space. Perception & Psychophysics,
66(6):970–987.
Cholewiak, R. W. and Collins, A. A. (2003). Vibrotactile
localization on the arm: Effects of place, space, and
age. Perception & psychophysics, 65(7):1058–1077.
Erp, V., Jan, B., Veltman, J., van Veen, H., and Oving, A.
(2003). Tactile torso display as countermeasure to re-
duce night vision goggles induced drift. Technical re-
port, DTIC Document.
Feng, G. (2006). A survey on analysis and design of model-
based fuzzy control systems. Fuzzy systems, IEEE
Transactions on, 14(5):676–697.
Fisch, F., Lenz, J., Holzapfel, F., and Sachs, G. (2012). On
the solution of bilevel optimal control problems to in-
crease the fairness in air races. Journal of Guidance,
Control, and Dynamics, 35(4):1292–1298.
Jansen, C., Wennemers, A., Vos, W., and Groen, E. (2008).
Flytact: A tactile display improves a helicopter pi-
lots landing performance in degraded visual environ-
ments. Springer.
Jantzen, J. (1998). Tuning of fuzzy pid controllers. Techni-
cal University of Denmark, report.
Jiang, T. and Li, Y. (1996). Generalized defuzzification
strategies and their parameter learning procedures.
Fuzzy Systems, IEEE Transactions on, 4(1):64–71.
Jones, L. A. and Sarter, N. B. (2008). Tactile displays:
Guidance for their design and application. Human
Factors: The Journal of the Human Factors and Er-
gonomics Society, 50(1):90–111.
Kaaresoja, T. and Linjama, J. (2005). Perception of short
tactile pulses generated by a vibration motor in a mo-
bile phone. In Eurohaptics Conference, 2005 and
Symposium on Haptic Interfaces for Virtual Environ-
ment and Teleoperator Systems, 2005. World Haptics
2005. First Joint, pages 471–472. IEEE.
Kapur, P., Jensen, M., Buxbaum, L. J., Jax, S. A., and
Kuchenbecker, K. J. (2010). Spatially distributed tac-
tile feedback for kinesthetic motion guidance. In Hap-
tics Symposium, 2010 IEEE, pages 519–526. IEEE.
Kelley, A. M., Cheung, B., Lawson, B. D., Rath, E., Chi-
asson, J., Ramiccio, J. G., and Rupert, A. H. (2013).
Efficacy of directional cues from a tactile system for
target orientation in helicopter extractions over mov-
ing targets. Technical report, DTIC Document.
Lawson, B. D. and Rupert, A. H. (2014). Coalition warfare
program tactile situation awareness system for avia-
tion applications: System development. Technical re-
port, DTIC Document.
Lloyd, D. M., Merat, N., Mcglone, F., and Spence, C.
(2003). Crossmodal links between audition and touch
in covert endogenous spatial attention. Perception &
Psychophysics, 65(6):901–924.
McGrath, B. J. (2000). Tactile instrument for aviation.
Technical report, DTIC Document.
Nojima, T. and Funabiki, K. (2005). Cockpit display using
tactile sensation. In null, pages 501–502. IEEE.
Petit, G. (2013). Conception, prototypage et
´
evaluation dun
syst
`
eme pour l’exploration audio-tactile et spatiale de
pages web par des utilisateurs non-voyants. PhD the-
sis,
´
Ecole Polytechnique de Montr
´
eal.
Precup, R.-E. and Hellendoorn, H. (2011). A survey on
industrial applications of fuzzy control. Computers in
Industry, 62(3):213–226.
Renwick, K. (2008). Effectiveness of vibration-based haptic
feedback effects for 3d object manipulation.
Rosenblum, L. D. (2011). See what I’m Saying: The Ex-
traordinary Powers of Our Five Senses. WW Norton
& Company.
Sala, A., Guerra, T. M., and Babu
ˇ
ska, R. (2005). Perspec-
tives of fuzzy systems and control. Fuzzy Sets and
Systems, 156(3):432–444.
Salzer, Y. and Oron-Gilad, T. (2015). Evaluation of an on-
thigh vibrotactile collision avoidance alerting compo-
nent in a simulated flight mission. Human-Machine
Systems, IEEE Transactions on, 45(2):251–255.
Schmidt-Skipiol, F. J. (2015). Tactile feedback and situation
awareness.
Seiderman, A., Marcus, S. E., and Hapgood, D. (1989).
20/20 is not enough: the new world of vision. Alfred
A. Knopf.
ICINCO 2016 - 13th International Conference on Informatics in Control, Automation and Robotics
372

Self, B., Van Erp, J. B., Eriksson, L., and Elliott, L. (2008).
Human factors issues of tactile displays for military
environments. Tactile Displays for Orientation, Nav-
igation and Communication in Air, Sea and Land En-
vironments, pages 1–18.
Sepehri, N. and Lawrence, P. D. (1998). Fuzzy logic con-
trol of a teleoperated log loader machine. In Intelli-
gent Robots and Systems, 1998. Proceedings., 1998
IEEE/RSJ International Conference on, volume 3,
pages 1571–1577. IEEE.
Tang, F., McMahan, R. P., and Allen, T. T. (2014). Develop-
ment of a low-cost tactile sleeve for autism interven-
tion. In Haptic, Audio and Visual Environments and
Games (HAVE), 2014 IEEE International Symposium
on, pages 35–40. IEEE.
Thomas, P., Biswas, P., and Langdon, P. (2015). State-of-
the-art and future concepts for interaction in aircraft
cockpits. In Universal Access in Human-Computer
Interaction. Access to Interaction, pages 538–549.
Springer.
Van Erp, J. and Self, B. (2008). Introduction to tactile dis-
plays in military environments. Tactile Displays for
Orientation, Navigation and Communication in Air,
Sea, and Land Environments, pages 1–1.
Van Erp, J. B., Van Veen, H. A., Jansen, C., and Dobbins, T.
(2005). Waypoint navigation with a vibrotactile waist
belt. ACM Transactions on Applied Perception (TAP),
2(2):106–117.
Van Veen, H. A. and Van Erp, J. B. (2001). Tactile infor-
mation presentation in the cockpit. In Haptic Human-
Computer Interaction, pages 174–181. Springer.
van Wassenhove, V. (2009). Minding time in an amodal
representational space. Philosophical Transactions of
the Royal Society of London B: Biological Sciences,
364(1525):1815–1830.
Vartholomeos, P. and Papadopoulos, E. (2006). Analysis,
design and control of a planar micro-robot driven by
two centripetal-force actuators. In Robotics and Au-
tomation, 2006. ICRA 2006. Proceedings 2006 IEEE
International Conference on, pages 649–654. IEEE.
Wellman, P. S., Peine, W. J., Favalora, G., and Howe, R. D.
(1998). Mechanical design and control of a high-
bandwidth shape memory alloy tactile display. In Ex-
perimental robotics V, pages 56–66. Springer.
Zhang, F., Braun, S., and Holzapfel, F. (2014). Physically
integrated reference model and its aids in validation
of requirements to flight control systems. In AIAA
Guidance, Navigation and Control Conference, pages
2014–0962.
Tactile Display Design for Securing Flight and Reducing the Saturation of Pilot’s Visual Channel
373
