
First Experiments on Interaction Quality Modelling for
Human-Human Conversation
Anastasiia Spirina, Maxim Sidorov, Roman Sergienko and Alexander Schmitt
Institute of Communication Engineering, Ulm University, Albert-Einstein-Allee 43, Ulm, Germany
Keywords: Human-Human Interaction, Call Centres, Classification Algorithms, Performances.
Abstract: This work presents the first experimental results on Interaction Quality modelling for human-human
conversation, as an adaptation of the Interaction Quality metric for human-computer spoken interaction. The
prediction of an Interaction Quality score can be formulated as a classification problem. In this paper we
describe the results of applying several classification algorithms such as: Kernel Naïve Bayes Classifier, k-
Nearest Neighbours algorithm, Logistic Regression, and Support Vector Machines, to a data set. Moreover,
we compare the results of modelling for two approaches for Interaction Quality labelling and consider the
results depending on different emotion sets. The results of Interaction Quality modelling for human-human
conversation may be used both for improving the service quality in call centres and for improving Spoken
Dialogue Systems in terms of flexibility, user-friendliness and human-likeness.
1 INTRODUCTION
Speech is the main modality for human
communication and the most natural user interface.
Thereby Spoken Dialogue Systems (SDSs) are
widespread in different areas. However, due to the
fact that such systems are not as flexible as a human
in communication and have a number of
disadvantages, these systems need some indicator,
which would reflect that something goes wrong
during the interaction and the behaviour of the
system should be changed. For a better
understanding how such systems should respond to
different situations, similar indicators may be
introduced for human-human conversations (HHC).
This paper presents a first view on Interaction
Quality (IQ) for HHC. Our idea of the IQ metric for
HHC is based on the IQ metric for human-computer
spoken interaction (HCSI), which was suggested in
(Schmitt et al., 2011). In this work the authors
introduced the term “IQ” instead of “User
satisfaction” and explained the reasons for it.
Given the fact that HHC is more complex than
HCSI, an adaptation of the initial rules for IQ
labelling is required. We suggest two approaches for
such an adaptation. The first one uses an absolute
scale, like in the initial approach for IQ labelling for
HCSI, whereas another approach consists of two
steps: firstly a scale of changes is used, which is then
transformed into an absolute scale.
Another specific aspect of this work is the
following: for understanding which emotions set is
the best suitable for IQ modelling for HHC, we used
the three different emotion sets. From each of them
we generated two new sets:
A set with the two classes (neutral emotions and
others).
A set with the three classes (negative, neutral,
positive emotions).
For modelling IQ for HHC we decided to use the
four classification algorithms implemented in
Rapidminer and WEKA (Hall et al., 2009):
Kernel Naïve Bayes classifier (NBK) (John et
al., 1995).
k-Nearest Neighbours algorithm (kNN) (Witten
et al., 2011).
L2 Regularised Logistic Regression (LR) (le
Cessie et al., 1992).
Support Vector Machines (Cristianini et al.,
2000) trained by Sequential Minimal
Optimisation (W-SMO) (Platt, 1998).
This paper is organized as follows. A brief
description of related work (IQ for HCSI and some
characteristics concerning HHC) is presented in
Section 2. In turn, Section 3 gives information about
the speech data used for IQ modeling for HHC and
introduces two approaches for annotating IQ for
374
Spirina, A., Sidorov, M., Sergienko, R. and Schmitt, A.
First Experiments on Interaction Quality Modelling for Human-Human Conversation.
DOI: 10.5220/0005983103740380
In Proceedings of the 13th International Conference on Informatics in Control, Automation and Robotics (ICINCO 2016) - Volume 2, pages 374-380
ISBN: 978-989-758-198-4
Copyright
c
2016 by SCITEPRESS – Science and Technology Publications, Lda. All rights reserved

HHC. Then, Section 4 provides the achieved results
of IQ modelling for HHC on different emotion sets
and different approaches of IQ annotating. The
obtained results are discussed in Section 5, which is
followed in Section 6 by conclusions and concise
description of future work.
2 RELATED WORK
The idea of applying IQ for HHC is based on the IQ
paradigm, introduced in (Schmitt et al., 2011) for
assessing the performance of an SDS during an
ongoing interaction. The IQ metric allows to
estimate, how the system is performing at any point
during the interaction. The IQ metric is a 5-point
scale: excellent, good, fair, poor, and bad. If the
quality drops below a certain threshold, the dialogue
strategies shall be changed in order to increase the
quality again. The metric is based on features which
are derived from the three dialogue system modules:
Automatic Speech Recognition, Natural Language
Understanding, and Dialogue Management.
Moreover, these interaction parameters are designed
on the three levels: the exchange level, comprising
information about the current system-user-exchange,
the dialogue level, consisting of information about
the complete dialogue up to the current exchange,
and the window level, containing information about
the n last exchanges. The complete list of features
can be found in (Schmitt et al., 2012). While the IQ
metric has been proven to be beneficial in human-
machine interaction scenarios, the approach may
also help to assess the quality of human-human
communication. This is for example of particular
interest in call centres, where calls with the rather
low quality of interaction have to be found for
training and evaluation purposes.
There are different research works, which allow to
assess different aspects of human speech in dialogues.
One of such a work is dedicated to the Customer
Orientation Behaviours (COBs), which were
suggested by the authors in (Rafaeli et al., 2008).
The COBs include the following categories:
anticipating customer requests, offering explanations
/ justifications, educating customers, providing
emotional support, and offering personalized
information. Within their research the authors have
ascertained the positive relationship between the
COB categories and the service quality, evaluated by
customers. However, this approach allows to assess
only an agent in a dialogue, but, nevertheless, the
COBs are also an important aspect of interaction and
can help to evaluate the quality of interaction
between an agent and a customer in general.
The authors in (Pallotta et al., 2011) described
their approach to Call Center Analytics. It is based
on Interaction Mining - a research field, which
works with an extraction of useful information from
conversations. The authors described the
cooperativeness score as a measure, which was
obtained from the argumentative labels, such as:
accept explanation, suggest, propose, provide
opinion, provide explanation or justification, request
explanation or justification, question, raise issue,
provide negative opinion, disagree, reject
explanation or justification. Using the history of the
calls the cooperativeness score can help to determine
agents with constantly high cooperativeness score
(positive cooperativeness) and customers with low
cooperativeness score. Thus, it can help to improve
the call centre performance by connecting more
skilled agents with customers with uncooperative
attitudes. The cooperativeness score gives a
characteristic of agent’s or customer’s speech or
their behaviour and may be used for the interaction
quality evaluation.
Another important indicator for an estimation of
the conversation quality, which is widely used in call
centres, is customer satisfaction. A lot of works are
dedicated to it.
In (Park et al., 2009) the authors suggested the
approach, which allows to evaluate customer
satisfaction automatically by analysing call transcripts
consisting of various features, indicating linguistic,
prosodic and behavioural aspects of speakers. Their
experiments shown, that customer satisfaction may be
evaluated both at the end and in the middle of calls.
The paper (Llimona et al., 2015), dedicating to
customer satisfaction in a call centre, provides the
research of an effect of gender and call duration on
customer satisfaction in call centre big data. The
authors found out the significant correlation between
customer satisfaction (self-reported by a customer at
the end of the call) and gender homophile between
the customer and the employee.
The research works in the field of customer
satisfaction may be applied for modelling IQ,
despite of some differences between IQ and
customer satisfaction. These differences between
two metrics and their resemblance are described in
(Schmitt and Ultes, 2015).
Moreover, there has been a lot of research
dedicated to emotion recognition, verbal intelligent
detection, agreement/disagreement detection and
others. All these works are useful for different
purposes and can be utilized for the evaluation of the
conversation quality.
First Experiments on Interaction Quality Modelling for Human-Human Conversation
375
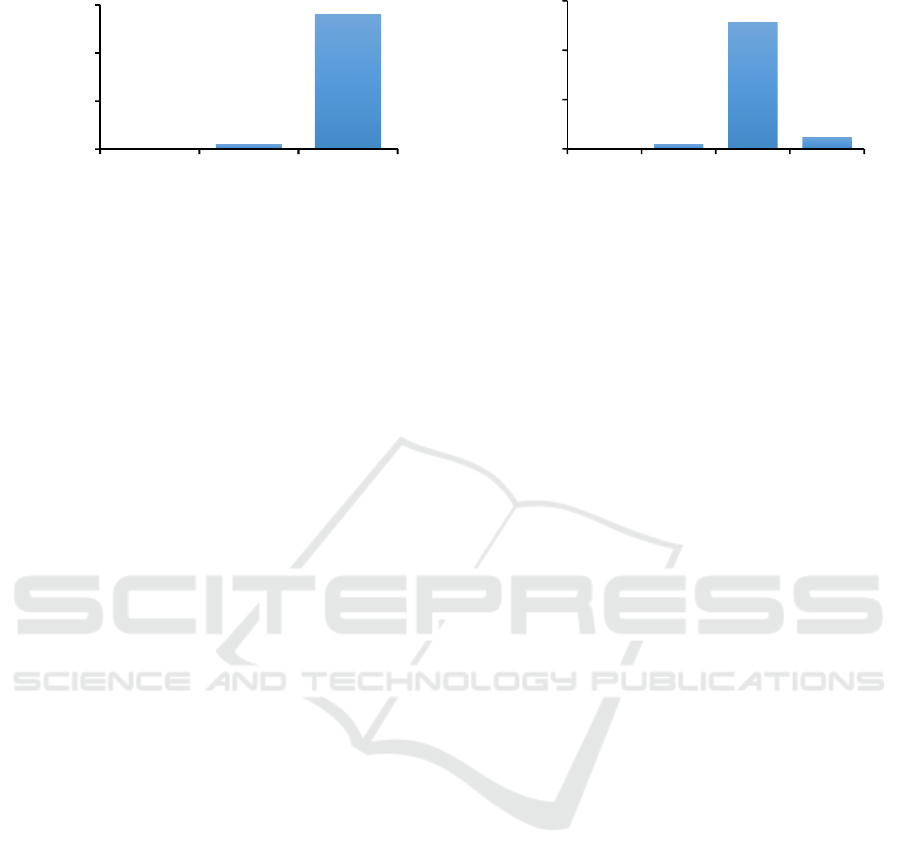
Figure 1: The IQ score distribution for the first approach
of the annotation.
3 CORPUS DESCRIPTION
For our research we used the spoken corpus
described by the authors in (Spirina et al., 2016).
This corpus consists of 53 task-oriented dialogues
between customers and employees with the total
duration of approximately 87 minutes. It contains
1,165 agent-customer exchanges accompanied by
the IQ labels. The corpus includes more than 1,200
features for each exchange: audio features (extracted
by OpenSMILE (Eyben et al., 2013)) for an agent /
customer / overlapping speech, paralinguistic
information (such as emotions) and other dialogue
features. All features in the corpus can be subdivided
into the three groups: the exchange / window /
dialogue parameter levels. These parameter levels
are described in (Schmitt et al., 2012).
All exchanges from this corpus were annotated
with an IQ score using two guidelines. As a basis for
the IQ score annotating guidelines, we used the rater
guideline described in (Schmitt et al., 2011).
For the first guideline we only adapted the
guideline (Schmitt et al., 2011) to HHC. The IQ
score distribution for the first approach of annotation
is presented in Figure 1. We denote this IQ as IQ1.
In the second guideline we used a different
approach: instead of an absolute scale a scale of
changes has been applied. This scale shows how an
IQ score has changed from the previous to the
current exchange. Then we transformed this scale
into an absolute one. Using an assumption, that all
dialogues start with the IQ score “5”, and applying
the received scale of changes, we became another
IQ. Denote it as IQ2_abs. The distribution of the
IQ2_abs scores is depicted in Figure 2.
The number of the observations for both IQ1 and
IQ2_abs is highly unbalanced: the class with the IQ
score “5” covers 96.39% and 88.24% of the
observations correspondently.
Figure 2: The IQ score distribution for the second
approach of the annotation.
The both guidelines are presented in Table 1.
4 EXPERIMENTAL SETUP AND
RESULTS
The task for IQ modelling can be formulated as a
classification problem, in our case with the three
classes for IQ1 and the four classes for IQ2_abs. The
total number of the formulated classification problems
is eighteen. Each task is a combination of an IQ label
(IQ1 or IQ2_abs) and a set of emotions (nine sets).
In this work we use nine sets of emotions: three
main sets and two sets derived from each of them.
The first set (em1) includes such emotion categories
as angry, sad, neutral, and happy. The next set (em2)
consists of such categories as: anxiety, anger,
sadness, disgust, boredom, neutral, and happiness.
The last set (em3) includes such categories as: fear,
anger, sadness, disgust, neutral, surprise, and
happiness. Subsequently, from each of the original
sets, the two new sets were derived by subdividing
the original set of emotions into neutral and other
emotions (denote them as em{1,2,3}_2) and into
negative, neutral and positive emotions (denote them
as em{1,2,3}_3).
Before applying the classification algorithms
each attribute has been normalized using the
statistical normalization, which allows to convert the
data into normal distribution with mean = 0 and
variance = 1. In addition, all nominal attributes,
such as emotions, gender and type of speaker (agent
or customer) were transformed into numerical data.
4.1 Classification Algorithms
For solving these classification problems we used
the algorithms implemented in Rapidminer and
WEKA: NBK, kNN, LR, W-SMO.
4
38
1123
0
400
800
1200
345
number of exchanges
IQ label
4
37
1028
96
0
400
800
1200
3456
number of exchanges
IQ label
ICINCO 2016 - 13th International Conference on Informatics in Control, Automation and Robotics
376

Table 1: The guidelines for raters for IQ annotating in the absolute scale and the scale of changes (Spirina et al., 2016).
The absolute scale The scale of changes
1.
The rater should try to assess the interaction on the whole as objectively as possible, but pay more attention to the
customer point of view in the interaction.
2. An exchange consists of the agent and the customer turns.
3.
The IQ score is defined on a 5-point scale with
“1=bad”, “2=poor”, “3=fair”, “4=good” and
“5=excellent”.
The IQ score is defined on a 6-point scale with “-2”, “-
1”, “0”, “1”, “2” and “abs 1”. First five points of the
scale reflect changes in the IQ from previous exchange
to current exchange. “abs 1” means “1=bad” in the
absolute scale.
4.
The IQ is to be rated for each exchange in the dialogue. The history of the dialogue should be kept in mind when
assigning the score. For example, a dialogue that has proceeded fairly poor for a long time, should require some
time to recover.
5. A dialogue always starts with an IQ score of “5”. A dialogue always starts with an IQ score of “0”.
6.
In general, the score from one exchange to the following exchange is increased or decreased by one point at the
most.
7.
Exceptions, where the score can be decreased by two points are e.g. hot anger or sudden frustration. The rater’s
perception is decisive here.
8.
Also, if the dialogue obviously collapses due to agent
or customer behaviour, the score can be set to “1”
immediately. An example therefore is a reasonable
frustrated sudden hang-up.
Also, if the dialogue obviously collapses due to agent
or customer behaviour, the score can be set to “abs 1”
immediately. An example therefore is a reasonable
frustrated sudden hang-up.
9.
Anger does not need to influence the score, but can. The rater should try to figure out whether anger was caused
by the dialogue behaviour or not.
10.
In the case a customer realizes that he should adapt his dialogue strategy to obtain the desired result or
information and succeeded that way, the IQ score can be raised up to two points per turn. In other words, the
customer realizes that he caused the poor IQ by himself.
11.
If a dialogue consists of several independent queries, each query’s quality is to be rated independently. The
former dialogue history should not be considered when a new query begins. However, the score provided for the
first exchange should be equal to the last label of the previous query.
12.
If a dialogue proceeds fairly poor for a long time, the rater should consider to increase the score more slowly if the
dialogue starts to recover. Also, in general, he should observe the remaining dialogue more critical.
13. If a constantly low-quality dialogue finishes with a reasonable result, the IQ can be increased.
For each algorithm we used the Grid parameter
optimisation with 10-fold cross-validation, where F1-
score (Goutte et al., 2005) was maximised. The settings
for the classification algorithms are shown in Table 2.
4.2 Results
To assess the classification performance we
accomplished 10-fold cross-validation to obtain
statistically reliable results. We used such
classification performance measures as accuracy, the
unweighted average recall (UAR) as in (Ultes et al.,
2012), F1-score, which were averaged over ten
computations on different train-test splits.
The results of computations in terms of F1-score
are presented in Table 3. The experimental results in
terms of UAR can be found in Table 4, whereas
Table 5 provides the accuracy for these experiments.
5 DISCUSSION
The one-way analysis of variance (one-way
ANOVA) (Bailey, 2008), which helps to determine
the statistically significant differences between the
means of three or more groups, shows that for IQ1
through all classification performance measures
there are no any statistically significant differences.
For IQ2_abs through all tasks for all classification
performance measures the one-way ANOVA
determined, that the differences between means are
statistically significant. To find out what algorithms
gave statistically significant different results we used
the Tukey’s honest significant difference (HSD) test
(Kennedy et al., 1985). This test shows that almost
in all the cases there are statistically significant
differences between the results of NBK and other
algorithms.
First Experiments on Interaction Quality Modelling for Human-Human Conversation
377

Table 2: The settings for the classification algorithms and
parametric optimisation.
Parameter Parameter’s value
NBK
laplace correction
(helps to prevent high
influence of zero
probabilities)
estimation mode
minimum bandwidth
number of kernels
true
greedy
[0.01, 0.3], step 0.01
[1, 20], step 1
kNN
k
numerical measure
kernel type
kernel gamma
kernel degree
[1, 20], step 1
KernelEuclideanDistance
anova
[0.5, 5.0], step 0.5
[0.5, 5.0], step 0.5
LR
R (sets set the ridge in
the log-likelihood)
[0.05, 0.95], step 0.05
W-SMO
the complexity
constant C
the tolerance
parameter L
fit logistic models to
SVM outputs
kernel
1
0.001
false
polynomial
For the computations we used the one-way
ANOVA and the Tukey’s HSD test with the default
settings, implemented in R programming language
(R Development Core Team, 2008).
The accuracy baselines (classifier always
predicts the majority class) for IQ1 and IQ2_abs are
0.964 and 0.882 correspondently. For F1-score the
baselines are 0.327 and 0.234 respectively.
Given the fact that the data is highly unbalanced
the results are not reasonable enough, although the
obtained results outperform the baselines. Also the
result can be not objective, since emotions and the
IQ scores were annotated by only one expert rater.
The best results are highlighted in bold in Table
3, Table 4 and Table 5. It should be noted, that the
algorithms, which show the best results in terms of
one performance measure, can be not the best in
terms of other performance measures. For example,
for IQ1 in terms of F1-score the best results were
obtained by W-SMO and NBK, in turn, in terms of
accuracy the best results were achieved almost in all
cases by LR. The same can be mentioned about the
results for IQ2_abs. In terms of F1-score and UAR
the best results were accomplished by kNN, which
provides not such good results in terms of accuracy.
Using optimisation with maximisation of other
classification performance measures, instead of F1-
score, the results may vary.
The use of the two scales shows that the initial
scale, which was found suitable for HCSI, can lead
to information loss in IQ modelling for HHC. It can
be caused by a number of reasons, which can be a
case for HHC, but not for HCSI.
Because of the extreme skew towards the IQ
score “5” for both IQ1 and IQ2_abs, the reasonable
question is why we should do any classification in
this case. In general, the biggest part of the calls in
call centres are neutral in terms of IQ. Such calls are
not so interested for research in contrast to
problematic calls, which can provide information for
analysis and further improvement of the service
quality. The corpus, which was used in this work,
consists of 53 dialogues, which may be not enough.
Table 3: F1-score for the classification algorithms.
IQ1 IQ2_abs
NBK W-SMO kNN LR NBK W-SMO kNN LR
Emotions
em1
0.532
0.524 0.509 0.506
0.452 0.578
0.606
0.563
em1_2
0.518
0.5 0.509 0.472
0.474 0.579
0.606
0.541
em1_3
0.532
0.524 0.509 0.506
0.452 0.578
0.606
0.563
em2 0.502
0.534
0.48 0.484
0.455 0.592
0.606
0.548
em2_2 0.5
0.522
0.48 0.479 0.471 0.589
0.606
0.541
em2_3 0.499
0.519
0.48 0.492
0.461 0.591
0.606
0.543
em3 0.521
0.548
0.509 0.52
0.441 0.593
0.604
0.541
em3_2 0.515
0.523
0.509 0.471
0.481 0.585
0.604
0.531
em3_3 0.516
0.544
0.509 0.504
0.441 0.594
0.604
0.538
ICINCO 2016 - 13th International Conference on Informatics in Control, Automation and Robotics
378

Table 4: UAR for the classification algorithms.
IQ1 IQ2_abs
NBK W-SMO kNN LR NBK W-SMO kNN LR
Emotions
em1
0.501 0.497
0.508
0.457 0.435 0.55
0.596
0.518
em1_2 0.485 0.469
0.508
0.44 0.461 0.547
0.596
0.497
em1_3 0.501 0.497
0.508
0.457 0.435 0.55
0.596
0.518
em2
0.477
0.495
0.475 0.45 0.452 0.559
0.596
0.522
em2_2
0.469
0.478
0.475 0.441 0.46 0.553
0.596
0.5
em2_3
0.476
0.486
0.475 0.449 0.458 0.557
0.596
0.506
em3
0.493 0.499
0.508
0.466 0.434 0.562
0.593
0.512
em3_2 0.477 0.478
0.508
0.44 0.467 0.551
0.594
0.486
em3_3
0.492 0.506
0.508
0.458 0.434 0.56
0.594
0.512
Table 5: Accuracy for the classification algorithms.
IQ1 IQ2_abs
NBK W-SMO kNN LR NBK W-SMO kNN LR
Emotions
em1 0.971 0.969 0.968
0.973
0.856 0.934 0.927
0.937
em1_2
0.972
0.966 0.968 0.971 0.851 0.933 0.927
0.936
em1_3
0.971 0.969 0.968
0.973
0.856 0.934 0.927
0.937
em2
0.972 0.973 0.968
0.974
0.847
0.941
0.927 0.936
em2_2
0.971 0.969 0.968
0.972
0.848 0.936 0.927
0.937
em2_3 0.971 0.969 0.968
0.973
0.849
0.939
0.927 0.936
em3 0.971
0.976
0.968
0.976
0.852
0.938
0.926 0.934
em3_2
0.971
0.969 0.968 0.971 0.852
0.936
0.926 0.933
em3_3
0.97 0.971 0.968
0.975
0.852
0.939
0.926 0.932
But the results, obtained on this data can be used for
the further research.
6 CONCLUSION AND FUTURE
WORK
In this paper we presented the first view of an
adaptation of the IQ idea suggested by Schmitt et al.
(Schmitt et al., 2011) to HHC. The further works in
the field of IQ modelling for HHC may help to
identify non-trivial patterns, which influence on the
quality of conversation. These patterns, in turn, may
be adapted and integrated into SDSs (in particular in
a robot’s behavioural system), what possibly will be
utilized for improving the quality of spoken
interaction between users and SDSs.
As a future direction we plan to use other
classification algorithms and ensembles of
algorithms. Caused by high dimensionality of the
feature space the application of dimensionality
reduction methods are required both for decreasing
the computational complexity and for increasing
classification performance measures. Furthermore
we plan to increase the number of expert raters to
obtain more objective data. Finally, due to the
problems of an interpretation of different IQ scores
for HHC (especially for IQ2_abs), we plan to
suggest an alternative scale for measuring IQ for
HHC with less subjectivity and an easily
interpretable scale.
ACKNOWLEDGEMENTS
The work presented in this paper was supported by
the DAAD (German Academic Exchange Service).
First Experiments on Interaction Quality Modelling for Human-Human Conversation
379

REFERENCES
Bailey, R. A., 2008. Design of comparative experiments,
Cambridge University Press.
le Cessie, S., van Houwelingen, J. C., 1992. Ridge
Estimators in Logistic Regression. Applied Statistics,
Vol. 41, No. 1, pp. 191-201.
Cristianini, N., Shawe-Taylor, J., 2000. An introduction to
Support Vector Machines and Other Kernel-based
Learning Methods, Cambridge University Press.
Eyben, F., Weninger, F., Gross, F., Schuller, B., 2013.
Recent Developments in openSMILE, the Munich
Open-Source Multimedia Feature Extractor. In
Proceedings of ACM Multimedia (MM), pp. 835-838.
Goutte, C., Gaussier, E., 2005. A probabilistic
interpretation of precision, recall and f-score, with
implication for evaluation. Advances in information
retrieval. Springer.
Hall, M., Frank, E., Holmes, G., Pfahringer, B.,
Reutemann, P., Witten, I. H., 2009. The WEKA Data
Mining Software: An Update. SIGKDD Explorations,
Vol. 11, No. 1.
John, G.H., Langley, P., 1995. Estimating Continuous
Distributions in Bayesian Classifiers. In Eleventh
Conference on Uncertainty in Artificial Intelligence,
San Mateo, pp. 338-345.
Kennedy, J. J., Bush, A. J., 1985. An introduction to the
design and analysis of experiments in behavioral
research, University Press of America.
Llimona, Q., Luque, J., Anguera, X., Hidalgo, Z., Park, S.,
Oliver, N., 2015. Effect of gender and call duration on
customer satisfaction in call center big data. In
Proceedings of Interspeech, pp. 18525-1829.
Pallotta, V., Delmonte, R., Vrieling, L., Walker, D., 2011.
Interaction Mining: the new frontier of Call Center
Analytics. In CEUR Workshop Proceedings.
Park, Y., Gates, S. C., 2009. Towards real-time
measurement of customer satisfaction using
automatically generated call transcripts. In
Proceedings of the 18
th
ACM conference on
Information and knowledge management, New York,
pp. 1387-1396.
Platt, J., 1998. Sequential Minimal Optimisation: A Fast
Algorithm for Training Support Vector Machines.
TechReport MSR-TR-98-14, Microsoft Research.
Rafaeli, A., Ziklik, L., Doucet, L., 2008. The Impact of
Call Center Employees’ Customer Orientation
Behaviors on Service Quality. Journal of Service
Research, Vol. 10, No. 3, pp. 239-255.
R Core Team, 2015. R: A language and environment for
statistical computing, R Foundation for Statistical
Computing. Vienna, Austria. http://www.r-
project.org/.
Schmitt, A., Schatz, B., Minker, W., 2011. Modeling and
predicting quality in spoken human-computer
interaction. In Proceedings of the SIGDIAL 2011
Conference. Association for Computational
Linguistics, pp. 173-184.
Schmitt, A., Ultes, S., Minker, W., 2012. A Parameterized
and Annotated Corpus of the CMU Let's Go Bus
Information System. In International Conference on
Language Resources and Evaluation (LREC).
Schmitt, A., Ultes, S., 2015. Interaction Quality: Assessing
the quality of ongoing spoken dialog interaction by
experts – And how it relates to user satisfaction.
Speech Communication, Vol. 74, pp. 12 – 36.
Spirina, A. V., Sidorov M. Yu., Sergienko, R. B.,
Semenkin E. S., Minker, W., 2016. Human-Human
Task-Oriented Conversations Corpus for Interaction
Quality Modelling. Vestnik SibSAU, Vol. 17, No. 1.
Ultes, S., ElChabb, R., Minker, W., 2012. Application and
Evaluation of a Conditioned Hidden Markov Model
for Estimating Interaction Quality of Spoken Dialogue
Systems. In Proceedings of the 4
th
International
Workshop On Spoken Dialogue Systems (IWSDS), pp.
141-150.
Witten, I. H., Frank, E., Hall, M. A., 2011. Data mining:
practical machine learning tools and techniques,
Morgan Kaufmann. USA, 3
rd
edition.
ICINCO 2016 - 13th International Conference on Informatics in Control, Automation and Robotics
380
