
Bug Report Quality Evaluation Considering the Effect of Submitter
Reputation
Lerina Aversano and Ermanno Tedeschi
Department of Engineering, University of Sannio, Via Traiano 1, 82100 Benevento, Italy
Keywords: Bug Report, Software Quality, Open Source, Validation, Quality Assessment.
Abstract: The quality of a bug report is a very crucial aspect that influences the entire software life cycle. Generally,
in many software projects relevant lack of information can be observed when submitting a bug report.
Consequently, the time resolution of a software problem is strongly influenced by the quality of the
reporting. In this paper, we investigate the quality of bug reports from the perspective of developers. We
examined several metrics impacting the quality of bug reports, such as the length of descriptions, presence
of stack traces, presence of attachments, completeness, and readability. In addition different definition of
submitter reputation are compared and used. Then, a quality model is built for the evaluation of the quality
of the bug reports, and a software tool has been implemented for supporting the application of the proposed
model. The validation has been conducted on real cases of bug reports from open source software.
1 INTRODUCTION
A bug in a software system is a failure that produces
an incorrect or unexpected behaviour, therefore it
causes numerous effects. In some cases a bug has a
low impact on the functionalities of the software
system and consequently may remain unknown for a
long time. On the other hand, if a bug is severe
enough, it could cause the crash of the software
system leading to a denial of service. In others cases
the bug could impact the quality aspects, such as
security, for example it could allow an user to
bypass access controls, in order to gain unauthorized
privileges.
Bug reports are essential for the maintenance and
evolution of most software systems, these allow
final users of a software to inform maintainers about
the problems encountered during the system usage.
Typically bug reports contain a detailed description
of a failure, sometimes indicate its position within
the code (in the form of patches or stack traces).
However, the quality of the bug reports can be
different according to their content. Very often they
provide incorrect or inadequate information. Thus,
maintainers sometimes have to deal with bugs with
descriptions such as: "ADD ZIndex ATTRIBUTE
TO CONFIRM DIALOG" (PrimeFaces bug # 865)
or "This sentences does not make sense to me: When
used together with, behaviours are even blackberries
powerful." (YII bug # 1460). As a consequence the
maintainers efficiency is affected by poorly written
bug reports. Indeed, the understanding of a problem
requires an effort higher than the effort required to
solve the problem. To address this difficulty many
guidelines on how to write a good bug report have
been defined (Goldmerg, 2010) (Breu et al., 2010).
The quality of a bug report could impact the
entire software system life cycle. In fact, it is a
common practice in many software project, to
discard bug reports unclear or having a severe lack
of information.
In this paper, we investigate the quality of bug
reports from the perspective of maintainers. Several
attributes impacting the quality of bug reports have
been considered, such as the length of descriptions,
formatting, and presence of stack traces and
attachments (such as screenshots). However, in
particular, the authors investigate the use of the
reputation attribute to construct a quality model of a
bug report.
The paper is structured as follows: Section 2
describes the state of the art and provides
information about some relevant research work
related to the quality of a bug report; Section 3
describes the quality model built for the evaluation
of the quality of the bug reports; Section 4 describes
the software tool implemented for supporting the
194
Aversano, L. and Tedeschi, E.
Bug Report Quality Evaluation Considering the Effect of Submitter Reputation.
DOI: 10.5220/0005982601940201
In Proceedings of the 11th Inter national Joint Conference on Software Technologies (ICSOFT 2016) - Volume 1: ICSOFT-EA, pages 194-201
ISBN: 978-989-758-194-6
Copyright
c
2016 by SCITEPRESS – Science and Technology Publications, Lda. All rights reserved

application of the proposed model. Finally Section 5
section outlines the conclusions and future work.
2 RELATED WORK
The literature reports different studies addressing
topics related to the quality of a bug report, but in
few cases propose approaches methods for the
evaluation of the bug report quality.
Breu et al., have identified the information that
developers consider necessary within a bug report
(Breu et al., 2010) and suggest, on the basis of the
investigations carried out, improvements to the bug
tracking systems.
Another work describes an adaptive model for
the life cycle of a bug report identifying in the time
to resolution a good measure of its quality
(Hooimeijer and Weimer, 2007). The authors
highlight how writing a good bug report is
complicated, and have to deal with poorly written
report increases the resolution time. Knowing how
the quality of an Issue impacts the overall lifecycle
encourages users to submit better reports
(Hooimeijer and Weimer, 2007).
Aranda and Venoila (Aranda and Venolia, 2009)
examined the communication between the
developers of bug reports in Microsoft and observed
that many bugs are discussed before they are
reported and this information is not stored within the
Issue Tracker. However, in open source projects,
many bugs are discussed in the bug tracking systems
(or mailing list) to ensure transparency and to
encourage developers who are geographically
distant.
Different works in the literature use bug reports
to automatically assign a bug to the developers
(Anvik et al., 2006), identify duplicate bugs (Jalbert
and Weimer, 2008) while others define guidelines
for assessing the severity of a bug (Menzies and
Marcus, 2008). Schroter et al. (Schroter et al.,
2010) showed the importance of the Stack Trace for
developers when they have to fix a bug.
Antoniol et al. (Antoniol et al., 2004) (Antoniol
et al., 2008) indicate the lack of integration between
the system of versioning and bug tracking system
which makes it difficult the location of the fault
within the system software, also in (Antoniol et al.,
2008) it is discussed that not all the bugs are
software problems but many indicate requests for
improvements.
Ko et al. (Ko et al., 2006) in order to design new
systems for reporting bugs have conducted a
linguistic analysis on the securities of the bug report.
They observed numerous references to software
entities, physical devices or user actions, suggesting
that the future system of systems Bug Tracking will
be to collect data in a very structured way.
Not all bug reports are generated by humans,
many systems of auto-detection of the bugs can
report safety violations and annotate them with
counter examples. Weimer (Weimer, 2006) presents
an algorithm to build patches automatically as it
shows that the report accompanied by patches have
three times more likely to be localized within the
code with respect to a standard report. Users can
also help developers fix bugs without depositing the
bug report, for example, many products
automatically report information on the crash such
as Apple CrashReporter, Windows Error Reporting,
Gnome BugBuddy.
Hooimejer and Weimer (Hooimeijer and
Weimer, 2007) proposed a descriptive model of
quality bug reports based on statistical analysis of
over 27,000 reports related to the open source
project Mozilla Firefox. The model is designed to
predict if a bug is fixed within a time limits in order
to reduce the cost of bug triage. It leads the
implications on the bug tracking system highlighting
the features to be added when creating a bug report.
The model proposed by Hooimejer and Weimer
(Hooimeijer and Weimer, 2007) classifies bug
reports based on the characteristics that can be
extracted by the same bug report excluding features
that require to compare the report with earlier
reports, such as the similarity of the text. The
features of the model includes the Severity, the
Readability Measures, and Submitter Reputation.
Finally, the authors consider the number of
comments made in response to the bug and the
number of attachment. The results presented show
that the bug with high number of comments are
resolved in less time. Furthermore, the measure of
readability indicated that the bugs fixed in a short
time are easy to understand and highly readable.
Finally the results of Hooimejer Weimer and
(Hooimeijer and Weimer, 2007) show that some
characteristics, contrary to what is believed, have no
significant effect on the model, such as the severity
of the bug.
A significant contribution to the quality of bug
reports was provided by the work of Zimmermann et
al. (Zimmermann et al., 2010), where is defined a
quality model of a bug report.
Zimmermann et al. (Zimmermann et al., 2010)
propose a quality model for bug reports in order and
implemented a prototype that helps users to insert
the appropriate information while reporting a bug.
Bug Report Quality Evaluation Considering the Effect of Submitter Reputation
195

The work is based on a survey involving developers
and users. The survey carried out by the authors
shows clearly a mismatch between what the
developers believe important to fix a bug and what
they consider important reporters. On the other hand
the developers point out that the real problem for the
resolution of a bug is not wrong information but
rather the lack thereof. Moreover, the difference in
perspective between developers and reporters leads
to knowledge of different quality.
The model proposed in this paper is even
composed of a number of attributes each associated
to a score that can be binary (for example the
attachment are present or not) or a scalar (such as
readability): itemization; Completeness. The main
difference with the other approaches already
proposed in the literature is the use of Reputation.
This feature is specifically investigated comparing
four different metrics for its evaluation. The
readability has been calculated with the help of
several indices such as: Kincaid, SMOG, Flesh, Fog.
The features described above have been merged to
create a model from a bug report returns its quality.
Several models have been evaluated. The following
of the paper describes the construction of the model
the precision obtained by models built in the testing
phase.
3 A CLASSIFICATION MODEL
FOR BUG REPORT QUALITY
This section describes the classification model for
the evaluation of the bug report quality. As
previously mentioned, the model, is made up
considering different attributes relevant for
establishing the quality level of a bug report. Some
of these attributes are derived from information
extracted directly from the text of the report (for
example, the completeness), while others are related
to the Issue (for example, the number of
attachment). Overall, the proposed bug report
quality model is constructed considering the
following attributes: Completeness; Readability,
Reputation, Structure.
The following of this section, explains the
considered attributes in order to allow the reader a
proper understanding of the model defined;
describes the validation data set; and presents the
classification model.
3.1 Attributes Considered for the
Model
The considered attributes for the definition of the
classification model are the following:
Completeness. It refers to the information
contained in the description in the bug report. This
attribute entails the evaluation of the following
second level attributes:
1. Steps. Indicating the presence of step to
reproduce the problem in the description of
the bug report;
2. Build. Considering the presence of build
information, such as the operating system on
which the problem occurred, in the
description of the bug report;
3. Elements. Referring to the presence of user
interface elements, such as the menu that
originated the problem;
4. Behavior. Specifying the inclusion of a
description of the expected behaviour, i.e.
what is the behaviour that it expected
following the conclusion of a sequences of
user actions
5. Actions. Indicating the presence of a
description of the action taken for user
interaction such as pressing a button;
Readability. It refers to the quality of the text
written in the description that makes it easy to read
and understand.
Reputation. It refers to the reputation of the
reporter who submits the bug report.
Attachments. It indicates the presence of file
attached to complete the bug report.
Lists. It considers the presence of bullet or
numbered list in the description of the problem.
Length. It refers to the length of the of the
description.
In particular, the completeness is a factors
already considered by Zimmerman et al.
(Zimmermann et al., 2010) that entailed the body of
a Bug Report as composed of set of useful
information to maintainers for problem resolution.
The bug report quality model proposed in this paper,
even considers the completeness. However, a
specific analysis has been performed to compare
models using an aggregate value of completeness,
based on the second level attributes, against models
obtained with the individual second level attributes.
ICSOFT-EA 2016 - 11th International Conference on Software Engineering and Applications
196

The evaluation of the second level attributes of
completeness is performed through a textual analysis
of the Bug Report description. To this aim it has
been necessary to preliminarily construct datasets of
key terms used for assessing the second level
attributes of completeness.
In the conducted study the dataset of
completeness has been constructed considering the
description of about 8578 bug, from two open source
projects such as PrimeFaces and YII.
To perform the textual analysis, preliminarily it
has been decided the removal of stop words using as
a reference the data set provided by WordNets [16].
Then, the words that were present in at least 1% of
the reports have been analyzed and used to construct
5 disjoint sets. These sets have been used for
evaluating the second level attribute of
completeness.
For example, all the terms related to the steps to
reproduce the problem, such as, try, reproduce, step
etc…, have been used to prepare the Steps Dataset.
Similarly the other four Datasets have been
obtained.
Using these sets the Completeness second level
attributes have been evaluated for the Bug Reports
in the case study. This evaluation is relevant in the
proposed model as the analysis is carried out
considering each attribute as a separate sub-factor in
the quality model.
Readability is the second key factor for the
quality of a bug report in proposed model. One can
easily understand how a text highly confusing in the
description of a bug it makes difficult to understand
the problem itself and therefore are stretched time to
resolution of the problem itself.
Currently, there are numerous indexes for the
assessment of the readability that use static
characteristics of the text as the number of words in
a sentence or the number of syllables in a word such
as the SMOG, FOG, FLESCH etc. Moreover, the
Java library "Java Fathom" has been used for the
indexes calculation. This library allows to calculate
these indices according to the original formulas for
an analyzed text.
Then, since the model has been defined with the
objective of analyzing open source projects it has
been decided to consider in addition to the other
attributes of the quality the reputation of the person
who reported the problem. This factor is not related
to the individual Bug Report, but strictly about the
user who reported the problem, so it is calculated
from the set of the Issue of the same project.
In the proposed model different definitions have
been evaluated to assess the reputation. Following
there are the different formulas used:
Rep
A
The reputation is computed as the
ratio between the numbers of bugs fixed between
those reported by a user and the total number of
reports submitted by the same.
=
ℎℎ
ℎ
Rep
B
The reputation is computed as the
ratio between the numbers of bug fixes including
those reported by a user and the total number of
bugs present in the entire project:
=
ℎℎ
ℎ
Rep
C
The reputation is computed as the
ratio between the numbers of bug fixes including
those reported by a user and the total number of
bugs fixed in the whole project:
=
ℎ
ℎ
Rep
D
The fourth and final way is to
calculate the reputation, as the ratio between the
number of bug fixes including those reported by a
user and the total number of reports submitted by the
same increased by one:
=
ℎ
ℎ + 1
In addition to the Completeness, Readability and
Reputation previously described the model has been
completed considering additional factors related to
the structure. These are binary factors and are listed
in the following: presence of attachments (binary);
presence of bulleted or numbered lists (binary);
length of the description (scalar).
3.2 Validating Data Set
The data set used for validating the classification
models has been constructed with the support of
three different users. They were asked to analyze the
bug report extracted from three different project:
They performed a manual inspection of set of bug
report and following a checklist assigned a quality
value to the bug reports. Specifically, 150 Bug
Report extracted for the open source project
PrimeFaces have been analyzed three actors: a
master student, an app developer for IOS, and a
researcher. The actors have been provided with a
checklist that entails the verification of the quality
factors previously described in the analyzed bug
reports. On the basis of the checklist they provided
Bug Report Quality Evaluation Considering the Effect of Submitter Reputation
197
their own evolution assigning a value between 0 and
10.
Then it is computed an average value among the
single quality value reported by the users, and a
quality class is assigned using the ranges reported in
Table1.
In particular, the value of Q(R) obtained has
been classified in the following classes: Very Poor,
Poor, Medium, Good e Very Good on the basis of
the range reported in Table 1.
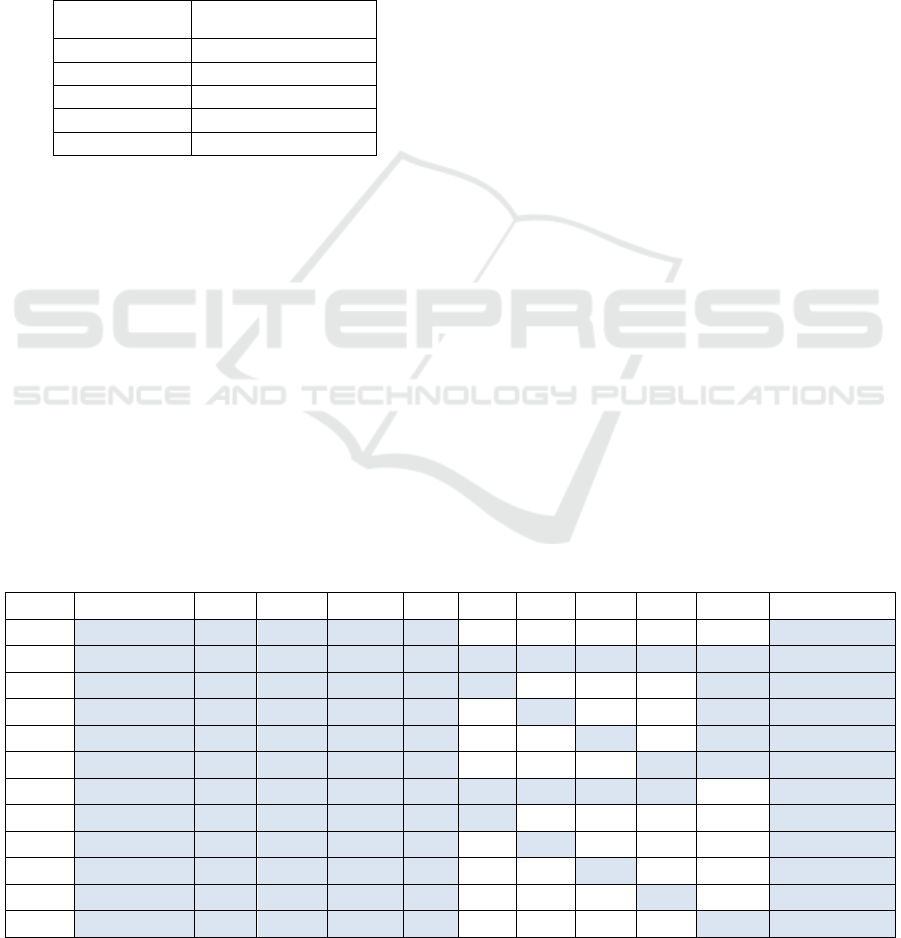
Table 1: Range used for the determination of the bug
report quality class.
Range Quality Class of the
Bug Report
0 ≤ value ≤ 1.9
Very Poor
2 ≤ value ≤ 3.9
Poor
4 ≤ value ≤ 5.9
Medium
6 ≤ value ≤ 7.9
Good
8 ≤ value ≤ 10
Very Good
The validating data set developed has been used
to construct a classifier model useful for predicting
the quality of a bug report. To this aim Weka tool
has been used (
http://www.cs.waikato.ac.nz/ml/weka).
To this aim different classification models have
been considered and compared. The validation of the
models has been performed using the 10 fold cross
validation. The comparison has been performed
organizing the attributes in two separate groups.
The first group compared models considering the
following attributes:
- Completeness: specifically considering each
sub-attribute as a separate elements of the
model;
- Readability: considering the Flesch, Fog and
Kincaid indexes as distinct elements of the
model;
- Attachments availability
- Presence of lists
- Reputation: considering the different definition
of reputations
The above attributes have been used to construct
models using different classification algorithms, and
results have been compared. The classification
algorithms considered are the following:
- RandomTree (TREE)
- RandomForrest (TREE)
- J48 (TREE)
- BayesNet (BAYES)
- Jrip (RULES)
- DTNB (RULES)
- Decorate (META)
- END (META)
- LogitBoost(META)
- Part (RULES)
- FT (TREE)
Successively the some algorithms have been
used to construct a Second Group of models where
the Completeness has been considered as a single
attribute computed with the following formula:
Completeness is computed as:
() =
∗ +
+
+
+
ℎ)
where:
=0,2.
Table 2 reports the composition of the attributes
used to construct the different models compared. 12
models entails the separate values of completeness
attributes, while, 12 additional models considers a
single value of the Completeness second level
attributes.
Table 2: Attributes considered in the different models.
Model Completeness
Flesch Fog Kincaid Lists Rep
A
Rep
B
Rep
C
Rep
D
Length Attachments
M1
√ √ √ √ √
√
M2
√ √ √ √ √ √ √ √ √ √ √
M3
√ √ √ √ √ √
√ √
M4
√ √ √ √ √
√
√ √
M5
√ √ √ √ √
√
√ √
M6
√ √ √ √ √
√ √ √
M7
√ √ √ √ √ √ √ √ √
√
M8
√ √ √ √ √ √
√
M9
√ √ √ √ √
√
√
M10
√ √ √ √ √
√
√
M11
√ √ √ √ √
√
√
M12
√ √ √ √ √
√ √
ICSOFT-EA 2016 - 11th International Conference on Software Engineering and Applications
198
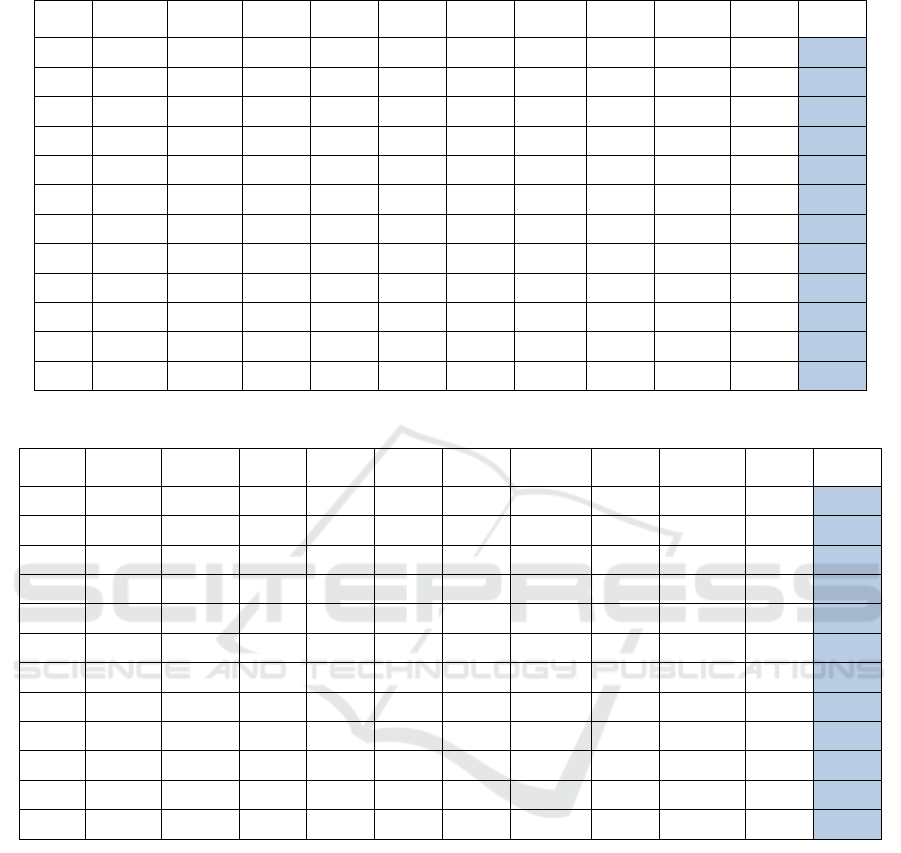
Table 3: Results of classification algorithms - First Group.
Model
Random
Tree
Random
Forrest
J48
Bayes
net
Jrip
rules
DTNB Decrote END LgitBoos Part FT
M1 61.33% 72.00% 72.00% 69.33% 58.66% 63.33% 71.33% 71.33% 73.33% 71.33% 76.33%
M2 57.33% 70.66% 71.33% 66.66% 53.33% 65.33% 72.66% 76.66% 67.00% 68.00% 75.33%
M3 62.66% 72.66% 72.00% 68.00% 51.33% 64.00% 76.66% 76.00% 62.00% 66.66% 72.66%
M4 65.33% 74.66% 71.33% 68.00% 52.00% 64.66% 72.66% 72.66% 66.00% 72.00% 75.33%
M5 66.66% 73.33% 70.66% 68.00% 56.00% 64.66% 72.66% 72.00% 68.00% 72.00% 76.00%
M6 66.66% 73.33% 70.66% 68.00% 56.00% 64.66% 72.66% 74.00% 70.00% 70.66% 73.33%
M7 64.00% 72.00% 71.33% 66.67% 59.33% 64.00% 72.00% 71.33% 72.00% 69.33% 76.00%
M8 64.66% 71.33% 72.00% 69.33% 60.66% 66.33% 74.00% 74.66% 68.00% 69.33%
77.33%
M9 58.00% 69.33% 71.33% 68.66% 57.33% 64.00% 72.66% 70.66% 70.66% 69.33% 76.00%
M10 60.00% 68.00% 70.00% 68.66% 55.33% 64.00% 71.33% 71.33% 73.33% 69.33%
77.33%
M11 64.66% 73.33% 72.66% 68.66% 64.00% 64.00% 72.00% 73.33% 72.66% 70.00% 76.66%
M12 63.00% 71.33% 72.00% 68.00% 54.00% 64.00% 68.00% 71.33% 62.66% 72.00% 74.66%
Table 4: Results of classification algorithms - Second Group.
Model
Random
Tree
Random
Forrest
J48
Bayes
net
Jrip
rules
DTNB Decrote END LgitBoos Part FT
M1 61.33% 67,00% 68,00% 66.66% 65.33% 70,00% 67.33% 66,00% 67.33% 69.33% 69.33%
M2 60.66% 68,00% 70.66% 68,00% 56.66% 65.33% 70.66% 68.66% 68,00% 66,00% 70.66%
M3 61.33% 68.66% 69,00% 68,00% 59.33% 69,00% 69.33% 69,00% 65,00% 68,00% 72.66%
M4 62.66% 68.66% 66.67% 67,00% 57,00% 66,00% 65.33% 65.33% 69,00% 63,00% 71.33%
M5 61.33% 68,00% 66,00% 67,00% 53,00% 66,00% 64.66% 65,00% 69,00% 66,00% 71.33%
M6 56.66% 69.33% 66.67% 68,00% 59,00% 68.66% 66.66% 65,00% 67,00% 64.66% 69.33%
M7 61.33% 70,00% 71.33% 67.33% 64.66% 67,00% 70,00% 68,00% 70,00% 68,00% 72,00%
M8 66,00% 70.66% 71,00% 66.66% 68,00% 70,00% 67,00% 68,00% 69,00% 70,00% 73,00%
M9 64.66% 66.66% 68,00% 68,00% 63.33% 68,00% 66.66% 67.33% 69.33% 66,00% 66,00%
M10 60.66% 67,00% 67,00% 68,00% 60.66% 68,00% 64.66% 66,00% 70,00% 66.66% 67.33%
M11 60.66% 67.33% 69.33% 66.66% 62,00% 70,00% 66,00% 68.66% 68.66% 67,00% 71.33%
M12 60,00% 67.33% 64,00% 68,00% 59,00% 69,00% 62,00% 65.33% 65.33% 62,00% 71.33%
3.3 Results
The performance of the different models has been
compared using the Precision metric. The results
obtained are reported in Table 3 and 4. The value of
the precision for each model is in the last column. A
relevant aspect, emerging from this table, is that the
models constructed considering individually the
attributes of the completeness are, in most cases
more precise than those considering the
completeness as a single quality attribute.
Furthermore the table highlight that the better
performing attribute for reputation is Rep
A
. The
Table also shows that the best model is the one
defined by the classifier FT obtained from,
corresponding to the models M8 and M10, both with
a value of precision of 77.33%. These models entails
the use of separate attributes for the completeness
and the reputation attribute Rep
A
.
4 BUG REPORT QUALITY TOOL
The evaluation of the quality of the bug reports of a
software project is automatically achieved thought a
software tool, namely, BRQT
OOL Bug Report
Quality Tool.
The BRQTOOL allows the download of all the
Issue related to the selected software project. This
stage is essential for subsequent computation of the
Bug Report Quality Evaluation Considering the Effect of Submitter Reputation
199
different factors used by the classification model for
the evaluation of the bug reports quality.
This feature stores the all the bug reports of the
selected project within the database. This entails the
parsing from the URL of the project and the
gathering of all the information. Moreover, for each
Issue, through the construction of a new url, even the
description is recovered and stored in the database.
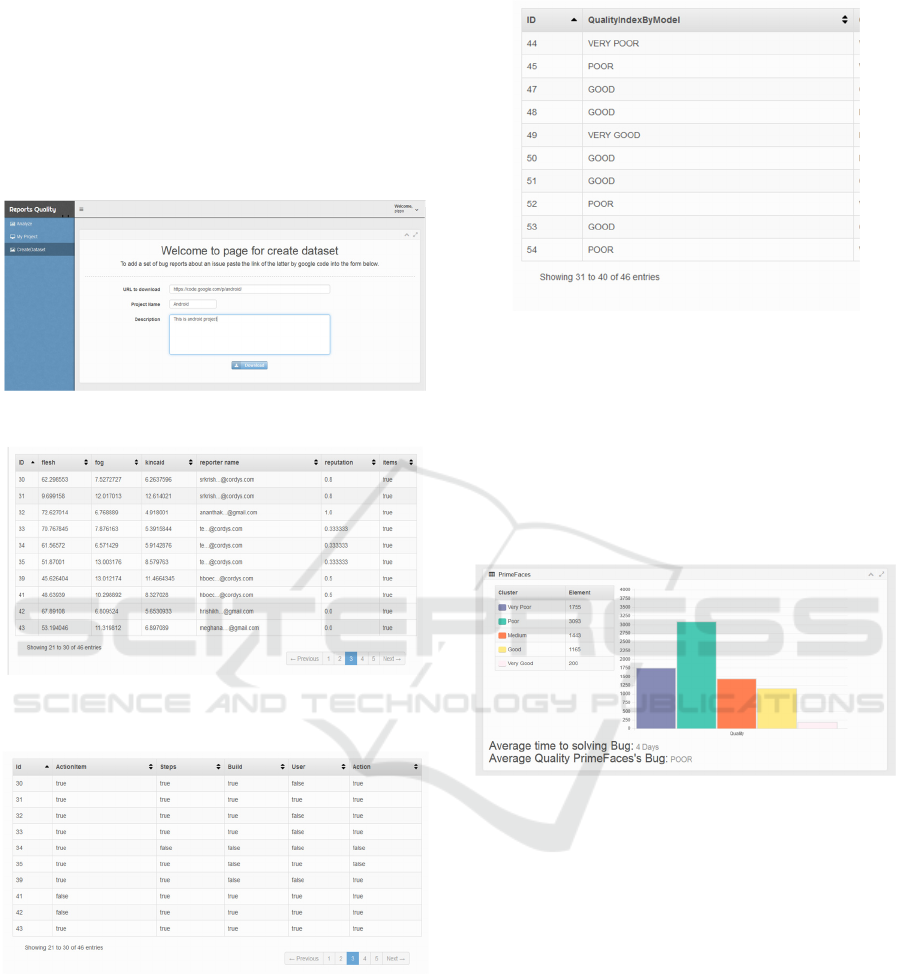
Figure 1: Download performed thought BRQTOOL.
Figure 2: Screenshot of BRQTOOL reporting the results
of the quality attributes.
Figure 3: Screenshot of BRQTOOL reporting the
Completeness quality attributes.
Figure 4: Screenshot of BRQTOOL reporting the results
of the bug reports quality.
Then, the application of the model and the
analysis of the bug reports quality is the main
functionality of BRQT
OOL
.
In particular, it enables
the computation all the considered quality attributes,
and then uses them as input for the evaluation. To
this aim, the model, built in Weka was imported
within the BRQT
OOL
to allow the tool its use.
Figure 5: Screenshot of BRQTOOL reporting an overview
of the obtained results.
Finally, the BRQTOOL returns in output three
separate reports represented as tables:
- the first table contains the quality factors
calculated
- the second table contains predictions on the
quality calculated by the formula and model
- the third table lists the attributes related to
completeness.
The Figures 2, 3 and 4 show the Screenshots of
the results returned by BRQT
OOL
. In particular,
Figure 5 depicts a screenshot of BRQT
OOL
reporting
an overview of the obtained results for PrimeFaces.
ICSOFT-EA 2016 - 11th International Conference on Software Engineering and Applications
200

5 CONCLUSIONS
The Bug Reporting activity is a topic of interest in
software engineering. This is confirmed by the
considerable interest in the literature. However, at
present there are few studies that focus on the
quality of the report exposing a problem.
In this paper it has been described the creation of
a model for the quality Bug Report, specifically
focusing on the identification of the quality
attributes and how to calculate them.
The obtained model for the evaluation of quality
has been incorporated within a software tool, the
BRQT
OOL, that allows users to have an overall
assessment of the reports of an Open Source
software systems, available on the platform Bug
Tracking: Google Code.
The results provided by BRQT
OOL highlights the
importance of managing quality in the Bug Report.
In fact, the future works aim to analyze the effect of
quality of reporting on the time resolution of the
issue, and on the other side the interest of the open
source project communities to the reported Bug.
Actually the reports obtained by BRQT
OOL could
help to solicit Bug Reporter to create reports having,
as far as possible, an high quality.
REFERENCES
Anvik J., Hiew L., Murphy G. C., 2006, Who Should Fix
This Bug?, IEEE Proceedings . 28th Int'l Conf.
Software Eng., pp. 361-370.
Antoniol G., Gall H., Di Penta M., Pinzger M., 2004
Mozilla Closing the Circle, Techncal Report TUV-
1841-2004-05 Technal Univ. of Vienna.
Antoniol G., Di Penta M., Ayari K., Khomh F.,
Guéhéneuc Y.G., 2008, Is It a Bug or An
Enhancement? A Text-Based Approach to Classify
Change Requests., Proceedings of Conference for
Advanced Studies on Collaborative Research, pp. 304-
318.
Aranda J., Venolia G., 2009, The secret life of Bugs:
Going Past the Errors and Omissions in Software
Repositories, Proceedings of the 31st International
Conference on Software Engineering.
Breu S., Premraj R., Sillito J., and Zimmerman T., 2010,
Information Needs in Bug Reports: Improving
Cooperation between Developers and Users, ACM
Proceedings Conf. Computer Supported Cooperative
Work, pp. 301-310.
Goldmerg E, 2010, Bug writing guidelines,
https://issues.apache.org/bugwritinghelp.html.
Hooimeijer P. and Weimer W., 2007, Modeling Bug
Report Quality, IEEE/ACM Proceedings of the
International Conference Automated Software Eng,
pp. 34-43.
Jalbert N., and Weimer W., 2008, Automated Duplicate
Detection for Bug Tracking System, Proceedings.
Conference Dependable System and Networks, pp. 52-
61.
Menzies T., Marcus A., 2008, Automated Severity
Assessment of Software Defect Reports, IEEE
Proceedings of 24th International Conference
Software Maintenance, pp. 346-355.
Schroter A., Bettenburg N., Premraj R., 2010, Do Stack
Trace Help Developpers Fix Bugs?, IEEE Proceedings
of International Working Conference Mining
Software Repositories.
Ko A., Myers B. A., Chau D. H., 2006, A Linguistic
Analysis of How People Desribe Software Problems,
IEEE Proceedings Symposium Visual Languag and
Human-Centric Computing, pp. 127-134.
Weimer W., 2006, Patches as Better Bug Reports,
Proceedings Fifth International Conference
Generative Programming and Component Eng., pp.
181-190.
Zimmermann T., Premraj R., Bettenburg N., Just S.,
Schroter A., Weiss C., 2010, What Makes a Good Bug
Report?, IEEE Transactions on Software Engineering.
Bug Report Quality Evaluation Considering the Effect of Submitter Reputation
201
