
Magnetohydrodynamics Simulation in a Sphere
by Yin–Yang–Zhong Grid
Akira Kageyama
Department of Computational Science, Kobe University, Rokkodai 1-1, Kobe, Japan
Keywords:
Magnetohydrodynamics, Computational Fluid Dynamics, Sphere, Visualization.
Abstract:
For numerical simulations in a sphere, we have recently proposed a new spherical grid system called Yin–
Yang–Zhong grid. The Yin–Yang–Zhong grid is composed of three components—Yin, Yang, and Zhong—
that are combined to cover a spherical region with partial overlaps on their borders. Mutual interpolations
are applied to sew the components together, following the overset grid methodology. We review the idea of
the Yin–Yang–Zhong grid and its applications to magnetohydrodynamics (MHD) simulations in a sphere. We
also present visualization methods employed to analyze the Yin–Yang–Zhong simulations.
1 INTRODUCTION
Magnetohydrodynamics (MHD) is a theory for elec-
trically conducting fluid flows (Davidson, 2001).
Computer simulations of MHD in spheres are im-
portant in astro- and planetary physics because many
stars and planets have electrically conducting fluids in
their bodies.
One of the most popularly used methods to dis-
cretize the basic equations of MHD, i.e., MHD equa-
tions, in the spherical geometry is the spectral meth-
ods in which physical variables are expanded by or-
thonormal functions defined by the spherical harmon-
ics. The time development of a set of mode ampli-
tudes is numerically integrated. In this kind of spec-
tral approach, it is common that nonlinear terms ap-
pearing in the equations are calculated in the real
space as products, to avoid the costly computations
of convolutions in the spectral space. This approach,
called the pseudo-spectral approach, requires trans-
formations of variables between the real space and the
spectral space every time step. There is, however, no
de facto standard of “fast” algorithm for the spher-
ical harmonics transformations for massively paral-
lel computers. It means that the computational speed
of the spherical harmonics expansion method does
not linearly scale as functions of the maximum mode
number, i.e., spatial resolution, and the processor
number used in the parallel computation.
On the other hand, the grid-based approaches, that
are exemplified by the finite difference method and
the finite volume method, are relatively easy to at-
Figure 1: Yin–Yang–Zhong grid. Three component grids,
Yin, Yang, and Zhong, are combined to cover a full sphere
including the origin. The overset grid method is used to
stitch up the three component grids together.
tain the linear scaling in massively parallel computa-
tions. However, it is impossible to discretize a sphere
with a structured grid system without a coordinate
singularity. Take the spherical polar coordinate sys-
tem (r, ϑ, ϕ), for example, where r, ϑ, and ϕ are the
radius, colatitude, and longitude. It has two types of
coordinates singularities: One is at the poles (ϑ = 0
and π) and the other is at the origin (r = 0).
The coordinate singularity itself is not a serious
problem because one can always apply L’Hˆopital’s
rule to convert an equation on a coordinate singular-
ity into a non-singular form. The challenge resides
around a coordinate singularity, rather than on it. In
a structured grid system, a coordinate singularity in-
evitably leads to a nearby concentration of grid points
Kageyama, A.
Magnetohydrodynamics Simulation in a Sphere by Yin–Yang–Zhong Grid.
DOI: 10.5220/0005978302390243
In Proceedings of the 6th International Conference on Simulation and Modeling Methodologies, Technologies and Applications (SIMULTECH 2016), pages 239-243
ISBN: 978-989-758-199-1
Copyright
c
2016 by SCITEPRESS – Science and Technology Publications, Lda. All rights reserved
239

which degrades computational efficiency, especially
when one uses an explicit scheme for temporal inte-
gration. The Courant–Friedrichs–Lewy (CFL) condi-
tion (de Moura, 2012) imposes an impractically se-
vere limit on the time step due to the small grid spac-
ings. Even if an implicit time integration scheme is
used, the grid concentration implies unphysical high
resolution of the numerical accuracy around there.
We proposed a grid system, Yin–Yang grid, to
avoid the coordinate singularities on the poles of
the spherical polar coordinates (Kageyama and Sato,
2004; Kageyama, 2005). The Yin–Yang grid is a kind
of the overset grid (Chesshire and Henshaw, 1990)
that is applied to the spherical geometry. It has two
congruent grid elements—Yin and Yang—that are
combined to cover a two-dimensional spherical sur-
face or a three-dimensionalspherical shell volume be-
tween two concentric spheres.
We have applied the Yin–Yang grid to geody-
namo simulations (Kageyama et al., 2008; Miyagoshi
et al., 2010), solar dynamo simulations (Masada et al.,
2013; Mabuchi et al., 2015), and mantle convection
simulations (Kameyama et al., 2008). The Yin–Yang
grid is also used in other fields and by other groups,
from geophysics to astrophysics, from climate mod-
els to image proccessings. The spherical tessellation
problem (Yan et al., 2016) would be one of the most
promising applications in future in which the Yin–
Yang grid is potentially useful.
While the Yin–Yang grid system avoids the coor-
dinate singularities at the poles (ϑ = 0 and π), an-
other singularity at the origin (r = 0) is laid aside.
Yin–Yang simulations have, therefore, a “cavity” at
the center of the sphere, unless some symmetries are
assumed on the solutions at r = 0.
We have recently proposed an overset grid sys-
tem, Yin–Yang–Zhong grid, for the spatial discretiza-
tion of a full sphere, or a ball, including the ori-
gin (Hayashi and Kageyama, 2016). The Yin–Yang–
Zhong grid has three components; Yin, Yang, and
Zhong (see Figure 1). The new component grid
(Zhong) is a set of cuboid blocks based on the Carte-
sian grid. (“Zhong” stands for “center” in Chinese
language.) The Zhong grid component is placed to
cover the “cavity” of the Yin–Yang grid. The three
component grids cover the full sphere with partial
overlaps on their borders. The boundaries are sewed
together by mutual interpolations, following the gen-
eral overset grid methodology (Chesshire and Hen-
shaw, 1990). We performed a couple of valida-
tion tests of the Yin–Yang–Zhong grid (Hayashi and
Kageyama, 2016). For example, we compared damp-
ing rates of various eigenfunctions of the diffusion
equation in a sphere with analytical solutions.
The Yin–Yang–Zhong grid is a straightforward
extension of the Yin–Yang grid, by just adding a new
component grid (Zhong) at the center. Therefore, it is
relatively easy to modify an existing Yin–Yang code
into a Yin–Yang–Zhong code.
In the following, we summarize our recent appli-
cations of the Yin–Yang–Zhong grid for MHD simu-
lations in a sphere. We then briefly review visualiza-
tion methods that we have developed for those simu-
lations.
2 SIMULATIONS OF MHD IN A
SPHERE
2.1 MHD Relaxation in a Sphere
MHD relaxation is a fundamental process in MHD
physics. When an MHD fluid with a magnetic field
is placed in a vessel (with no initial flow), the MHD
system shifts spontaneously toward another state if
the initial state is unstable. After a short period of
transition, the system calms itself down to a quasi-
equilibrium state. This process is called MHD relax-
ation (Ortolani and Schnack, 1993). Various plasma
experiments show surprisingly good agreements with
a relaxation theory proposed by Woltjer (Woltjer,
1958) and Taylor (Taylor, 1986). Although plasma
instabilities, and therefore flows, play essential roles
in the Woltjer-Taylor theory, the flow velocity is as-
sumed to be absent in the relaxed state in the theory.
Figure 2: Streamline visualization of the flow of a quasi-
stationary state of an MHD relaxation simulation in a
sphere. The color denotes the velocity amplitude (blue to
red for slow to fast). The simulation is performed using the
Yin–Yang–Zhong grid.
We have performed an MHD simulation inside a
sphere using the Yin–Yang–Zhong grid to investigate
the MHD relaxation processes that has a flow in the
relaxed state. Figure 2 shows streamlines in a relaxed
state obtained by the simulation. The quasi-stationary,
relaxed state has both the magnetic field and flow field
SIMULTECH 2016 - 6th International Conference on Simulation and Modeling Methodologies, Technologies and Applications
240

with the same levels of energy; this is a solution be-
yond the Woltjer-Taylor theory.
2.2 MHD Convection in a Thin Shell
We have also performed an MHD simulation of ther-
mal convection in a thin spherical shell layer with the
Yin–Yang–Zhong grid. The layer is between two con-
centric spheres of radii r = 0.9 and r = 1.0, whose
temperatures are kept hot and cold, respectively. A
central gravity toward the center is assumed. The pur-
pose of this simulation is to investigate the pattern for-
mation of the MHD convection and the MHD dynamo
effect by the flow. (The MHD dynamo is an energy
conversion process from the flow’s kinetic energy into
the magnetic energy through the electromagnetic in-
duction effect.)
Figure 3: A flow pattern of thermal convection of an MHD
fluid in a thin spherical shell. It shows the radial component
of the flow at the average radius of the shell. Magnetic field
is generated by this convection flow and the magnetic field
diffuses into the inner conductive sphere under the convec-
tion layer.
The MHD convectionexhibits a roll-like pattern in
the spherical shell as shown in Figure 3. The Zhong
grid component is critically important in this simu-
lation because the dynamo-generated magnetic field
diffuses into the inner sphere of r ≤ 0.9, in which we
solve the diffusion equation for the magnetic field on
the Zhong grid.
Magnetic field is generated by the MHD dynamo
action by the flows in the convection rolls. Drawing
magnetic field lines, we have found that they wind
around the rolls and the magnetic energy is converted
from the flow’s kinetic energy through the work done
by the flow against the field line tension force in the
windings. Generated magnetic energy is concentrated
in dislocations of the columns, i.e., the Y–shaped
forks of the rolls in Fig. 3. The field lines are an-
chored to the inner core.
3 VISUALIZATIONS OF MHD IN
A SPHERE
As in other simulations, data visualization is a crucial
step in analyzing the Yin–Yang–Zhong simulations.
Visualization methods are, in general, divided into
two categories, i.e., post-process visualization and co-
process visualization. A post-process visualization is
applied to numerical data that are saved to a disk drive
system after a simulation job. A co-process visualiza-
tion is, on the other hand, applied while a simulation
is running. The output data of the co-process visual-
ization is a set of images.
3.1 Post-process Visualization on
Supercomputer
We use Armada as a post-process visualization tool.
Armada was originally developed by N. Ohno for
Yin–Yang simulation data. We have recently im-
proved this program so that it can visualize Yin–
Yang–Zhong data, too. Armada is a software ren-
dering program that is parallelized with MPI and
OpenMP. Visualization methods implemented in Ar-
mada are volume rendering, contour colors on cross
sections, vector glyphs, and stream tubes. Since it
does not need GPU (Graphics Processing Unit), we
can execute Armada on general supercomputers. Fig-
ure 4 shows sample snapshots of the visualization by
this software.
Figure 4: Post-process visualizations by Armada. Armada
is a parallel visualization program with volume rendering
(left), isosurface (middle), vector arrow glyphs (right), and
other visualization methods.
3.2 Co-process Visualization using
ParaView
In the post-process visualizations, we need to save
three-dimensional numerical data for the visualiza-
tion. The required storage size and the network band-
width degrade the usefulness of the post-process vi-
sualization. As a result, another approach to the visu-
alization, i.e., co-process visualization, is getting at-
tentions of simulation researchers these days.
Magnetohydrodynamics Simulation in a Sphere by Yin–Yang–Zhong Grid
241
ParaView
1
is one of the most popularly used gen-
eral purpose visualization programs. Although it is
basically for post-process visualizations, ParaView
can also be used for co-processvisualizations by mak-
ing use of a special library called Catalyst
2
. We use
ParaView/Catalyst as a co-process visualization tool
to analyze Yin–Yang–Zhong simulations. Shown in
Figure 5 are sample snapshots of movies obtained
by this approach. This is a powerful approach for
the visualization of large scale parallel simulations
since ParaView has a rich set of advanced visualiza-
tion methods.
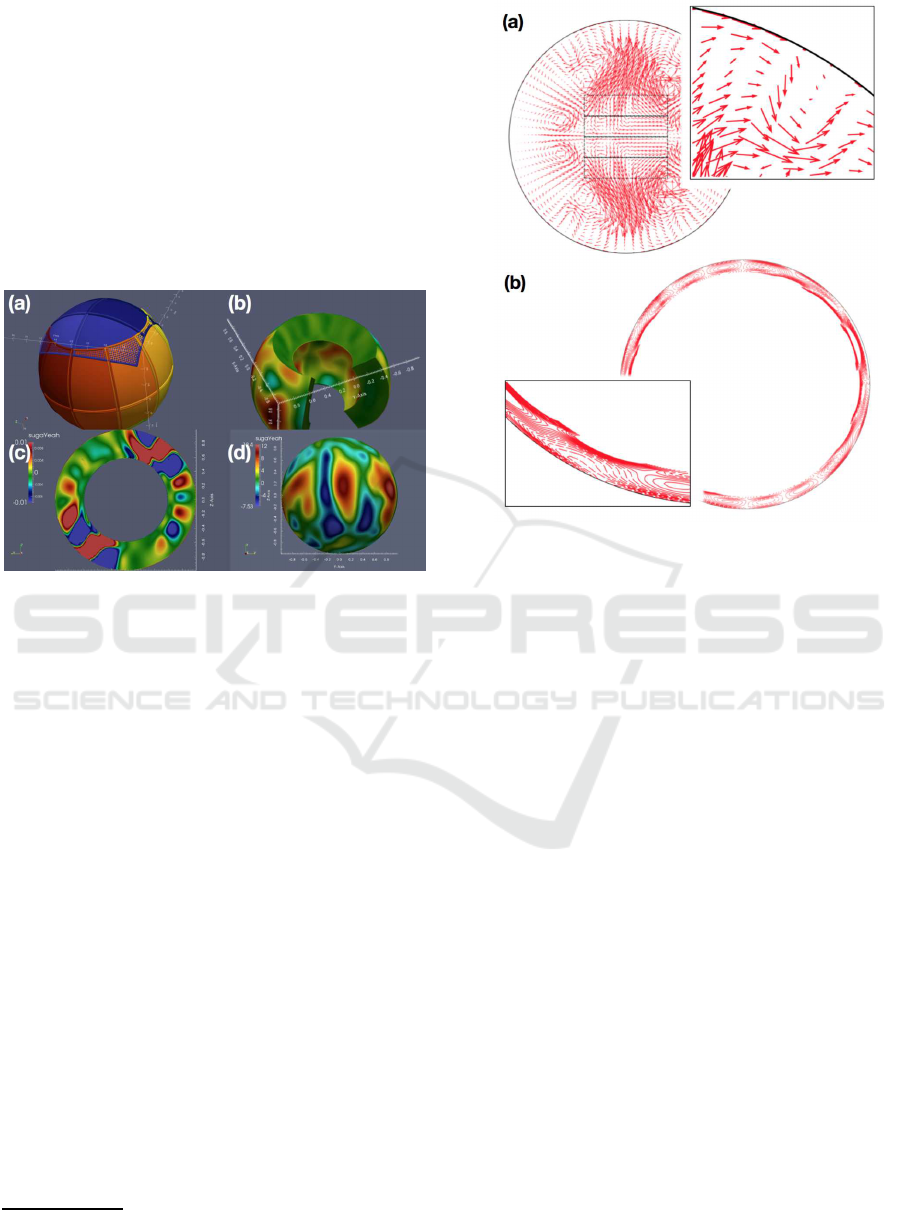
Figure 5: Snapshots of visualization movies taken by
co-process visualizations of an MHD simulation by Par-
aView/Catalyst. (a) Allocations of MPI process in the sim-
ulation & visualization. (b) Vorticity amplitude in the Yin
grid component. (c) Vorticity amplitude in the equatorial
plane. (d) Vorticity amplitude in a sphere.
3.3 Co-process Visualization by Vector
Graphics Format
We have also developed our original co-process
visualization tool that is much simpler than Par-
aView/Catalyst. The tool, insitu2d, is implemented
as a Fortran90 module. It visualizes only two-
dimensional cross sections (the equatorial plane and
meridian planes) of Yin–Yang–Zhong grid simula-
tions. Consequently, it enables us to perform a quick
rendering without damaging the simulation speed.
The output images of insitu2d are stored in EPS
(Encapsulated PostScript) format. We can magnify
the images keeping sharp outlines thanks to the vector
graphics format of EPS. Sample figures of insitu2d
visualizations are shown in Figure 6.
1
http://www.paraview.org
2
http://www.paraview.org/in-situ/
Figure 6: Co-process visualization of MHD simulations by
our original tool insitu2d. (a) A meridional cross section
of the MHD relaxation simulation presented in Section 2.1.
(b) An equatorial cross section of the MHD simulation pre-
sented in Section 2.2.
4 CONCLUSIONS
We have recently proposed a new overset grid system,
Yin–Yang–Zhong grid, for numerical simulations in
a sphere (Hayashi and Kageyama, 2016). The Yin–
Yang–Zhongis an extension of the Yin–Yang grid that
is for the spherical shell geometry between two con-
centric spheres. In many cases, Yin–Yang simulations
have a cavity at the center of the sphere because of the
coordinate singularity at the origin r = 0. The Zhong
component grid is placed to cover the cavity region.
Three component grids (Yin, Yang, and Zhong) are
combined to cover a full sphere with partial overlap
between them on the borders that are stitched by mu-
tual interpolations based on the standard overset grid
method. The Yin–Yang–Zhonggrid enables us to per-
form a simulation in a full sphere without any care
about the severe CFL conditions caused by concen-
trated points.
We presented in this paper two MHD simulations
as application examples of the Yin–Yang–Zhonggrid:
One is MHD relaxation simulation, and the other is
MHD convection simulation in a sphere. For three-
dimensional visualizations of those simulations, we
use Armada for post-process visualizations and Par-
SIMULTECH 2016 - 6th International Conference on Simulation and Modeling Methodologies, Technologies and Applications
242

aView/Catalyst for co-process visualizations. For
two-dimensional, co-process visualizations, we have
developed a simple and concise library, insitu2d.
The combination of the Yin–Yang–Zhong grid
and the specially designed visualization tools for the
grid system will be useful for various simulations in
the sphere.
ACKNOWLEDGEMENTS
This work was carried out with graduate students,
Kohei Yamamoto (§ 2.1), Takuya Furuzono (§ 2.2),
Arata Suga (§ 3.2), and Takashi Shimizu (§ 3.3).
Simulations reported in this paper were performed
on Earth Simulator (NEC SX-ACE) at JAMSTEC,
Plasma Simulator (Fujitsu FX100) at NIFS, and π–
computer (Fujitsu FX10) at Kobe University. This
work was supported by Grant-in-Aid for Scientific
Research (KAKENHI) 23340128.
REFERENCES
Chesshire, G. and Henshaw, W. D., 1990. Composite over-
lapping meshes for the solution of partial differential
equations. J. Comput. Phys., 90(1):1–64.
Davidson, P.A., 2001. An Introduction to Magnetohy-
drodynamics. Cambridge University Press, ISBN:
0521794870.
de Moura, C.A. and Kubrusly, C.S., ed., 2012. The
Courant–Friedrichs–Lewy (CFL) condition—80
Years After Its Discovery. Springer Science &
Business Media, ISBN:0817683941.
Hayashi, H. and Kageyama, A., 2016. Yin-Yang-Zhong
grid: An overset grid system for a sphere. J. Com-
put. Phys., 305: 895-905 .
Kageyama, A., 2005. Dissection of a sphere and Yin-Yang
grids. J. Earth Simulator, 3:20–28.
Kageyama, A., Miyagoshi, T., and Sato, T., 2008. Forma-
tion of current coils in geodynamo simulations. Na-
ture, 454(7208):1106–9.
Kageyama, A. and Sato, T. 2004. “Yin-Yang
grid”: An overset grid in spherical geome-
try. Geochemistry, Geophysics, Geosystems, 5,
doi:10.1029/2004GC000734.
Kameyama, M., Kageyama, A., and Sato, T. 2008.
Multigrid-based simulation code for mantle convec-
tion in spherical shell using Yin-Yang grid. Phys.
Earth Planet. Inter., 171:19-32.
Mabuchi, J., Masada, Y., and Kageyama, A., 2015. Dif-
ferential rotation in magnetized and non-magnetized
stars. Astrophys. J., 806(1):10.
Masada, Y., Yamada, K., and Kageyama, A., 2013. Ef-
fects of penetrative convection on solar dynamo. As-
trophys. J., 778(1):11.
Miyagoshi, T., Kageyama, A., and Sato, T. 2010. Zonal flow
formation in the earth’s core. Nature, 463(7282):793–
6.
Ortolani, S. and Schnack, D. D., 1993. Magnetohydrody-
namics of plasma relaxation. World Scientific, Singa-
pore., ISBN:981020860X
Taylor, J. B., 1986. Relaxation and magnetic reconnection
in plasmas. Reviews of Modern Physics, 58(3):741.
Woltjer, L., 1958. A theorem on force-free magnetic fields.
Proc. Natl. Acad. Sci. USA, 44(6):489–91.
Yan, J., Song X., and Gong, G. 2016. Averaged ratio be-
tween complementary profiles for evaluating shape
distortions of map projections and spherical hierarchi-
cal tessellations. Computers & Geosciences, 87:41-
55.
Magnetohydrodynamics Simulation in a Sphere by Yin–Yang–Zhong Grid
243
