
Coverage Range Analysis of Wireless Technologies for Industrial
Automation
System Overview and Performance Evaluation
Armin Wulf, Lisa Underberg and Rüdiger Kays
Communication Technology Institute, TU Dortmund University, Otto-Hahn-Str. 4, 44221 Dortmund, Germany
Keywords:
Coverage Range, Error Rates, FHSS, Industrial Communication, PSSS, UWB.
Abstract:
Reliable wireless communication is crucial to current and future industrial applications, but is however not
yet applicable in many scenarios. Thus novel approaches are being investigated at the moment, from which
three physical (PHY) layer technologies are depicted for detailed evaluation in this paper. Preceding the
performance analysis, industrial application requirements and constraints as spatial extent, number of nodes,
cycle time, PER and user data length are summarized. Error rates and coverage ranges are calculated and
presented for Ultra Wide Band (UWB), Frequency Hopping Spread Spectrum (FHSS) and Parallel Sequence
Spread Spectrum (PSSS) assuming an AWGN channel.
1 INTRODUCTION
Currently wired fieldbus systems are employed in in-
dustrial applications due to their deterministic per-
formance, although they entail high installation and
maintenance efforts. Thus wireless communication is
desirable, since it offers advantages regarding flexi-
bility, mobility and retrofitting. Nevertheless, most
wireless communication systems do not yet meet the
applications’ requirements in determinism and qual-
ity of service. In order to overcome these challenges,
novel wireless solutions are being developed at the
moment. The applications are often categorized by
field of operation and major requirements like num-
ber of nodes, cycle time, Packet Error Rate (PER) and
user data length. Based on the resulting categories,
wireless systems have to be scaled for each field of
application, and the choice of the physical layer tech-
nology is an important consideration in this context.
Though the definition of application categories is
of vital significance for a successful system design,
it is not consistent in industry, research and standard-
ization resulting in diverse specifications. Moreover,
currently no de facto standard is established. Thus in-
dustrial requirements are investigated and aggregated
in section 2. UWB, FHSS and PSSS are shortly intro-
duced as promising wireless approaches in section 3
and discussed regarding their suitability in terms of
error rates and coverage range in section 4. Summary
and prospect on further work are given in section 5.
2 INDUSTRIAL ENVIRONMENT
Summarizing industrial application categories, a sur-
vey on their requirements is given in this section.
These requirements comprise network size, environ-
ment and topology, safety as well as timing limita-
tions. Moreover, possible frequency ranges are pre-
sented and reviewed regarding regulatory aspects.
The summary reveals challenging conditions for
wireless industrial communication in all application
categories. As a result physical layer concepts must
be chosen carefully regarding reliability and coexis-
tence aspects.
2.1 Application Requirements
The requirements of industrial applications vary
broadly and are commonly classified into three cat-
egories to ease considerations: Factory Automa-
tion (FA), Process Automation (PA) and Condition
Monitoring (CM). In a factory environment the spatial
extent as well as the number of nodes are evidently
small, whereas the reliability and safety requirements
are very strong. Typically closed-loop communica-
tion systems with soft or hard real time requirements
are employed here. In contrast to this, CM has a wide
spatial extent and lower safety and timing require-
ments in its sensor network, which has no control
but only monitoring purposes. PA is typically associ-
ated with chemical processing plants, which have an
74
Wulf, A., Underberg, L. and Kays, R.
Coverage Range Analysis of Wireless Technologies for Industrial Automation - System Overview and Performance Evaluation.
DOI: 10.5220/0005971600740083
In Proceedings of the 13th International Joint Conference on e-Business and Telecommunications (ICETE 2016) - Volume 6: WINSYS, pages 74-83
ISBN: 978-989-758-196-0
Copyright
c
2016 by SCITEPRESS – Science and Technology Publications, Lda. All rights reserved

Table 1: Application requirements overview. (ETSI, 2011), (ZVEI, 2009), (VDI/VDE, 2007), (Güngör, 2013) (Frotzscher
et al., 2014).
Property FA PA CM
Maximum spatial extent 10 m × 10 m ×3 m 100 m × 100 m ×10 m 1000 m × 1000 m × 50 m
Nodes per system 30 100 1000
Nodes per m
2
0.3 0.01 0.001
Number of coexistent systems 10 5 5
Number of locally parallel nodes 300 500 250
Network topology Star Star/Mesh Mesh
Cycle time <1 ms >10 ms >100 ms
PER <10
−9
<10
−4
<10
−3
Battery lifetime <1 year 5 – 10 years >10 years
User data length <30 Byte 30 – 1500 Byte <1500 Byte
System data rate >7.2 Mb/s <2.4 – <120 Mb/s <120 Mb/s
intermediate spatial dimension and also intermediate
safety and timing requirements. Often PA comprises
mostly monitoring tasks with few control processes.
Depending on the very deployment, the topology is
typically either a star or a mesh network as shown in
figure 1.
In FA, a star topology provides a good basis for
the small spatial extent combined with shortest cycle
times and high data rate. A typical industrial scenario
is a production cell, in which sensors and actuators
both interact on a real time basis. In a CM applica-
tion, sensors mostly collect data, which need to be
transmitted over long distances due to the big spatial
dimension, whereas timing requirements are low.
Thus here a mesh topology with multi-hop trans-
missions is employed. In case of a star topology, the
coexistence of multiple communication structures is
required, which both means the coexistence of dif-
ferent systems (inter-system-coexistence) and the co-
existence of different star topologies employing the
same technology (intra-system-coexistence).
Table 1 shows major properties of these three cat-
egories compiled from various publications. (ETSI,
2011) lists requirements of communication in manu-
facturing cells, factory halls and on plant level. Typi-
cally FA is employed in manufacturing cells, whereas
communication on factory hall scale is congruent with
PA properties. Communication on plant level is a
subset of CM, but is generally matching CM require-
ments. Spatial extent, nodes per system, number of
Star topology Mesh topology
Figure 1: Typical topologies in industrial environments.
coexistent systems, number of locally parallel nodes
and the network topologies are taken from this report.
Nodes per m
2
is calculated based on these values.
Similar categories are investigated in (VDI/VDE,
2007), from where cycle time and user data lengths
values are taken. They are congruent with require-
ments specified in (Frotzscher et al., 2014), where
three closed-loop systems (machine tools, printing
and packaging machines) are listed with their require-
ments in number of nodes, packet size, cycle time
and jitter. Limits for packet error rates are defined
in (ZVEI, 2009), which discusses primarily coexis-
tence issues regarding wireless industrial communi-
cation. The system data rate is calculated based on
number of nodes and user data lengths.
Today in the fields of FA and PA established wired
fieldbus systems based on Ethernet are employed due
to the strict deterministic performance of these wired
communication systems. In contrast to that, CM re-
cently emerged in terms of machine-to-machine com-
munication and the Internet of Things (IoT), because
wired systems cannot yield the required flexibility.
For all three categories wireless communication is de-
sirable and enables a raise of efficiency while reduc-
ing installation and maintenance efforts.
2.2 Frequency Ranges for Industrial
Communication
At this time there are no dedicated frequency ranges
for wireless industrial communication, thus Indus-
trial, Scientific, and Medical (ISM) bands have
to be used, which offer three relevant frequency
bands: Sub-1 GHz (868 MHz in Europe and Africa
and 900 MHz in America respectively), 2.4 GHz and
5.8 GHz (ETSI, 2010) (FCC, 2016). Especially the
2.4 GHz band is broadly employed posing a challenge
to each technology’s coexistence techniques. Since
Coverage Range Analysis of Wireless Technologies for Industrial Automation - System Overview and Performance Evaluation
75

coexistence of wireless communication systems is
crucial for wide usability, there are regulations in each
ISM band, which enable the inter-system-coexistence
of different technologies. Either the allowed trans-
mission power is small or users have to apply “listen
before talk” (LBT). LBT is inappropriate for FA and
partially for PA as well, since the transmission delay
is not predictable.
Due to the great interest, ETSI initiative TG41,
who aims at a regulation guaranteeing exclusive use
of 5.725 GHz to 5.875 GHz for wireless industrial
communication systems, was formed. Here the trans-
mit power is planned to be increased from 14 dBm
to 26 dBm EIRP (ETSI, 2010). An exclusive use of
a dedicated frequency band leads to less interference
between different technologies, but reinforces the im-
portance of intra-system-coexistence.
A different approach is the use of large frequency
ranges as in UWB (IEEE, 2011) technologies. Here
the employed bandwidth is equal to or larger than
499.2 MHz, which provides high interference resis-
tance owed to its spreading concept. There are three
operating bands defined: sub-gigahertz band from
249.6 MHz to 749.6 MHz, low band from 3.1 GHz to
4.8 GHz, and high band from 5.8 GHz to 10.6 GHz.
3 WIRELESS TECHNOLOGIES
Since the PHY layer technology vigorously affects
the overall system performance, it must be carefully
chosen for a certain field of operation. The range of
available technologies from wireless standards and re-
cent research projects is wide. It reaches from UWB
technologies, that promise coexistence with existing
wireless systems, to 5G cellular machine to machine
(M2M) solutions, which can cover large areas and
huge numbers of devices. With its Orthogonal Fre-
quency Division Multiple Access (OFDMA) and Sin-
gle Carrier Frequency Division Multiple Access (SC-
FDMA) schemes for downlink and uplink and the
enhancements from LTE Rel-11, 5G seems to be a
promising approach for PA and CM, but its laten-
cies are not capable of meeting the FA requirements.
Another promising technology for PA applications is
Sub-1 GHz-WLAN in IEEE 802.11ah, which shall
achieve low-cost long range connectivity (Aust et al.,
2015).
Technologies like ZigBee (ZigBee Alliance,
2012) with its star, mesh and cluster tree topologies
are rather suitable for CM purposes. A recent ap-
proach that is also based on the IEEE 802.15.4 stan-
dard and covers industrial applications in the fields
of FA and PA is WirelessHART (IEC, 2010). An-
other choice, based on the IEEE 802.15.1 standard, is
Wireless Sensor Actuator Network (WSAN), which is
designed for FA and coexistence with common tech-
nologies in the 2.4 GHz ISM band (PNO, 2012). Nev-
ertheless, these standards cover the FA requirements
insufficiently, so that wireless communication tech-
nologies, which meet the FA requirements, are current
research topics.
Among others, UWB, FHSS and PSSS are subject
of FA standard PHYs and recent research projects.
These three promising wireless technologies are de-
picted for further analysis.
3.1 UWB Overview
In order to realize short-haul links for data com-
munication for low power and low rate devices
in a Wireless Personal Area Network (WPAN) the
IEEE 802.15.4a standard offers several PHY trans-
mission modes (IEEE, 2011). The investigated Im-
pulse Radio (IR)-UWB PHY specification supports
data rates from 0.11 Mb/s to 27.24 Mb/s with differ-
ent Modulation and Coding Schemes (MCS). The
IR-UWB impulses are modulated using burst posi-
tion modulation (BPM) and binary phase shift keying
(BPSK). In the BPM-BPSK modulation scheme two
bits of information are carried in each UWB symbol.
The first bit is determined by the burst’s temporal po-
sition and the burst’s polarity indicates the second bit.
A complete burst is specified by a spreading sequence
defining the polarity of it’s impulses (IEEE, 2011).
T
BPM
Burst positions (N
hop
)
T
dsym
T
burst
T
c
N
cpb
Guard interval
Burst positions (N
hop
) Guard interval
T
BPM
. . .
Figure 2: IEEE 802.15.4a IR-UWB PHY symbol struc-
ture (IEEE, 2011).
The structure of an IR-UWB PHY symbol is
shown in figure 2. T
dsym
is referred to as total sym-
bol duration, T
c
as chip duration and N
cpb
as number
of chips per burst. T
BPM
is the duration of a BPM
interval and T
burst
corresponds to the burst duration.
In table 2 the significant parameters of selected
IR-UWB MCSs are listed including the FEC rates of
convolutional coding (CC) and Reed-Solomon (RS)
coding.
WINSYS 2016 - International Conference on Wireless Networks and Mobile Systems
76
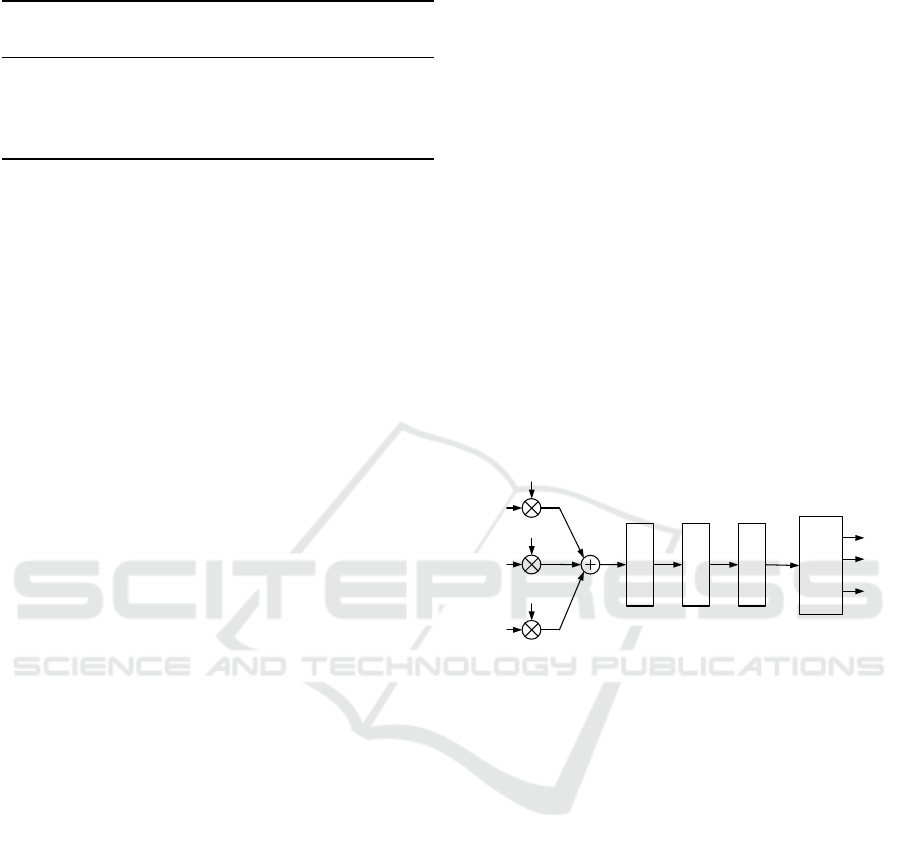
Table 2: IR-UWB PHY Parameters.
MCS
Rate Rate
N
cpb
T
dsym
Data rate
CC RS [ns] [Mb/s]
1 0.5 0.87 128 8205.13 0.11
2 0.5 0.87 16 1025.64 0.85
3 0.5 0.87 2 128.21 6.81
4 1 0.87 1 64.10 27.24
With the large number of adjustable parameters, the
IR-UWB PHY is adaptable to different communica-
tion scenarios from FA, PA and CM. In order to suit
best for FA scenarios, delay requirements have to be
met, and therefore MCS 4 is investigated in this pa-
per. MCS 4 has a symbol duration T
dsym
of 64.10 ns
and reaches a data rate of 27.24 Mb/s with coherent
reception (Reinhold, 2016).
Due to regulatory aspects such as duty cycle and
power restrictions the high band with a mandatory
channel at 7.9872 GHz is depicted for performance
evaluation in section 4.3.2.
3.2 FHSS Overview
FHSS is one of the most common transmission tech-
niques for automation and sensor networks. In order
to achieve coexistence between multiple connections
and to enhance the transmissions’ robustness, the
transmission channel is changed frequently, whereby
the hopping frequency can vary among the technolo-
gies from 1600 Hz up to static channel usage. For
most frequency bands this type of frequency usage is
covered by regulations (FCC, 2016).
An established standard using FHSS spectrum ac-
cess is Bluetooth LE (Bluetooth SIG, 2014). It is
primarily designed for IoT tasks, but there are also
variations for FA available. WSAN (PNO, 2012) has
a PHY layer based on the IEEE 802.15.1 standard
(IEEE, 2005), which also serves as a basis for Blue-
tooth up to version 1.2. The system operates within
the 2.4 GHz ISM band and uses a FHSS mechanism
with 79 channels, each occupying a nominal band-
width of 1 MHz. WSAN additionally uses a hopping
scheme allowing the parallel usage of multiple base
stations and supports channel blacklisting as a coex-
istence feature.
In this work we consider a FHSS system with a
Gaussian Minimum Shift Keying (GMSK) modula-
tion scheme adopted from Bluetooth LE and WSAN
operating in the 5.8 GHz ISM band. The 150 MHz of
available system bandwidth are divided into 75 chan-
nels resulting in a channel center frequency distance
of 2 MHz (Bluetooth SIG, 2014) (FCC, 2016) (ETSI,
2010). The channel center frequencies result as
f
c
= 5726 MHz + (i − 1) · 2 MHz,
i = 1 . . . 75
(1)
with the channel number i.
3.3 PSSS Overview
In order to enhance response times due to paral-
lel access, spread spectrum techniques offer promis-
ing properties. In contrast to Direct Sequence
Spread Spectrum (DSSS)-techniques, where each bit
is spread with an appropriate pseudo noise (PN)-
sequence, PSSS is an approach based on spread-
ing with a m-sequence. It was firstly presented in
(Wolf, 2004; Schwetlick and Wolf, 2004) and is,
based on an m-sequence of length 31 chips, part of
IEEE 802.15.4-2011 (IEEE, 2011), but in general any
m-sequence is applicable. A detailed description of
PSSS en- and decoding is given in (KrishneGowda
et al., 2015), whereas a short overview is given in this
paper.
Channel
Cyclic
Correlation
d
1
d
2
d
n
c c
d
1
'
d
2
'
d
n
'
0
m
1
m
1n
m
Mod
.
Demod
.
...
...
Figure 3: PSSS coding and decoding process.
The bits of the data vector d are spread each with the
same, but cyclically shifted, m-sequence of length n
as shown in Figure 3, where m
→0
denotes the basic
m-sequence. Correspondingly, m
→i
denotes the same
sequence cyclically shifted by i chips. Thus up to n bit
can be transferred in parallel in one PSSS symbol.
The transmitted PSSS symbol c is multivalent due to
the chipwise addition of the spread bits of d. An ar-
bitrary modulation scheme can be used for transmis-
sion. For the analysis in section 4.3 a Amplitude Shift
Keying (ASK) is utilized.
The PSSS decoding is performed by cyclic cor-
relation of the received multivalent PSSS sequence
c
0
with the basic m-sequence. A longer m-sequence
leads to a more reliable result of the cyclic correlation
assuming a uniform distribution of data bits. This ef-
fect is shown in section 4.3.
3.4 Technology Comparison
Though all three described technologies are promis-
ing in terms of wireless industrial communication,
their properties diverge. An overview of relevant
Coverage Range Analysis of Wireless Technologies for Industrial Automation - System Overview and Performance Evaluation
77
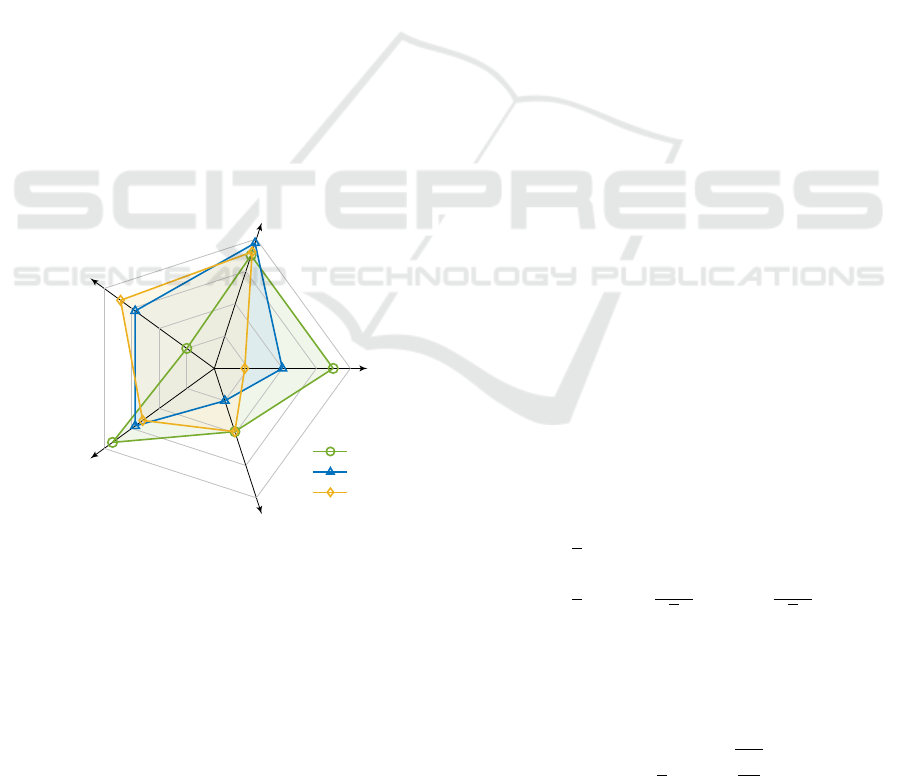
properties is shown in figure 4 based on the assump-
tions made in table 3 in section 4.3.2. UWB uses a
bandwidth of 499.2 MHz with one channel per sys-
tem, and achieves a total data rate of 31.2 Mb/s.
FHSS employs 75 channels with 1 Mb/s data rate
each resulting in a system data rate of 75 Mb/s. The
depicted configuration utilizes all available channels
for a single system. For cellular coverage of the fac-
tory floor, the system can also be rescaled by reducing
the number of utilized channels, making a coexistence
of parallel systems possible. For a 3 × 3 pattern eight
channels can be utilized per system in average, when
inter-system interference is avoided.
Here, PSSS is exemplarily assumed to be em-
ployed based on a m-sequence with a length of
255 chips, which is further denoted as PSSS 255. Up-
and downlink provide a number of 255 channel occu-
pying a bandwidth of 20 MHz each. Accordingly the
total system bandwidth is 40 MHz. The link data rate
amounts to 78 kb/s resulting is a total system data rate
of 40 Mb/s. If the link data rate of a single link is too
small, multiple links can be grouped and thus a larger
data rate is achieved, but concomitantly the number
of simultaneous nodes in service is reduced. In PSSS,
the system data rate can be shared at any desired frag-
mentation.
Link
data rate
System
data rate
Channels per
system
Maximum
system bandwidth
Number of
parallel systems
0.1
1
10
100 Mb/s
1
10
10
2
10
3
1
10
100
10
3
MHz
1
3
10
30
UWB MCS4
FHSS
PSSS 255
Figure 4: System capacities.
4 SYSTEM EVALUATION
The proposed PHY technologies are investigated in
the subsequent sections regarding their applicability
for FA. Based on the Bit Error Rate (BER) analysis,
the coverage ranges are considered for typical packet
sizes based on an AWGN channel model. The tech-
nologies’ feasibility is validated as given in table 1.
4.1 Theoretical Analysis
For the purpose of the subsequent error rate and cov-
erage range analysis, the performance of the three
proposed systems in AWGN is analysed in this sec-
tion. For simplicity reasons, we assume that the sys-
tems are perfectly synchronised and have the correct
symbol clock and phase.
4.1.1 UWB Analysis
In order to evaluate the system’s performance, typ-
ical receivers have to be analyzed. Coherent UWB
receivers are often implemented as correlation re-
ceivers. Here the detection is performed by cross-
correlation between the received signal and a local
reference signal. Assuming pulse-position modula-
tion (PPM), perfect synchronization and binary sym-
bols with AWGN, the mean value u
b
k
of the received
signal results as derived from (Ge et al., 2002) in two
separable cases:
1. for a transmitted bit b
k
= 0
u
0
= E
{
g
k
|b
k
= 0
}
= E
b
·
[
AKF (τ
0
) − AKF (τ
0
− ∆)
]
(2)
2. for a transmitted bit b
k
= 1
u
1
= E
{
g
k
|b
k
= 1
}
= E
b
·
[
AKF (τ
0
+ ∆) − AKF (τ
0
)
]
(3)
where g
k
is the decision variable resulting from corre-
lation of received signal r (t) and local reference tem-
plate as given in (4).
g
k
=
T
dsym
0
r (t) ·
[
ν(t) − ν(t − ∆)
]
| {z }
template
dt. (4)
With AWGN, the BER results as
BER =
1
2
·
[
Pr(err|0) + Pr(err|1)
]
=
1
4
·
"
erfc
u
0
√
2σ
!
+ erfc
u
1
√
2σ
!#
,
(5)
with σ
2
being the two-sided noise density (Reinhold,
2016). Equation (5) can be simplified for MCS 4 as-
suming equal transmission probabilities for each of
the binary symbols to
BER =
1
2
erfc
*
,
r
E
b
N
0
+
-
, (6)
which is equivalent to BER of antipodal signaling.
WINSYS 2016 - International Conference on Wireless Networks and Mobile Systems
78

4.1.2 FHSS Analysis
While a FHSS system with Frequency Shift Keying
(FSK) was chosen for analysis in (Reinhold et al.,
2013), a more realistic approach is chosen in this pa-
per. For the later analysis GFSK with modulation in-
dex η = 0.5 and a bandwidth time product BT = 0.5
is assumed.
For the coverage analysis, we consider limiter-
discriminator reception (LD), which is incoherent and
thus does not need phase recovery to operate. This
makes it suitable for fast FHSS systems and allows
packet communication without syncwords (Bluetooth
SIG, 2014). The receiver filter h
r
is chosen to be a
Gaussian filter and is given by its impulse response in
(7). For the following investigations this filter’s band-
width time product BT = 1 is assumed.
h
r
(t) =
√
2 · BT · exp
−2π(BT )
2
· t
2
(7)
The performance of the limiter-discriminator depends
on the width of the receiver filter’s frequency response
and the modulation index. The authors in (Cartier,
1977), (Simon and Wang, 1983) and (Pawula, 1988)
have evaluated its performance for FSK in AWGN.
The bit error probability sums up from two compo-
nents.
BER = P
cont
+ P
click
(8)
The error probability resulting from clicks P
click
dom-
inates for low SNR figures, whereas the continuous
error probability P
cont
dominates for high SNR. Since
the receiver’s filter leads to inter symbol interference,
the error probabilities must be averaged over all pos-
sible bit sequences d. When the receiver filter’s BT
is larger than or equal to one, a bit sequence length
of three is sufficient. Assuming that every click leads
to an error, the error probability resulting from clicks
P
click
is equal to the average number of clicks
¯
N av-
eraged over all possible bit sequences d (Simon and
Wang, 1983). When Gaussian impulse shaping is ap-
plied with a BT = 0.5 the length of the sequences d
has to be increased. For the investigated filter chain, a
overall sequence length of six symbols is sufficient.
P
click
=
¯
N
d
(9)
P
cont
can be calculated semi-analytically with (10),
where ∆ϕ is the phase difference between two sym-
bols and Ψ is the modulo 2π phase difference between
the two symbols that are superposed with correlated
complex Gaussian noise (Pawula, 2001).
P
cont
= Pr{∆ϕ − π 6 Ψ 6 0}
d
(10)
Equation (10) can be solved with the help of (20) in
(Pawula, 2001).
For extended comparison in the system evaluation
in section 4.3 we also take FSK with coherent recep-
tion (CR) into consideration. As given in (Proakis and
Salehi, 2008) in this case the BER is calculated as
BER =
1
2
erfc
*
.
,
s
E
b
1 − <
{
ρ
}
2N
0
+
/
-
, (11)
where ρ is the correlation coefficient. For orthogonal
signaling, which is given in case of MSK, the correla-
tion coefficient qualifies as ρ = 0.
BER =
1
2
erfc
*
,
r
E
b
2N
0
+
-
(12)
4.1.3 PSSS Analysis
The simulative base band evaluation given in
(Schwetlick and Wolf, 2004) for 31 chips is calcu-
lated semi-analytically in this work and extended to
a general description for arbitrary m-sequences, on
which this paper’s evaluation is based. In the follow-
ing, the derivation is explained shortly. Employing a
spreading technique with orthogonal PN-sequences,
the BER is calculated by (6), which is equivalent to
BER of a BPSK (Proakis and Salehi, 2008). Since
m-sequences are not orthogonal, a penalty coefficient
γ(n, p) is defined to adapt the BPSK calculation for
PSSS. The cyclic autocorrelation ϕ of an arbitrary m-
sequence is given by
ϕ(τ) = m
→0
˜
⊗m
→0
=
(
n, τ mod n = 0
−1, otherwise
, τ ∈ Z
(13)
The cross correlation yields the maximum at τ = i
respectively, where i denotes the cyclic shift. Thus
superposed cyclically shifted m-sequences influence
each other in their maximum value depending on the
bit values carried. The effective correlation amplitude
in the relevant shift after superposition is further de-
fined as
ϕ(τ = i) = (p) (14)
and can be calculated with respect to the number of
used sequences and the value of all other values in d.
Especially the superposition of equal bits in d is crit-
ical, since the correlations’ result is degraded due to
lacking orthogonality. Assuming a uniform distribu-
tion of the bit values in d, a binomial distribution of
the number of equal bits p results as shown in figure 5.
Coverage Range Analysis of Wireless Technologies for Industrial Automation - System Overview and Performance Evaluation
79

Normalized number of equal bits
0 0.2 0.4 0.6 0.8 1
Pr(n, p)
0
0.05
0.1
0.15
n = 31
n = 255
Figure 5: Distribution of equal data bits in d.
Taking this into account the penalty coefficient can be
calculated as
γ(n, p) =
2
(p)
Pr(n, p) ·
2
(p)
p
. (15)
The effective correlation amplitude (p ) is squared
since it influences E
b
/N
0
and is normalized by the
probability of p equal bits since E
b
/N
0
is defined as
mean over all bit combinations in d. BER of PSSS is
thus calculated as a function of n as
BER = Pr(n, p) ·
1
2
erfc
*
,
r
γ(n, p) ·
E
b
N
0
+
-
p
. (16)
Caused by the averaging, the slope of the BER curve
is not falling monotonically.
4.2 Evaluation Methodology
The presented technologies UWB, FHSS and PSSS
are further compared in BER, coverage range and
PLR. In this section the evaluation principles are ex-
plained shortly.
The BER calculation based on E
b
/N
0
is given for
each technology in (6), (8) and (16) respectively. The
relation between SNR and E
b
/N
0
is given as
E
b
N
0
=
P
RX
P
N
1
B ·T
= SNR ·
1
B ·T
, (17)
where B is the effective bandwidth, T the bit duration,
P
RX
denotes the reception power and P
N
the effective
noise power. Considering PSSS and UWB, addition-
ally the spreading gain has to be taken into account.
Moreover, P
RX
is the difference between trans-
mission power P
TX
and path loss a
dB
:
P
RX
= P
TX
− a
dB
= P
N
+ SNR
dB
(18)
Assuming free-space propagation, a
dB
results as
a
dB
= − G
TX
− G
RX
+ F + I
+ 20 log
10
4π · d · f
c
c
0
!
,
(19)
where G
TX
and G
TX
denote the antenna gains of
transmitter and receiver respectively. F defines the
noise figure, and I describes implementation losses.
f
c
is the carrier frequency and d the distance between
transmitter and receiver, which is equivalent to the
coverage range.
Finally, (19) can be solved for d, and a
dB
can
be substituted with (18). The coverage range d
dB
=
10 log
10
d
1 m
results as
d
dB
=
1
2
G
TX
+ G
RX
− F − I + P
TX
− SNR
dB
− P
N
− 20 log
10
f
c
1 GHz
!
− 32.44
.
(20)
For an reasonable system comparison in terms of
Packet Loss Rate (PLR), Forward Error Correction
(FEC) and physical layer overhead have been ne-
glected for this analysis. The PLR thus is calculated
by
PLR = 1 − (1 − BER)
N
bit
. (21)
where N
bit
denotes the number of bits per packet.
4.3 Evaluation Results and Discussion
In the subsequent section the three suggested systems
are compared with each other considering the key re-
quirements for FA resulting from section 2.1. Ini-
tially a bit error evaluation is performed based on sec-
tion 4.1, before the systems are collated in a coverage
range comparison for the AWGN channel model. Af-
terwards the results are discussed regarding their suit-
ability for FA.
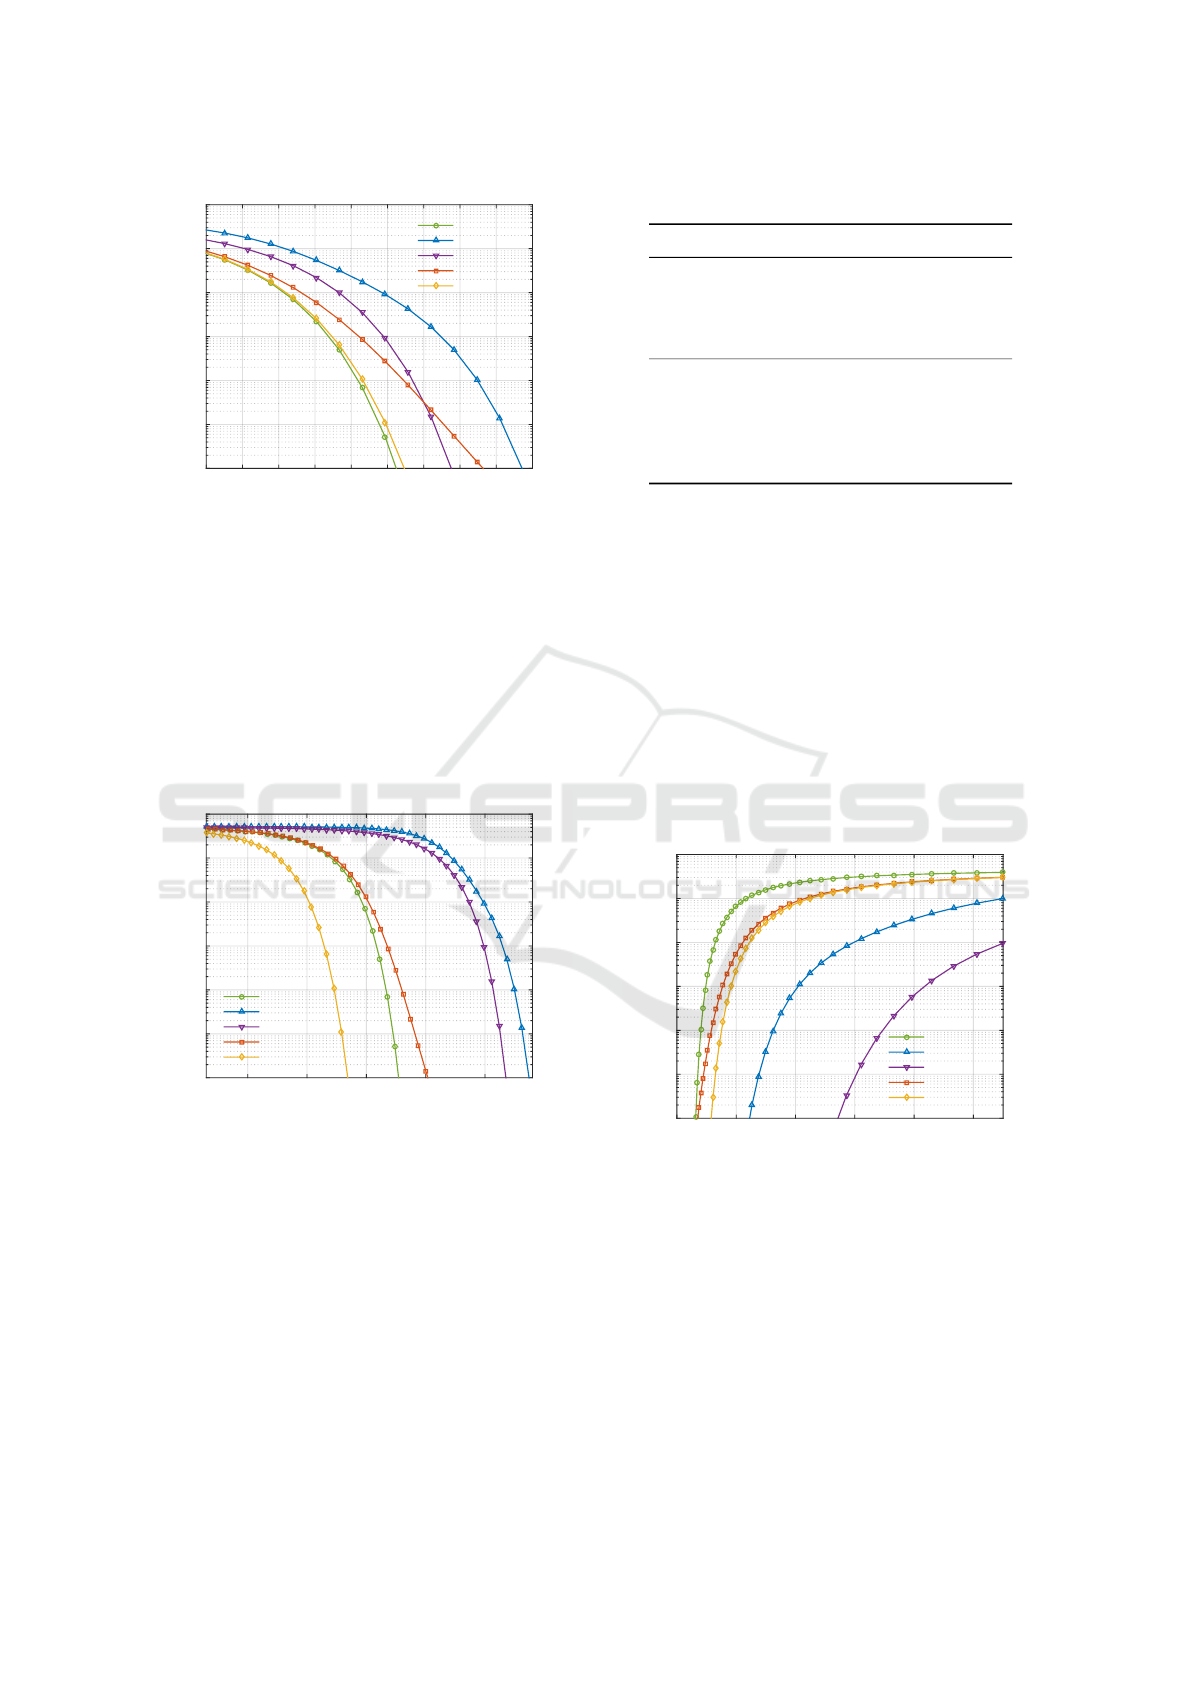
4.3.1 BER versus SNR
Figure 6 illustrates the BER performance versus
E
b
/N
0
of the described PHY layer technologies in
AWGN. Under the described preliminaries, the IR-
UWB performance is congruent with the performance
of binary antipodal signaling. In the scope of FHSS
we observe the expected performance difference be-
tween MSK with coherent reception (CR) and GMSK
with limiter discriminator reception (LD). While the
performance of the FSK reference with CR is con-
gruent with binary orthogonal signaling, the LD re-
ception loses around 4 dB in the range of practically
relevant BERs. Regarding PSSS demodulation, we
observe the influence of the length of the utilized
PN-sequence. The PSSS 31 system loses about 5 dB
compared to antipodal signaling. By increasing the
sequence length by a factor of approximately 8 to
WINSYS 2016 - International Conference on Wireless Networks and Mobile Systems
80
E
b
/N
0
[dB]
0 2 4 6 8 10 12 14 16 18
BER
10
−6
10
−5
10
−4
10
−3
10
−2
10
−1
10
0
UWB MCS4
FHSS LD
FHSS CR
PSSS 31
PSSS 255
Figure 6: Bit error rate versus E
b
/N
0
.
PSSS 255 this performance loss reduces to less than
0.5 dB.
As presented in figure 7, by changing the scale to BER
versus SNR, the effect of the different concepts of fre-
quency spreading are clarified. While FHSS spec-
trum spread effect arises from frequency changes,
UWB and PSSS originate their wideband character-
istics from impulse or sequential spreading. Here, for
PSSS the signal power refers to only one of the uti-
lized sequences, while all sequences are in use.
SNR [dB]
-30 -20 -10 0 10
BER
10
−6
10
−5
10
−4
10
−3
10
−2
10
−1
10
0
UWB MCS4
FHSS LD
FHSS CR
PSSS 31
PSSS 255
Figure 7: Bit error rate versus SNR.
4.3.2 Coverage Range Analysis
In order to determine realistic coverage ranges, a set
of reasonable values describing the transmission char-
acteristics has to been chosen. Table 3 summarizes the
parameters that are used in (18) for reasonable cover-
age range estimation in AWGN for the three depicted
technologies.
Due to interoperability with existing communication
systems in the 2.4 GHz ISM band, for the FHSS and
the PSSS system the 5.8 GHz ISM band is chosen for
coverage range analysis. For UWB, the 7.9872 GHz
Table 3: Parameters for Range Calculation.
Parameter UWB FHSS PSSS
f
c
[GHz] 7.9872 5.825 5.825
B [MHz] 499.2 1 20
P
TX
[dBm] 10 14 14
P
N
[dBm] -86.99 -113.98 -100.97
N
bit
8 · 60 Byte
G
TX
0 dBi
G
RX
0 dBi
F 5 dB
I 10 dB
channel is selected as defined in section 3.1. While
the parameters f
c
, B and P
TX
differ among the three
technologies, the system parameters, which include
antenna gains G
TX
and G
RX
, noise figure F and im-
plementation losses I, are chosen identically for a rea-
sonable system comparison.
As a result, figure 8 is obtained from (20). Ob-
viously the sequential spreading concepts are able to
stand harsher SNRs as depicted in figure 7, but cer-
tainly suffer from higher P
N
(see table 3). The abso-
lute EIRP transmission power is the same for FHSS
and PSSS, but IR-UWB is subject to a regulatory lim-
itation of 0 dBm per 50 MHz bandwidth in the 6 GHz
to 8.5 GHz range (ETSI, 2013).
d [m]
0 200 400 600 800 1000
BER
10
−6
10
−5
10
−4
10
−3
10
−2
10
−1
10
0
UWB MCS4
FHSS LD
FHSS CR
PSSS 31
PSSS 255
Figure 8: Bit error rate versus coverage range.
Next, the evaluation results in terms of PER ver-
sus coverage range are shown in figure 9. The PLR
considerations are calculated with (21) and 60 Byte
packet size. The proposed 60 Bytes include user data,
which is up to 30 Byte for FA (see table 3), packet
overhead and FEC overhead. In order to attain an rea-
sonable system comparison without MAC layer eval-
uation, the packet size is kept the same for all three
PHY technologies.
Coverage Range Analysis of Wireless Technologies for Industrial Automation - System Overview and Performance Evaluation
81
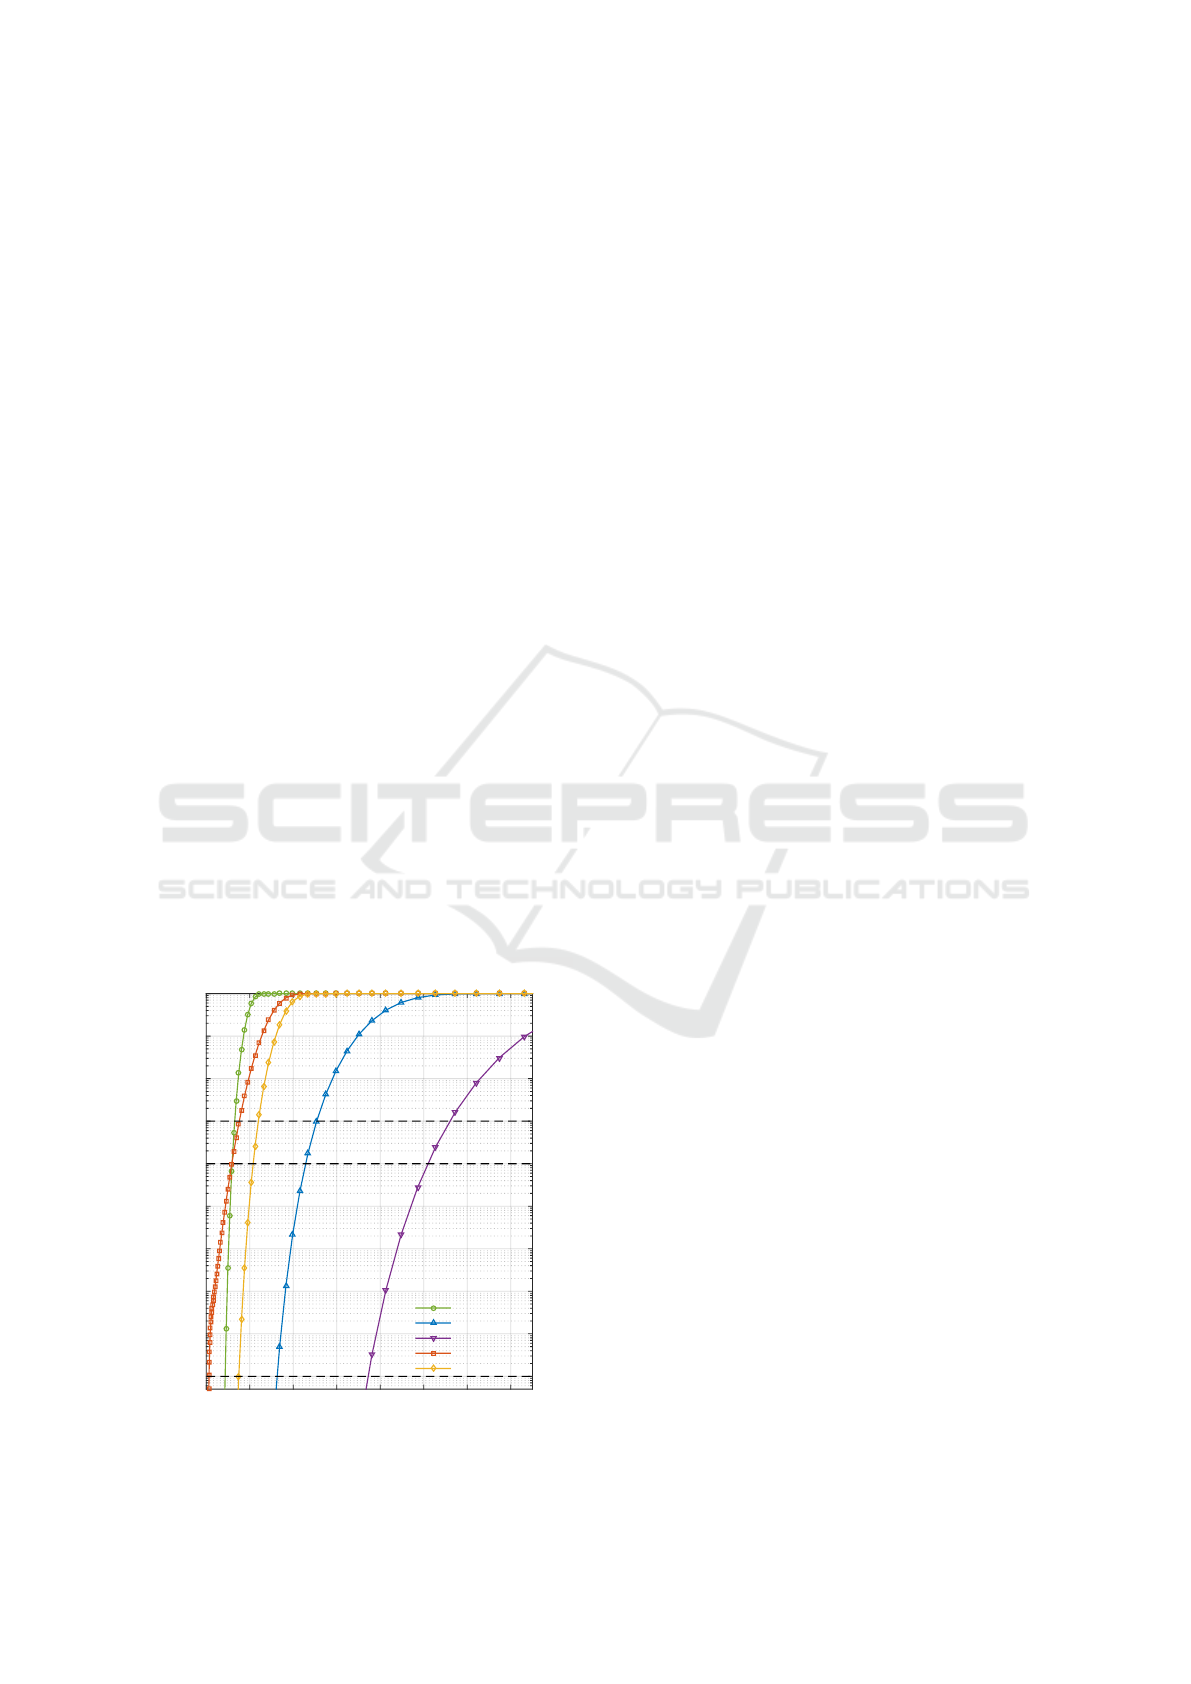
4.3.3 Discussion
As displayed in figure 9, the PSSS 31 system does not
meet the FA coverage range requirement and turns
out as impractical for this application field. The in-
homogeneity in the PLR curve’s slope for low error
rates from about 10
−7
to 10
−8
results from the averag-
ing over binomially distributed bits per PSSS symbol
as indicated in section 4.1.3. The UWB system and
the PSSS 255 system are comparatively low range,
but both match the range requirements for FA un-
der ideal free-space conditions. Other communication
scenarios are only applicable using FHSS leading to
its higher flexibility.
While the UWB PHY reaches a coverage range of
43 m for PLR of 10
−9
, the PSSS 255 system covers up
to 75 m and the FHSS LD system up to 156 m. For the
PSSS coverage range it is assumed that the maximum
data rate is utilized, thus all codes are in use. When
the number of utilized codes is reduced, the coverage
range for the remaining codes is increased depend-
ing on the coding gain factor, which is up to 255 for
PSSS 255. Furthermore, the BER degradation coef-
ficient γ is influenced by less concurrent codes (see
section 4.1.3).
As depicted in section 3.4 the considered systems
vary in their parameters and so does the link data rate.
Regarding the latency requirements, the achieved data
rate is vital. While FHSS and UWB have a fixed chan-
nel data rate, which is equal to the link data rate, the
PSSS system can adapt the channel data rate depen-
dant on the specific application data rate. In case of
FHSS the fixed channel data rate can only be adapted
d [m]
0 100 200 300 400 500 600 700
PLR
10
−9
10
−8
10
−7
10
−6
10
−5
10
−4
10
−3
10
−2
10
−1
10
0
FA limit
PA limit
CM limit
UWB MCS4
FHSS LD
FHSS CR
PSSS 31
PSSS 255
Figure 9: Packet loss rate versus coverage range.
within restricted limits by parallel reception on mul-
tiple FHSS frequencies as realized for WSAN (PNO,
2012). For serving multiple clients in a star topology
the UWB system is dependent on Time Division Mul-
tiple Access (TDMA), thus cycle times for scenar-
ios with large numbers of connected nodes are high
(Reinhold, 2016). For FHSS, besides TDMA, a Fre-
quency Division Multiple Access (FDMA) channel
access scheme is possible with advanced transceiver
concepts, but on the other hand abrogates the advan-
tage of simple transceivers. With PSSS a combination
with Code Division Multiple Access (CDMA) is pos-
sible, allowing very low latencies and novel and flex-
ible resource management strategies, which are cur-
rently being investigated.
5 CONCLUSION
In this paper, requirements for industrial applications
have been discussed. These requirements are critical
for realization with wireless technologies in at least
the one of the application categories. Focusing on FA,
the performances of IR-UWB, FHSS and PSSS phys-
ical layers have been analyzed. The system analysis
and comparison have been performed under regula-
tory aspects and assuming realistic reception concepts
in AWGN. The systems have been discussed consid-
ering the delay requirements for FA and the systems’
potential with respect to appropriate medium access
strategies is assessed.
Since the presented evaluation bases on an AWGN
channel model, future work focuses on advanced
performance evaluation with more realistic channel
models for industrial environments like presented in
(Molisch et al., 2004). Consecutively, a delay analysis
with appropriate MAC layer concepts for each tech-
nology is possible and reasonable. Apart from that, a
coexistence analysis, including both inter- and intra-
system-coexistence, contributes a vital piece on the
feasibility of the presented PHY concepts.
ACKNOWLEDGEMENTS
Part of the research leading to these results has re-
ceived funding from the German Federal Ministry
of Education and Research under grant agreement
no. 16KIS0223 also referred to as ParSec, as well as
under grant agreement no. 16BU1222 also referred to
as KUSZ.
WINSYS 2016 - International Conference on Wireless Networks and Mobile Systems
82

REFERENCES
Aust, S., Prasad, R. V., and Niemegeers, I. G. M. M. (2015).
Outdoor Long-Range WLANs: A Lesson for IEEE
802.11ah. IEEE Communications Surveys & Tutori-
als, 17(3):1761–1775.
Bluetooth SIG (2014). BLUETOOTH SPECIFICATION
Version 4.2.
Cartier, D. E. (1977). Limiter-Discriminator Detection Per-
formance of Manchester and NRZ Coded FSK. IEEE
Transactions on Aerospace and Electronic Systems,
AES-13(1):62–70.
ETSI (2010). EN 300 440-1 V1.6.1, Electromagnetic com-
patibility and Radio spectrum Matters (ERM); Short
range devices; Radio equipment to be used in the 1
GHz to 40 GHz frequency range; Part 1: Technical
characteristics and test methods.
ETSI (2011). TR 102 889-2 V1.1.1. Technical report, Eu-
ropean Telecommunications Standards Institute.
ETSI (2013). EN 302 065-1 V1.3.1, Electromagnetic com-
patibility and Radio spectrum Matters (ERM); Short
Range Devices (SRD) using Ultra Wide Band tech-
nology (UWB) for communications purposes; Harmo-
nized EN covering the essential requirements of arti-
cle 3.2 of the R&TT directive; part 1: Common tech-
nical requirements.
FCC (2016). CFR Title 47: Telecommunication, Part 15,
Subpart C – Intentional Radiators.
Frotzscher, A., Wetzker, U., Bauer, M., Rentschler, M.,
Beyer, M., Elspass, S., and Klessig, H. (2014). Re-
quirements and current solutions of wireless commu-
nication in industrial automation. In Communications
Workshops (ICC), 2014 IEEE International Confer-
ence on, pages 67–72.
Ge, L., Yue, G., and Affes, S. (2002). On the BER per-
formance of pulse-position-modulation UWB radio in
multipath channels. 2002 IEEE Conference on Ultra
Wideband Systems and Technologies, UWBST 2002 -
Digest of Papers, (1):231–234.
Güngör, V. Ça
˘
gri; Hancke, G. P. (2013). Industrial Wireless
Sensor Networks: Applications, Protocols and Stan-
dards. CRC Press.
IEC (2010). 62591 Ed. 1.0: Industrial communication net-
works - Wireless communication network and com-
munication profiles - WirelessHART.
IEEE (2005). IEEE Std 802.15.1-2005, IEEE Standard
for Information technolog - Local and metropolitan
area networks - Specific requirements - Part 15.1a:
Wireless Medium Access Control (MAC) and Phys-
ical Layer (PHY) specifications for Wireless Personal
Area Networks (WPA.
IEEE (2011). IEEE Std 802.15.4-2011, IEEE Standard
for Local and metropolitan area networks, Part 15.4:
Low-Rate Wireless Personal Area Networks.
KrishneGowda, K., Messinger, T., Wolf, A. C., Kraemer,
R., Kallfass, I., and Scheytt, J. C. (2015). Towards
100 Gbps Wireless Communication in THz Band with
PSSS Modulation: A Promising Hardware in the
Loop Experiment. In Ubiquitous Wireless Broadband
(ICUWB), 2015 IEEE International Conference on,
pages 1–5.
Molisch, A. F., Balakrishnan, K., Cassioli, D., Chong, C.-
c., Emami, S., Fort, A., Karedal, J., Kunisch, J.,
Schantz, H., Schuster, U., and Siwiak, K. (2004).
IEEE 802.15.4a Channel Model - Final Report. IEEE
P802, 15(04):1–40.
Pawula, R. F. (1988). Refinements to the Theory of Error
Rates for Narrow-Band Digital FM. IEEE Transac-
tions on Communications, 36(4):509–513.
Pawula, R. F. (2001). Distribution of the phase angle
between two vectors perturbed by Gaussian noise
II. IEEE Transactions on Vehicular Technology,
50(2):576–583.
PNO (2012). WSAN Air Interface Specification Technical
Specification, Version 1.0.
Proakis, J. G. and Salehi, M. (2008). Digital Communica-
tions. McGraw-Hill, New York, 5th ed. edition.
Reinhold, R. (2016). Concepts for Reliable and Time-
critical Industrial Communication Based on IR-UWB
Systems. Dortmunder Beiträge zur Kommunikation-
stechnik, Prof. Dr.-Ing. Rüdiger Kays, Dortmund.
Reinhold, R., Schaefer, F., and Kays, R. (2013). Perfor-
mance Evaluation of an Enhanced Frequency Hopping
Transceiver in 5 GHz Band for Wireless Sensor Net-
works. The Tenth International Symposium on Wire-
less Communication Systems 2013, pages 823–827.
Schwetlick, H. and Wolf, A. (2004). PSSS - Parallel Se-
quence Spread Spectrum a Physical Layer for RF
Communication. In Consumer Electronics, 2004
IEEE International Symposium on, pages 262–265.
Simon, M. K. and Wang, C. C. (1983). Differential Ver-
sus Limiter-Discriminator Detection of Narrow-Band
FM. IEEE Trans. on Communications, 31(11):1227–
1234.
VDI/VDE (2007). VDI/VDE Guideline 2185: Radio Based
Communication in Industrial Automation.
Wolf, A. (2004). Verfahren zum Übertragen eines Daten-
worts, Document DE 103 01 250 A1.
ZigBee Alliance (2012). ZigBee Specification, Document
053474r20.
ZVEI (2009). Coexistence of Wireless Systems in Automa-
tion Technology - Explanations on reliable parallel op-
eration of wireless radio solutions. Technical report,
ZVEI - German Electrical and Electronics Manufac-
turers’ Association, Automation Division.
Coverage Range Analysis of Wireless Technologies for Industrial Automation - System Overview and Performance Evaluation
83
