
Rapid Classification of Textile Fabrics Arranged in Piles
Dirk Siegmund, Olga Kaehm and David Handtke
Fraunhofer Institute for Computer Graphics Research (IGD), Fraunhoferstrasse 5 64283, Darmstadt, Germany
Keywords:
Quality Assurance, Textile Fabrics, Pattern Recognition, Textile Classification.
Abstract:
Research on the quality assurance of textiles has been a subject of much interest, particularly in relation
to defect detection and the classification of woven fibers. Known systems require the fabric to be flat and
spread-out on 2D surfaces in order for it to be classified. Unlike other systems, this system is able to classify
textiles when they are presented in piles and in assembly-line like environments. Technical approaches have
been selected under the aspects of speed and accuracy using 2D camera image data. A patch-based solution
was chosen using an entropy-based pre-selection of small image patches. Interest points as well as texture
descriptors combined with principle component analysis were part of this evaluation. The results showed that
a classification of image patches resulted in less computational cost but reduced accuracy by 3.67%.
1 INTRODUCTION
The cleaning of textiles in manufacturing industry is
nowadays an often completely automatized task op-
erated by machines. Nevertheless the visual quality
assurance after washing and drying is mostly man-
ually operated by humans. Fabric in textiles can
include cotton, wool, polyester or a composite of
them. As human errors occur due to fatigue, an au-
tomated inspection can improve quality and reduce
labor costs. In traditional textile manufacturing, fab-
ric is inspected during the furling process and can be
considered as a continuous 2D texture. However, this
work deals with pieces of textiles on assembly-line
like environments. As there is no mechanical solu-
tion for spreading the textiles in an automatized way,
the items will be inspected in a pile-like arrangement.
Discontinuous surfaces in combination with varying
colors and weaving of different textile fibers are some
of the challenges in this task. When dealing with re-
curring items, the recognition of the item type is an
important aspect to guarantee sorting accuracy. In
this work four woven cotton textiles each with dif-
ferent fabrics were used as experimental objects. As
high processing speed is required, this work will focus
on 2D methods for fabric classification. The previous
research results in fabric classification were carried
out on spread fabrics and required a 2D patterned tex-
ture defined by an underlying lattice with symmetric
properties. Unlike other projects this work examines
the applicability of the visual descriptors LBP (Lo-
cal Binary Pattern) and SURF (Speeded Up Robust
Features) in combination with the common classifiers
SVM (Support Vector Machine) and Adaboost. All
approaches were applied on the full image as well
as on cropped patches of smaller size. The database
consists of 537 images from 196 different textiles of
four different fabrics (= textile types). As the textile
comes in used condition the type of textile is not the
only property in the quality assurance. Some images
of textiles therefore have dirt, holes or other defects,
like the ones defined by the textile industry (Coun-
cil, 2000). Because some textiles may have been
washed many times, the fiber textile may also look
different in color and appearance. There are tech-
niques for textile classification that can differentiate
between fabrics with up to 98% (Ngan et al., 2011)
(Rebhi et al., 2015) (Abou-Taleb and Sallam, 2008)
accuracy. These existing approaches require the tex-
ture surface to be a flat and spread-out 2D surface.
In quality assurance after washing and drying this is
not the case. The textiles are in a voluminous shape
and show folds, edges, and borders. Folds as well
as overlapping borders have a negative impact on the
correct fabric classification. The three dimensional
shape tends to influences the size of the weaving in
the image. This work will examine how the chosen
visual 2D descriptors and classifiers perform on these
textiles in a verification scenario and will close with a
conclusion and outlook for future investigation.
Siegmund, D., Kaehm, O. and Handtke, D.
Rapid Classification of Textile Fabrics Arranged in Piles.
DOI: 10.5220/0005969300990105
In Proceedings of the 13th International Joint Conference on e-Business and Telecommunications (ICETE 2016) - Volume 5: SIGMAP, pages 99-105
ISBN: 978-989-758-196-0
Copyright
c
2016 by SCITEPRESS – Science and Technology Publications, Lda. All rights reserved
99
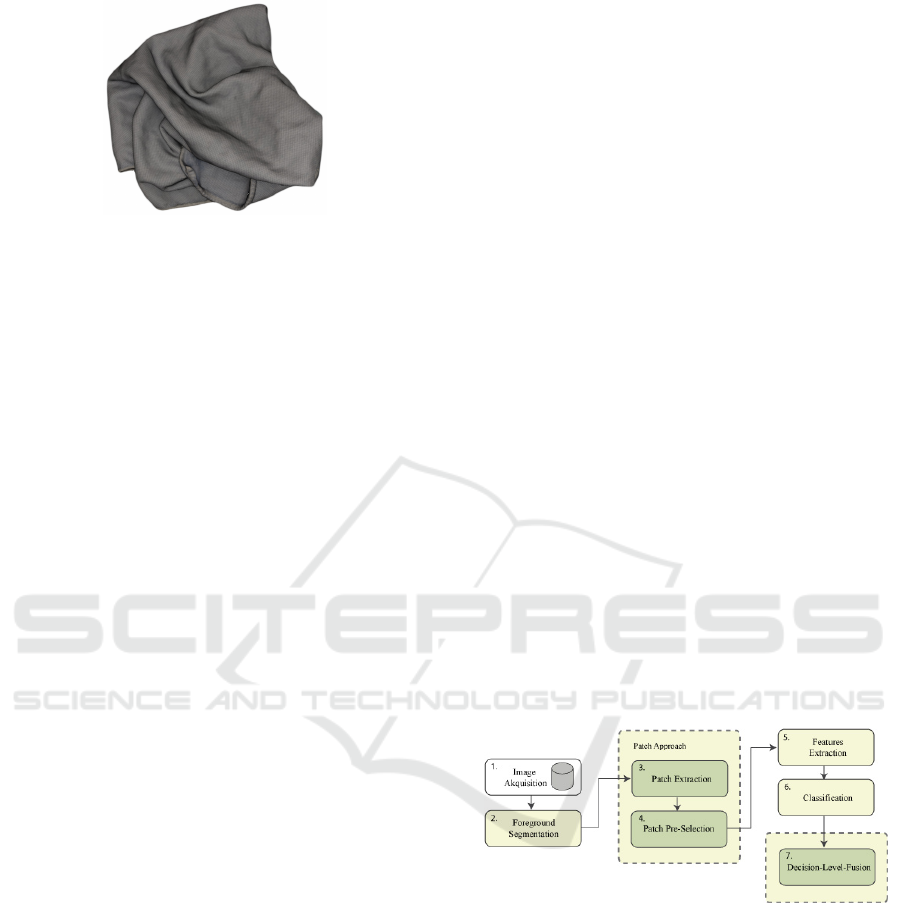
Figure 1: Textile in pile-like arrangement.
2 RELATED WORK
All found previous research work in fabric classifica-
tion was done on spreaded fabrics. Some approaches
utilized Artificial Neural Networks (ANN) like Kang
and Kim (Kang and Kim, 2002) who involved a
trained ANN for color grading of raw cotton. The
images were captured by a color CCD camera with
which they acquired color parameters, checked con-
nectivity and evaluated trash particles for their con-
tent, size, distribution and spatial density with a high
recognition rate compared to other methods. She et al.
(F.H. She and Kouzani, 2002) classified two kinds of
animal fibers objectively between merino and mohair.
In their approach they developed a system that uses
an ANN and image processing for this classification.
Kuo and Lee (Kuo and Lee, 2003) developed a system
to distinguish defects of fabrics like holes, oil stains,
warp-lacking, and weft-lacking. For that reason they
used a back-propagation Neural Network which gets
an image as input. They successfully determined
nonlinear properties and improved the recognition.
Srikaew et al. (A. Srikaew and Kidsang, 2011) pre-
sented a hybrid application of gabor filter and two-
dimensional principal component analysis (2DPCA)
for automatic defect detection of texture fabric im-
ages. With a Genetic Algorithm based on the non-
defect fabric images they achieved the optimal net-
work parameters. With their experiments they con-
cluded that the applied gabor filters efficiently provide
a straight-forward and effective method for defect de-
tection by using a small number of training images
but still can generally handle fabric images with com-
plex textile pattern background. Another approach
from Sun and Zhou (Sun and Zhou, 2011) used a
threshold segmentation method to identify if there are
any defects existed in the fabric. They adopted an
image feature based approach to recognize oil stain
and holes, and used training based technique to de-
tect broken ends and missing picks. They segmented
and filtered the defect image, extracted features of the
fabric defect, the classification was based on local
features and training. For automated visual inspec-
tion Ngan et al. (H.Y.T. Ngan and Ng, 2005) used a
wavelet transformation based approach. With direct
thresholding (DT) and a so-called golden image sub-
traction method (GIS) they segmented out the defec-
tive regions on patterned fabric effectively. They also
present a comparison with other methods. To address
the 3D shape of the textile in the task presented here,
this work uses the general pattern descriptor LBP and
rotation and scale invariant local features.
3 APPROACH
3.1 System Overview
The method presented in this work consists of: seg-
mentation, patch extraction, pre-selection, feature ex-
traction, classification and fusion. The individual
steps of the process are shown as a pipeline in Figure
2. The system has been evaluated including and ex-
cluding the steps: patch extraction and pre-selection.
For feature extraction the local interest point descrip-
tor SURF, as well as the LBP descriptor were used. In
the classification process the classifiers SVM and Ad-
aBoost were evaluated. When using patches instead
of the full image, these patches were preselected us-
ing the Shannon Entropy Value. The results of the
classification are fused in the Decision-Level-Fusion
step.
Figure 2: Program flow diagram.
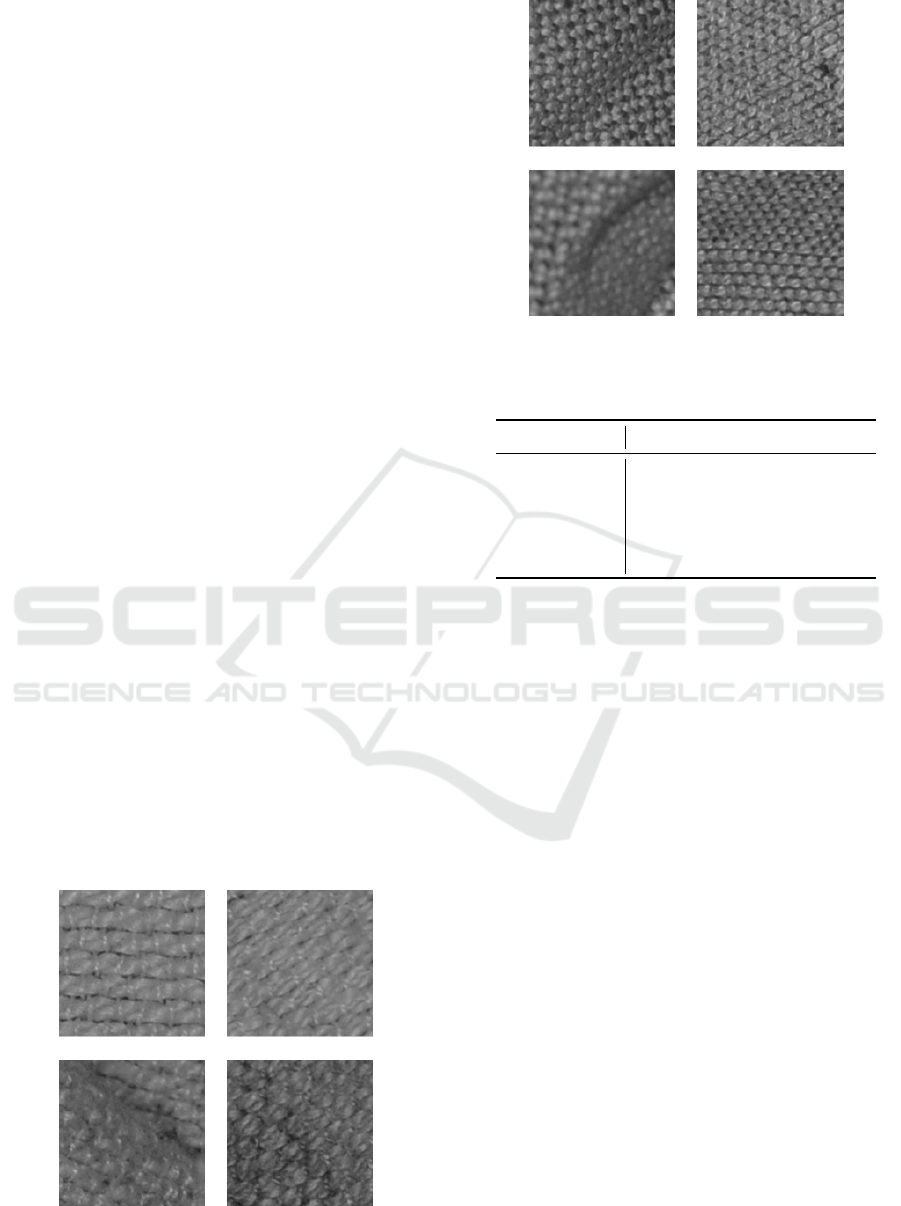
3.2 Description of Methods Used
For visual distinction of the cloth quality between the
types examined in this study (see Figure 3 and 4) the
weaving of the textile is arranged differently and can
therefore be used as property. The cloth fabric can
be visually differentiated by its fineness, yarn density
and its total mixture. When there are pile-like, uncon-
trolled arrangement of textiles on the assembly line,
other properties than the fabric weaving are not al-
ways visible. The weaving pattern was therefore used
as a feature for classification. However, the evalua-
tion of this property requires a high recording quality
SIGMAP 2016 - International Conference on Signal Processing and Multimedia Applications
100
and a correspondingly high resolution. For this reason
screen tests were conducted to determine the minimal
resolution with enough features to distinguish the dif-
ferent types of fabric. Therefore, the cloth has been
divided into patches and was examined by humans on
their distinctness. The tests have shown that a resolu-
tion of 4288x2848 pixels (aspect ratio of 4:3) within a
receiving area of 30x40cm is optimal. Using the anal-
ysis of texture-spectrum or interest-points based fea-
tures, these discriminative properties can be evaluated
for a selection. To perform a classification based on
the texture of the images, different approaches were
examined. These can be differentiated by the used
image parts, the features used and the classifier. Two
different image input data formats were investigated.
First the use of the full images in high resolution of
4288x2848 pixels, secondly extracted parts of the im-
age represented in patches of the size 128x128 pix-
els. The idea behind using patches instead of the full
image relies on the assumption that pre-selecting im-
age parts which stores more discriminative informa-
tion than others will provide a more reliable classifi-
cation.
3.3 Image Acquisition
To protect the laboratory image acquisition process
from light entering from the outside, a black box was
used. On the inner side of the black box, black molton
was attached to protect the fabric from reflection of
the box. A uniform sheet of green foam rubber was
used as an underlay in order to simplify separation of
foreground and background in the segmentation pro-
cess. For a homogeneous illumination a LED ring
light with 1950 lx was used.
For image recording a camera with a CMOS DX
sensor and 35mm lens was used. In Table 1 you can
find a detailed description of the parameters used. All
Figure 3: Examined patches of textiles (left column: type 1,
right column: type 2).
Figure 4: Examined patches of textiles (left column: type 3,
right column: type 4.)
Table 1: Camera parameters.
Parameter Property
Resolution 4288x2848 pixels
Focal Length 35mm
Sensor CMOS 23,6mm x 15,8mm
Aperture F8
Exposure 1/200s
test objects were recorded in three different pile-like
arrangements. The used data format is JPEG with a
low compression rate.
3.4 Database
The database consists of 537 images from 196 differ-
ent textiles of four different fabrics (= textile types).
As the weaving properties are the only used distin-
guishing feature, the quality varies in the parameter of
yarn density and fineness. The yarn density reaches
from 9.5x6.5 fibers/cm for the most rough fabric to
26x16 fibers/cm for the finest one. The fineness of
the fibers lies in the range of 50/2 Nm x 5.2/2 Nn to
200/2 Nm x 80/2Nm. The examined textiles were in
cleaned and dry condition when they were recorded.
Nevertheless their condition varies a lot because some
of them are worn out. Most textiles show therefore
dirt, holes or others defects. Furthermore, every tex-
tile has one out of three different colors. To classify
the fabrics based on their different characteristics the
ground truth was manually determined by visual in-
spection. Table 2 gives an overview of the quantities
of examined textiles in the database. The yarn den-
sity and fineness is increasing with the type of tex-
tile weaving used. This is shown in Figures 3 and 4.
Furthermore, each type of textile can have one out of
three colors.
Rapid Classification of Textile Fabrics Arranged in Piles
101

Table 2: Quantities of examined textile images in the
database (full image).
Type #Images (#defect) #Color1/Color2/Color3
1 186(165) 87/48/51
2 177 (140) 69/66/42
3 144 (120) 66/54/24
4 30 (13) 12/3/15
3.5 Preprocessing
In the segmentation step (see Figure 2 step 2) the
background is separated from the foreground by using
a mask. The image was first converted into the HSV
color space. A color range for the ’H’ (hue) value was
used to define the background color as lying between
lowerH and upperH. Pixel in mask(I) are set to 255 if
src(I) is within the specified range and 0 otherwise.
mask(I) = lowerH(I)
0
≤ src(I)
0
≤ upperH(I)
0
(1)
The mask was inverted and then applied onto the
source image. The morphological operators erosion
and dilation were used to exclude remaining smaller
artifacts in the background from the foreground. In
the patch extraction (see Figure 2 step 3) the images
were splited into patches with the size of 128x128
pixels.
3.6 Pre-selection
In this approach, a entropy value was determined
which was used to characterizes the image quality.
Unlike a training based approach the decision was
made using a single value. The pre-selection was
therefore based on a threshold value. The so-called
Shannon Entropy Value is a value that measures the
information content in data and cam be used as a mea-
sure of image quality. Based on that, an approach for
patch selection is applied to choose the patch with
higher entropy, i.e. higher quality and information
content. The entropy of a patch I is calculated here
by summing up the entropy of each of the three chan-
nels of the image. The entropy of each image channel
is the sum of all pixel values probability p(i) multi-
plied by log
2
of those probabilities. The probability
of a pixel value p(i) is obtained by calculating a nor-
malized histogram of the possible pixel values (here,
i = {1, . . . , 2
8
}). The entropy of a 3-channel, 8-bit im-
age can be formulated as:
E(I) = −
C=3
∑
C=1
i=2
8
∑
i=1
p(i)log
2
(p(i)) (2)
The entropy values of all patches were calculated
and a number of patches with the highest entropy val-
ues selected for further processing. The number of
seven patches with the highest values were considered
as adequate in order to guarantee constant computa-
tional costs. It was furthermore observed that at least
seven patches with values higher than the threshold
could be found in every image. Patches with lower
entropy values tended to show a higher error-rate.
3.7 Feature Extraction
In feature extraction, the image is assigned to a class
representing a textile fabric (see Figure 5). In the ap-
proach using patches, all divided image patches de-
scribe one single class. The well-known SURF fea-
tures (Bay et al., 2006) have shown their effectiveness
in many recent papers dealing with object recognition
tasks (Yang et al., 2007). SURF Features are scale-
invariant and robust against rotation, translation and
changing lightning conditions. Therefore they are ap-
plicable for the detection of invariant features. Be-
fore feature extraction, images were converted into a
gray-scale representation and histogram equalization
was applied. A set of interest points was extracted
using the fast hessian detector. The kind of extracted
feature points was specified using manually selected
library of 120 images. These features were further
processed within a ’bag of words’ approach using a
64-dimensional vector as a descriptor. The size of
the dictionary was examined by evaluating the over-
all performance for different dictionary sizes with the
same trainings and test sets.
Local Binary Patterns (LBP) are used to analyze
texture spectra and are often used for classification in
computer vision task. Its strength is its extreme tol-
erance towards brightness changes, since only the lo-
cal gray value changes are considered. Local Binary
Patterns represent the local structure of an image and
are invariant to monotonic changes of the brightness.
They have been applied on different tasks the field
of image recognition (Luo et al., 2013) and achieved
high detection rates(Wang et al., 2009). A darken-
ing of the image (e.g. in case of shadows occurring
in folds of the textile) has therefore no negative in-
fluence to the feature vector. After gray-scale con-
version and histogram equalization the image was di-
vided into blocks of 16x16 pixels, which resulted in
64 blocks per patch or 47,704 blocks for the full im-
age. To each pixel of the gray-scale image (except
marginal areas) was assigned a new 8-bit value. This
value was calculated from 8 neighboring pixels of the
current pixel:
LBP =
7
∑
n=0
s(i
n
− i
c
) · 2
n
(3)
SIGMAP 2016 - International Conference on Signal Processing and Multimedia Applications
102
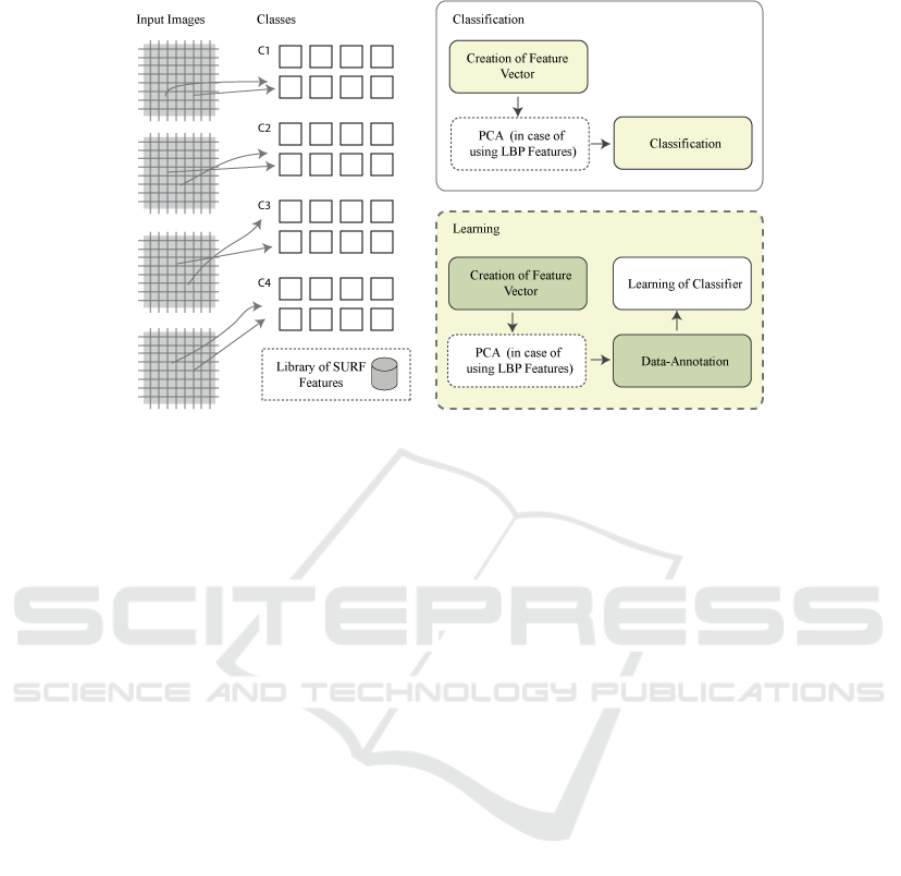
Figure 5: The left part illustrates the assignment of patches to classes based on their entropy value, the right part shows the
feature extraction, training and classification process.
For the center pixel, i
c
is the gray value of the
pixel in the gray values of adjacent pixels (contin-
uously starting left above the center pixel and then
clockwise). For each block, a normalized histogram
is calculated using the number of uniform pattern as
bins. The histograms of each block were concate-
nated to a feature vector. PCA (Principal Component
Analysis) was performed on that feature vector to re-
duce the dimensionality. As a part of it, eigenvalues,
eigenvectors and mean were calculated from a subset
of the database. By using PCA the number of com-
ponents in the feature vector was reduced by 92.03%
from 3,766 to 300 in the approach using patched. For
the full image the number of components was reduced
from 2,766,832 using the same percentage of reduc-
tion. The resulting feature vectors were used in five
fold cross validation for training and prediction.
3.8 Classification
The image classification in one of the core com-
ponents of the recognition process. The used ma-
chine learning approach requires learning a classi-
fier. Changes in the previous steps can have a high
impact on the recognition results. The previously
described features are stored as feature vectors F :
F = f
1
, f
2
, f
3
, . . . , f
7
in the patch based approach. In
the image based approach only one feature vector is
used. For further processing all feature vectors were
annotated manually and stored in form of a matrix.
The four classes C1-C4 (see Figure 5) representing
the four different textiles were used in the identifica-
tion scenario. In the verification scenario only two
classes were used in a one versus all classification ap-
proach. One representing a certain textile type (class
1) and another represents all other classes (class n).
For classification of the resulting feature vectors the
classifiers AdaBoost and SVM(Chang and Lin, 2011)
were used for supervised learning. In case of SVM
classification, C-Support Vector Classification which
allows imperfect separation of classes with penalty
multiplier and radial basis function was used. Ad-
aBoost combines the performance of many ’weak’
decision tree classifiers to produce a powerful com-
mittee(Hastie et al., 2005). The AdaBoost variante
’Gentle’(Friedman et al., 2000) was choosen because
it puts less weight on outlier data and was therefore
expected to work better with images of defect tex-
tiles. Five fold cross validation folders were used to
verify the classification results. In the approach using
patches instead of the full image, only a number of
patches with the highest entropy value were used to
create the cross validation folds. This is reasoned be-
cause it was expected that patches with a higher infor-
mation value show a lower error rate. It was further-
more expected that this approach saves computational
costs. The scores of all patches that belong to one tex-
tile were fused using mean-rule fusion-rule. Verifica-
tion and identification scenarios have been evaluated.
4 RESULTS AND EXPERIMENTS
The identification scenario was evaluated with a qual-
itative selection of image patches (patches), as well
as without such a pre-selection (full-image). The
Rapid Classification of Textile Fabrics Arranged in Piles
103

pre-selection was thereby done using the Shannon-
entropy value. The accuracy indicates the success-
ful differentiation between the 4 classes (True Posi-
tive Rate). It was tested against a data set of 537 im-
ages. The images were equally distributed over five
subsets. For each training of a classifier four subsets
were used for training and one for testing. The results
in identification show that the approach using patches
resulted in a weaker performance compared to the one
using the full image. The SURF interest point fea-
tures in a Bag of Words (BOW) approach showed a
better performance than LBP feature. This may rea-
soned in their scale and rotation invariant character-
istic. In the verification scenario the same data set
was used as for the identification scenario. As SVM
and SURF outerperformed the AdaBoost classifier by
an average of 3.67% accuracy, the verification results
are only shown for the SVM classifier and SURF fea-
tures. The results show clearly better accuracy for all
textile types and a difference of only 2.89% accuracy
between the patch based approach and the approach
using the full image was obtained. A possible rea-
son for the poor performance of the approach with
pre-selection of pieces of cloth is caused by the kind
of information excluded by the algorithm. It can be
seen that discriminative information is stored in even
patches with lower entropy. The speed of the algo-
rithm using SURF features on image patches on an
Intel Core i7 4770 is 503ms. The approach using the
full image instead of patches is 923ms.
Table 3: Classification accuracy in identification scenario.
Image Size Feature Classifier Accuracy
Full Image LBP/PCA SVM 65.52%
Full Image SURF(BOW)SVM 86.43%
Patches LBP/PCA SVM 59.9%
Patches SURF(BOW)SVM 85.41%
Full Image LBP/PCA AdaBoost 63.96%
Full Image SURF
(BOW)
AdaBoost 82.10%
Patches LBP/PCA AdaBoost 59.72%
Patches SURF
(BOW)
AdaBoost 80.33%
5 CONCLUSION
In this work, fabric patterns were classified using a
database of textiles in a pile-like arrangement. There
are multiple steps for classifying the fabrics: one in-
volves extracting the features of woven fabric im-
ages, the other involves recognizing the class of wo-
Table 4: Classification accuracy in verification scenario us-
ing SVM.
Image Size Type Feature Accuracy
Full Image 1 SURF (BOW) 94.68%
Full Image 2 SURF (BOW) 89.91%
Full Image 3 SURF (BOW) 96.56%
Full Image 4 SURF (BOW) 94.96%
Patches 1 SURF (BOW) 90.01%
Patches 2 SURF (BOW) 89.26%
Patches 3 SURF (BOW) 92.14%
Patches 4 SURF (BOW) 94.95%
ven fabrics. In order to find a solution which takes
into account speed and accuracy, an approach which
used patches instead of the full image was decided
upon. Interest points as well as texture analysis based
features were deployed and evaluated using different
classifiers. For both identification and verification, the
interest point based descriptor, SURF (in combination
with bag of words and the SVM classifier), demon-
strated the best performance. The patch-based ap-
proach reduced the calculation costs needed for pre-
diction by 46% while showing reduced 3.67% less ac-
curacy the verification. With the development of fur-
ther methods, the image automatic identification and
classification of woven fabrics could promote the de-
velopment of the textile industry.
REFERENCES
A. Srikaew, K. Attakitmongcol, P. K. and Kidsang, W.
(2011). Detection of defect in textile fabrics using
optimal gabor wavelet network and two-dimensional
pca. In Advances in Visual Computing, pages 436–
445. Springer.
Abou-Taleb, H. A. and Sallam, A. T. M. (2008). On-line
fabric defect detection and full control in a circular
knitting machine. AUTEX Research Journal, 8(1).
Bay, H., Tuytelaars, T., and Van Gool, L. (2006). Surf:
Speeded up robust features. In Computer vision–
ECCV 2006, pages 404–417. Springer.
Chang, C.-C. and Lin, C.-J. (2011). Libsvm: a library for
support vector machines. ACM Transactions on Intel-
ligent Systems and Technology (TIST), 2(3):27.
Council, H. K. P. (2000). Textile Handbook 2000. The Hong
Kong Cotton Spinners Association.
F.H. She, L.X. Kong, S. and Kouzani, A. (2002). Intel-
ligent animal fiber classification with artificial neural
networks. Textile research journal, 72(7):594–600.
Friedman, J., Hastie, T., Tibshirani, R., et al. (2000). Addi-
tive logistic regression: a statistical view of boosting
(with discussion and a rejoinder by the authors). The
annals of statistics, 28(2):337–407.
SIGMAP 2016 - International Conference on Signal Processing and Multimedia Applications
104

Hastie, T., Tibshirani, R., Friedman, J., and Franklin, J.
(2005). The elements of statistical learning: data min-
ing, inference and prediction. The Mathematical In-
telligencer, 27(2):83–85.
H.Y.T. Ngan, G.K.H. Pang, S. Y. and Ng, M. (2005).
Wavelet based methods on patterned fabric defect de-
tection. Pattern recognition, 38(4):559–576.
Kang, T. J. and Kim, S. (2002). Objective evaluation of the
trash and color of raw cotton by image processing and
neural network. Textile Research Journal, 72(9):776–
782.
Kuo, C.-F. J. and Lee, C.-J. (2003). A back-propagation
neural network for recognizing fabric defects. Textile
Research Journal, 73(2):147–151.
Luo, Y., Wu, C.-m., and Zhang, Y. (2013). Facial expres-
sion recognition based on fusion feature of pca and lbp
with svm. Optik-International Journal for Light and
Electron Optics, 124(17):2767–2770.
Ngan, H. Y., Pang, G. K., and Yung, N. H. (2011). Au-
tomated fabric defect detectiona review. Image and
Vision Computing, 29(7):442 – 458.
Rebhi, A., Benmhammed, I., Abid, S., and Fnaiech, F.
(2015). Fabric defect detection using local homogene-
ity analysis and neural network. Journal of Photonics,
2015.
Sun, J. and Zhou, Z. (2011). Fabric defect detection based
on computer vision. In Artificial Intelligence and
Computational Intelligence, pages 86–91. Springer.
Wang, X., Han, T. X., and Yan, S. (2009). An hog-lbp
human detector with partial occlusion handling. In
Computer Vision, 2009 IEEE 12th International Con-
ference on, pages 32–39. IEEE.
Yang, J., Jiang, Y.-G., Hauptmann, A. G., and Ngo, C.-W.
(2007). Evaluating bag-of-visual-words representa-
tions in scene classification. In Proceedings of the
international workshop on Workshop on multimedia
information retrieval, pages 197–206. ACM.
Rapid Classification of Textile Fabrics Arranged in Piles
105
