
Do-it-yourself Local Wireless Networks: A Multidimensional Network
Analysis of Mobile Node Social Aspects
Annalisa Socievole and Salvatore Marano
DIMES, University of Calabria, Ponte P. Bucci, Rende (CS), Italy
Keywords:
Opportunistic Networks, Multi-layer Social Network, Mobility Trace Analytics, Wireless Encounters,
Facebook.
Abstract:
The emerging paradigm of Do-it-yourself (DIY) networking is increasingly taking the attention of research
community on DTNs, opportunistic networks and social networks since it allows the creation of local human-
driven wireless networks outside the public Internet. Even when Internet is available, DIY networks may form
an interesting alternative option for communication encouraging face-to-face interactions and more ambitious
objectives such as e-participation and e-democracy. The aim of this paper is to analyze a set of mobility
traces describing both local wireless interactions and online friendships in different networking environments
in order to explore a fundamental aspect of these social-driven networks: node centrality. Since node centrality
plays an important role in message forwarding, we propose a multi-layer network approach to the analysis of
online and offline node centrality in DIY networks. Analyzing egocentric and sociocentric node centrality on
the social network detected through wireless encounters and on the corresponding Facebook social network
for 6 different real-world traces, we show that online and offline degree centralities are significantly correlated
on most datasets. On the contrary, betweenness, closeness and eigenvector centralities show medium-low
correlation values.
1 INTRODUCTION
Do-it-yourself (DIY) networks (Antoniadis et al.,
2014) have been recently proposed new generation
networks where a multitude of human-driven mo-
bile devices can create local wireless networks out-
side the public Internet. In January 2014, 32 people
with expertise in Delay Tolerant Networks (DTNs)
(Fall, 2003) (De Rango et al., 2008) (De Rango et al.,
2013a), opportunistic networks (Pelusi et al., 2006),
human-computer interaction, community informatics,
urban interaction design, ethnography, media stud-
ies, arts and design grouped together in Dagstuhl to
discuss the use of such networks from an interdisci-
plinary perspective.
1
Considering the wide diffusion
of today mobile devices (e.g. smartphones, tablets,
etc.) and the impact their use has in the social life
of every individual, the study of infastructureless net-
works allowing short-range (e.g. Bluetooth and Wi-
Fi) wireless communication between nodes is gener-
ating a particularly hot research trend. When there is
no suitable network architecture like the Internet one,
1
http://www.dagstuhl.de/de/programm/kalender/semhp/
?semnr=14042
for example, an alternative option for communication
is necessary.
DIY networks are intrinsically social-based due
to human mobility and this feature is well suitable
for exchanging information in an ad hoc manner.
Hence, the analysis of sociality derived from wire-
less encounters becomes a fundamental aspect within
these networks. Moreover, online social networks like
Facebook and Twitter, for example, offer additional
data concerning online social relationships between
people, that can contribute to the analysis of the so-
cial behavior of the DIY network nodes.
Sociologists, anthropologists and psychologists
have largely studied the social behavior of individu-
als using two different approaches: egocentric analy-
sis and sociocentric analysis (Socievole and Marano,
2012). In the first approach, the analysis focuses on
the individual, taking into account his personal net-
work, in other words, nodes to which the individual is
directly connected. In the second approach, the anal-
ysis focuses on large groups of people, quantifying
internal relations and highlighting any interaction pat-
terns that influence group dynamics. The aim of this
work is to apply these two approaches to DIY net-
Socievole, A. and Marano, S.
Do-it-yourself LocalWireless Networks: A Multidimensional Network Analysis of Mobile Node Social Aspects.
DOI: 10.5220/0005963400270035
In Proceedings of the 13th International Joint Conference on e-Business and Telecommunications (ICETE 2016) - Volume 1: DCNET, pages 27-35
ISBN: 978-989-758-196-0
Copyright
c
2016 by SCITEPRESS – Science and Technology Publications, Lda. All rights reserved
27

works modeled as multi-layer social graphs (Br
´
odka
and Kazienko, 2012) composed by two layers:
• a DSN (Detected Social Network) layer built on
the wireless encounters between devices
• a OSN (Online Social Network) layer built on on-
line social ties.
In particular, we analyze nodes’ centrality (i.e., the
contribution of network position to the importance of
an individual in the network) and the communities
formed by these nodes within the online and the of-
fline contexts in order to understand the implications
these two aspects have on DIY networking. Specifi-
cally, we study the similarity between the online and
the offline worlds of DIY network users. With the
study of complex networks, the notion of central-
ity (Freeman, 1978) became an important parame-
ter to estimate the relevance of a node within a net-
work. In a DIY network, the study of the most cen-
tral nodes is an important aspect since it allows the
identification of the nodes that may act as preferred
relays for message forwarding. Also the community
formed by nodes are able to drive message dissemi-
nation. The human-driven nature of these networks,
in fact, makes network centrality and community im-
portant forwarding metrics as shown for example in
(Hui et al., 2011) (De Rango and Monteverdi, 2012)
(De Rango et al., 2013b) (Socievole et al., 2013) (So-
cievole and De Rango, 2015) (Socievole et al., 2015).
In this work, we present a detailed multi-layer so-
cial network analysis of 6 mobility traces for DIY
networks covering several networking environments
(academic, conference and urban scenarios) contain-
ing two layers of sociality: the DSN built on offline
Bluetooth encounters and the OSN built on Facebook
friendships. As a preliminary step, we focus on node
centrality answering the challenging question whether
online and offline node centralities are correlated and
hence, the two social behaviors are similar. Then, we
focus on communities, analyzing the online and of-
fline groups.
The paper has been organized as follows. Section
2 provides background information on the analysis of
online and offline sociality. Section 3 describes the
datasets analyzed. Section 4 briefly details the social
network model adopted. Section 5 describes the so-
ciocentric and the egocentric approaches used to per-
form our analysis. Finally, in Section 6, we present
our results and draw the main conclusions in Section
7.
2 RELATED WORKS
The relationship between human encounters and on-
line social relations has been the focus of several re-
searches in these last years. In (Hossmann et al.,
2012), for example, two datasets of self-reported data
about social, mobility and communication ties of
online social network users (Facebook, Twitter and
Gowalla) are analyzed showing that social ties are
tightly coupled with mobility and also with commu-
nication. In (Arnaboldi et al., 2013), a detailed anal-
ysis of a Facebook dataset is presented proving that
the number of social relationships an individual can
actively maintain is close to the Dunbar’s number
(150) found in other examples of offline social net-
works. Moreover, the authors present a number of
linear models to predict virtual tie strength from a set
of Facebook variables. In (Dunbar et al., 2015), the
layered structure of the nodes within two Facebook
datasets and a Twitter dataset is analyzed to deter-
mine whether this structure is similar to the offline
face-to-face interactions previously studied on other
datasets. The results of such analysis show that the
absolute size of layers and the mean contact frequency
with alters within a layer in Facebook and Twitter
match very closely to the observed values from of-
fline networks. In addition, online communities have
structural characteristics very similar to offline face-
to-face networks.
Although the above studies analyze the relation-
ship between online and offline sociality, they do
not explore the offline sociality built on Bluetooth
or Wi-Fi encounters. As such, the results provided
within these works may not reflect the typical so-
cial behavior of a mobile user within a DIY envi-
ronment where many wireless encounters take place
and those encounters will be used for exchange mes-
sages. Other recent works such as (Bigwood et al.,
2008), (Ciobanu et al., 2012), (Gaito et al., 2012) and
(Socievole and Marano, 2012), on the contrary, have
focused on multi-layer structures where one of the
several social dimensions/layers is extracted by node
mobility. However, these works have been only fo-
cused on some datasets, some of which are not pub-
lic, exploiting different analysis criteria and providing
different conclusions. To the best of our knowledge,
there has never been a clear description of user online
and offline behavior in DIY networks followed by a
comprehensive clarification on human offline mobil-
ity and online sociality and the implications these so-
cial dimensions have on DIY networking algorithms.
To this end, we consider a wider set of datasets and
provide more meaningful conclusions with respect to
DCNET 2016 - International Conference on Data Communication Networking
28

the implications these results have on DIY network-
ing.
3 MOBILITY TRACES
We consider the following 6 real-world datasets in-
cluding the mobility data and the Facebook friend-
ships of sets of mobile nodes:
• UNICAL (Caputo et al., 2015)
• UPB (Ciobanu and Dobre, 2012)
• LAPLAND (Yoneki and Abdesslem, 2009)
• SASSY (Bigwood et al., 2011)
• Social Evolution (Madan et al., 2012)
• SIGCOMM (Pietil
¨
ainen and Diot, 2012)
Most of these datasets are freely available in the
CRAWDAD
2
repository. Table 1 summarizes the
characteristics of the selected datasets in terms of
wireless contacts data. The group of researchers who
carried out the experiments instructed the recruited
participants to carry the wireless nodes (sensors or
phones) in order to detect and log the nodes in prox-
imity range for all the duration of the experiment.
For each dataset, we focus on the week of wireless
contacts having the highest contact durations. As a
consequence, the total number of nodes, indicated in
the row Overall # of nodes, has been reduced (see
the row # of Analyzed nodes) due to the absence of
part of them during the considered week. The choice
of links with the highest contact durations has been
driven by the consideration that these links are more
significative since they represent the best social situa-
tion where a message exchange can take place. Mea-
suring, for example, centrality on a graph with links
representing a high contact rate could be misleading.
A node with high degree centrality (i.e. a high num-
ber of contacts) would be considered more central and
hence, a suitable relay. However, this node may have
had many short contacts that do not reflect the social-
ity needed for the exchange of a message. Firstly,
choosing this node as next hop, it may not have the
time needed to setup a connection for exchanging
messages if it detects a node with its Bluetooth and af-
ter few seconds this connection goes down. Secondly,
even if having the time to setup a short connection, it
may have to fragment the message thus leading to an
overload of the network and node buffers with many
message copies.
2
http://www.crawdad.org/
4 ANALYSIS METHODOLOGY
In this section, we describe the methodology used to
analyze the data. First, we shortly describe how we
model a multi-layer social network starting from mo-
bility and Facebook data. Then, we describe the cen-
trality metrics and the community detection methods
used to analyze node sociality.
4.1 Multi-layer Social Network Model
We define a multi-layer social network as in (Magnani
and Rossi, 2011), and consider unweighted graph lay-
ers since we have Facebook links (friendships) with-
out weights. Using the participants’ Facebook data in
the form of a list with {#NODE ID1, #NODE ID2,
#FRIENDSHIP FLAG} entries, where the friendship
flag indicates if two nodes are friends on Facebook
or not, we generate an OSN graph, where an edge
exists if two nodes are friends. As far as the wire-
less encounters data are concerned, the modeling of a
unique social graph from a temporal network is more
complex and is still an open problem. In this work,
we choose to form the DSN graph by setting an edge
between two nodes if they had at least one contact
during the analyzed week, by using the contact data
in the form of {#NODE ID1, #NODE ID2, #CON-
TACT TIMESTAMP} entries. We underline that the
DSN graph, even if unweighted, has been defined on
a temporal window of a week where took place the
highest contact durations. In other words, a link be-
tween two nodes in the DSN graph represents a high
contact duration. As such, even if on one hand we
loose some information on users’ social behavior (i.e.
how long a contact is), on the other hand we preserve
the aspect of long contacts and are able to easily com-
pare the DSN and OSN graphs.
In Figs. 1 - 6, we depict the two-layer graph for
each dataset using different colors for nodes belong-
ing to different communities. Here, we used the Lou-
vain community detection method (see Section 4.3).
4.2 Centrality Analysis
In this section, we describe the egocentric and socio-
centric centrality metrics adopted in this work. Within
each multi-layer network and for each centrality mea-
sure considered, we will compute the Pearson’s corre-
lation coefficient between the centrality values of the
nodes on the OSN and their centrality values on the
DSN. The Pearson’s correlation coefficient is defined
as ρ
X,Y
=
COV (X,Y )
σ
X
σ
Y
where COV (X, Y ) is the covari-
ance between the two random variables X and Y , and
σ
X
and σ
Y
are the standard deviations. Correlation
Do-it-yourself LocalWireless Networks: A Multidimensional Network Analysis of Mobile Node Social Aspects
29
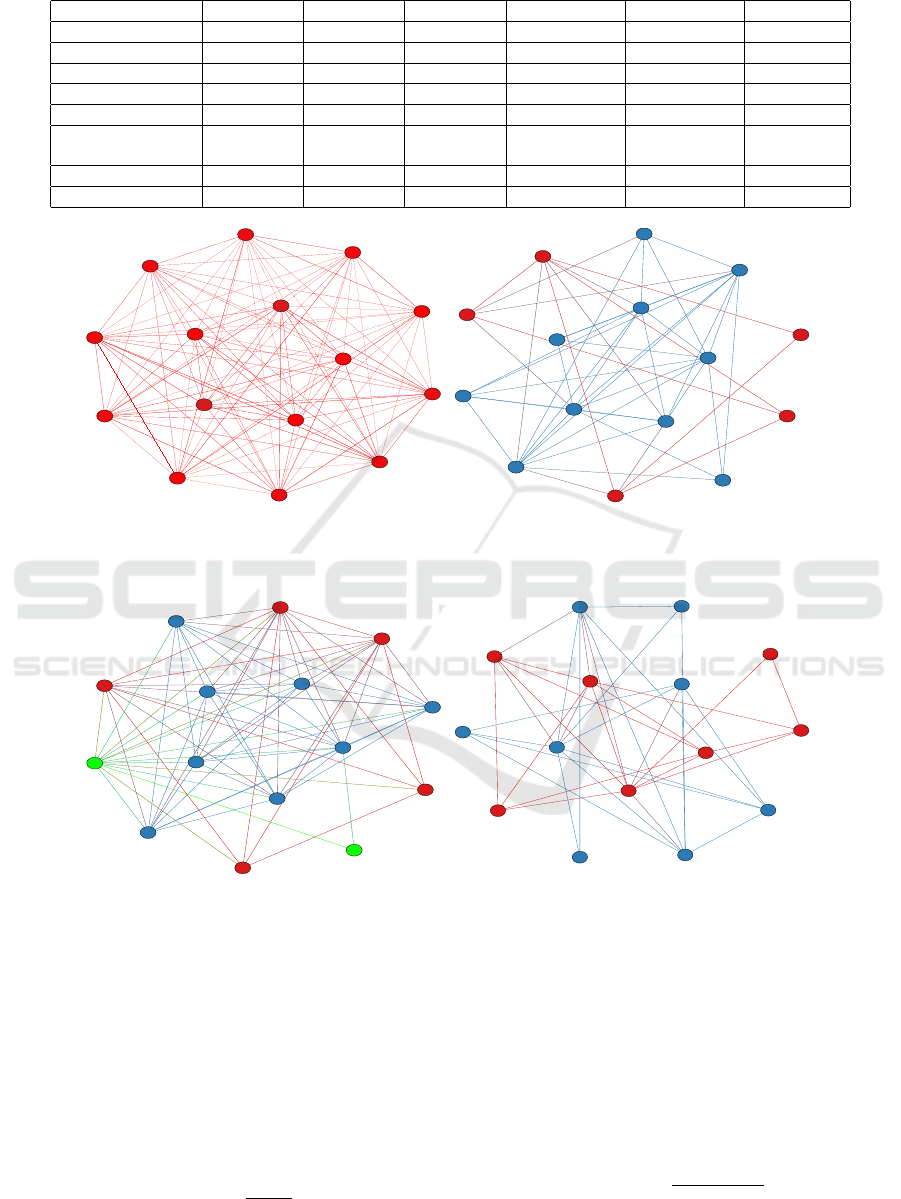
Table 1: Characteristics of wireless contacts data.
Experimental dataset UNICAL UPB LAPLAND SASSY Social Evolution SIGCOMM
Environment Academic Academic Conference Academic/Urban Academic/Urban Conference
Device type Phone Phone I-mote T-mote Phone Phone
Radio range ∼10 m ∼10 m ∼10 m ∼10 m ∼10 m [10-20] m
Granularity 180 s [5-30] min [120-600] s 6.67 s 360 s [120±10.24] s
Overall Duration 7 days 35 days 3 days 70 days 352 days 5 days
Analyzed week
from 28/01
to 22/02 2014
from 18/11
to 24/11 2011
from 09/08
to 11/08 2009
from 08/03
to 14/03 2008
from 02/03
to 08/03 2010
from 17/08
to 21/08 2009
Overall # of nodes 15 22 17 27 70 76
# of analyzed nodes 15 15 17 24 55 67
11
22
33
44
55
66
77
88
99
1010
1111
1212
1313
1414
1515
(a)
(b)
Figure 1: UNICAL (a) DSN and (b) OSN graph layers.
(a)
(b)
Figure 2: UPB (a) DSN and (b) OSN graph layers.
analysis aims at finding linear relationships between
the same centrality measure over the two social lay-
ers.
4.2.1 Betweenness
Betweenness centrality (Freeman, 1977) measures the
frequency with which a node is present on the shortest
path. For node i, it is defined as:
C
b
(i) =
N
∑
i6= j6=k
g
jk
(i)
g
jk
(1)
where g
jk
(i) is the number of shortest paths from j to k
passing through i, g
jk
is the total number of geodesic
paths from j to k and N is the network size.
4.2.2 Closeness
Closeness centrality (Sabidussi, 1966) is defined as
the inverse of the sum of the shortest paths between a
node towards each other node in the network:
C
c
(i) =
1
∑
N
j=1
d(i, j)
(2)
DCNET 2016 - International Conference on Data Communication Networking
30
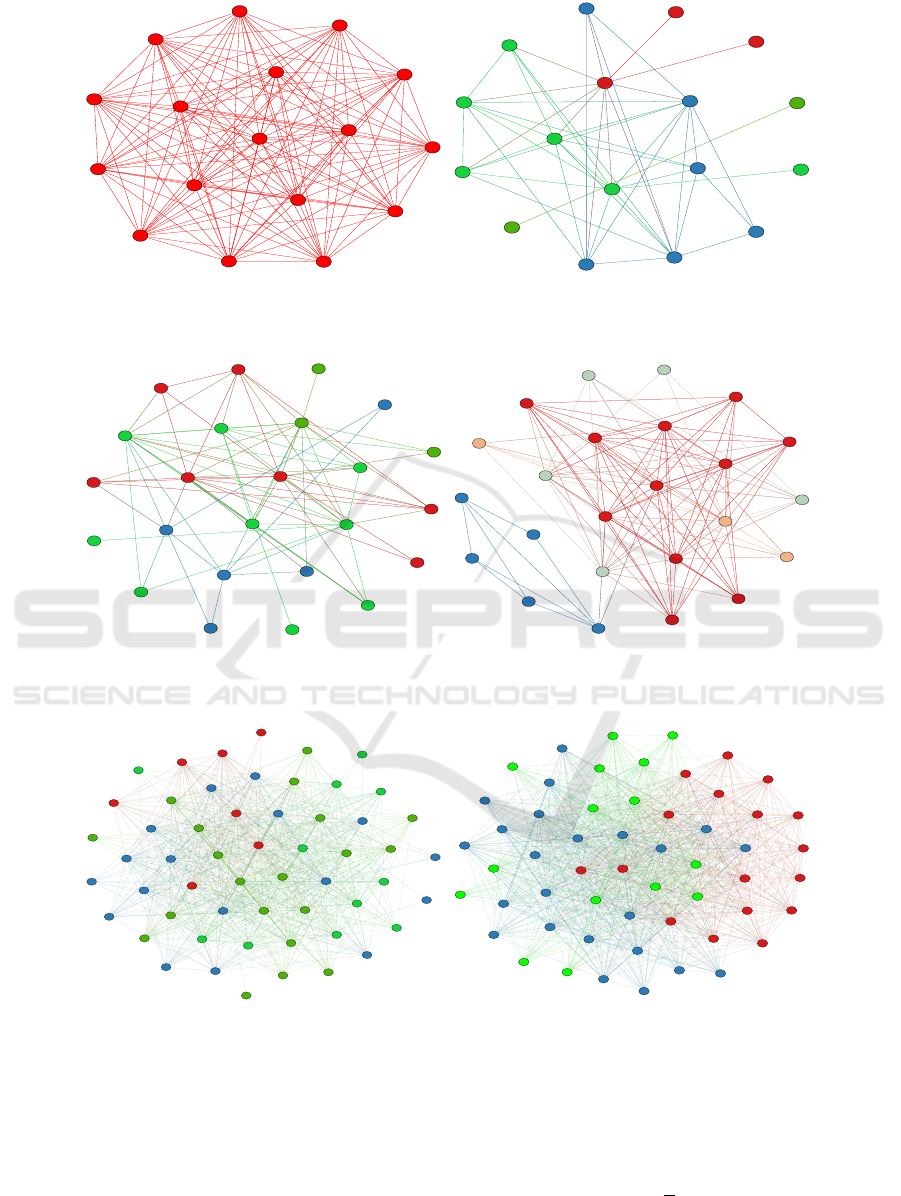
(a)
(b)
Figure 3: LAPLAND (a) DSN and (b) OSN graph layers.
(a)
(b)
Figure 4: SASSY (a) DSN and (b) OSN graph layers.
(a)
(b)
Figure 5: Social Evolution (a) DSN and (b) OSN graph layers.
where d(i, j) is the weighted shortest path from the
reference node i to each node in the network.
4.2.3 Eigenvector
For eigenvector centrality (Bonacich, 1972), the cen-
trality of a node is proportional to the sum of the cen-
trality values of all its neighboring nodes. Using the
adjacency matrix A of the graph, the eigenvector cen-
trality for a node i is defined as:
C
e
(i) =
1
λ
N
∑
j=1
A
i j
C
e
( j) (3)
where λ is the largest eigenvalue.
Do-it-yourself LocalWireless Networks: A Multidimensional Network Analysis of Mobile Node Social Aspects
31

(a)
(b)
Figure 6: SIGCOMM (a) DSN and (b) OSN graph layers.
4.2.4 Degree
Degree centrality (Freeman, 1978) counts the num-
ber of connections a node has towards its neighboring
nodes. For a node i, it is defined as:
C
d
(i) =
N
∑
j
a
i j
(4)
where a
i j
= 1 if nodes i and j are connected by an
edge, a
i j
= 0 otherwise.
4.3 Ego Betweenness
Ego betweenness centrality is computed considering
just the ego network of a node. Given the adjacency
matrix A, A
2
i, j
includes the number of walks of length
2 connecting nodes i and j. It follows that A
2
[1−A]
i, j
,
where 1 is a matrix of all 1’s, gives the number of
shortest paths of length 2 joining i to j, while the sum
of the reciprocal of the entries gives the ego between-
ness.
4.4 Community Detection
To compute the similarity between communities be-
longing to two network layers, we use the normal-
ized mutual information (Danon et al., 2005) measure.
Given two networks A and B, the normalized mutual
information is defined as follows:
NMI(A, B) =
−2
∑
c
A
i=1
∑
c
B
j=1
N
i j
log
N
i j
N
N
i.
N
. j
∑
c
A
i=1
N
i.
log
Ni.
N
+
∑
c
B
j=1
N
. j
log
N. j
N
(5)
where c
A
is the number of communities in network A,
c
B
is the number of communities in network B, N
i j
is the number of nodes in the intersection between
community i from network A and community j from
network B, N is the total number of nodes, and N
i.
and N
. j
are the number of nodes in community i of
network A and community j of network B, respec-
tively. NMI(A, B) ranges between 0 and 1, where dif-
ferent communities have a mutual information of 0
and identical communities have a mutual information
of 1. The community detection methods used in this
work are described in the following subsections.
4.4.1 Louvain
Louvain method (Blondel et al., 2008) partitions the
network graph in disjoint communities and is based
on a greedy optimization technique that attempts at
optimizing the modularity of a partition of the graph.
Initially, the method searches small communities by
locally optimizing modularity. Then, it aggregates
nodes belonging to the same community and builds
a new network whose nodes are the communities.
These steps are repeated iteratively until a maximum
of modularity is attained and a hierarchy of commu-
nities is produced.
4.4.2 k-CLIQUE
This method, also known as Clique Percolation
Method (CPM) (Palla et al., 2005), finds overlap-
ping communities where a community is defined as
the union of all k-cliques (complete subgraphs with
k nodes) that can reach each other through a series
of adjacent k-cliques, where two k-cliques are said to
be adjacent if they share k-1 nodes. Here, after sev-
eral experiments, we have set k = 5 both for the DSN
and the OSN, being this value suitable for the datasets
chosen.
DCNET 2016 - International Conference on Data Communication Networking
32

5 RESULTS
Table 2 shows the correlation values obtained for the
centrality analysis. We do not report the correlation
values for UNICAL dataset since the DSN central-
ity values are 0 for betweenness and ego betweenness
and constant for the other centrality measures. This
results in covariance and standard deviations prod-
uct between OSN and DSN centrality that are 0. In
the case of betweenness and ego betweennes, we can
observe from Fig. 1(a) that in the DSN graph, being
complete, every node can be directly reached by each
other node, hence, no shortest paths where one node
is between couple of nodes exist and this results in a
centrality value which is 0. UNICAL mobile users, in
fact, were frequently co-located in a classroom dur-
ing lessons and this resulted in mobile nodes able to
easily detect all the other nodes of the experiment.
The constant values for closeness, eigenvector cen-
trality and degree are obviously related to UNICAL
complete structure as well. On the contrary, UNI-
CAL OSN graph (see Fig. 1(b)) is more sparse con-
sidering that not all the students involved were Face-
book friends (the participants were postgraduate stu-
dents coming from different degree courses and aca-
demic years) and results in non-zero values for all
the considered centrality measures. Here, we con-
clude that UNICAL online and offline user central-
ity behaviors are different for all the measures con-
sidered because of the wireless co-presence between
all the participants where many of these are not on-
line friends. Looking at the other datasets, we note
that LAPLAND shows also different online and of-
fline behaviors having low correlation values for all
the centrality measures. Here, the network size and
the DSN structure is similar to UNICAL (17 nodes
in LAPLAND and 15 nodes in UNICAL) and even
if the network environment is different (conference
in an extreme environment vs. university campus),
online and offline behaviors are again different be-
cause the participants are basically conference mem-
bers working on complementary research areas, not
always co-located and not all Facebook friends. Also
UPB, with a low network size (15 nodes) and dealing
with an academic environment as UNICAL, shows
low structural similarity between online and offline
centrality. Unfortunately, for this dataset, there are
not details concerning the type of participants to the
experiment (e.g. students of the same courses, under-
graduate, postgraduate or PhD students, etc.), hence,
we hypothesize that UPB participants may be students
following different academic courses considering that
not all the DSN nodes are connected and with few on-
line connections (see Fig. 2). As far as SASSY is
concerned, we observe that this dataset is character-
ized by the highest correlation values, having strong
correlation for closeness, eigenvector centrality, de-
gree and in particular, for ego betwenness (0.6224).
Here, the group of tracked participants shows interest-
ing similar online and offline capabilities of locally in-
fluencing data flow. SASSY betweenness correlation
values, on the contrary, are very low. However, even if
this dataset shows similar online and offline behaviors
for most of the centrality types probably due to the
group of undergraduate students that may be friends,
if we consider all the other datasets, we can conclude
that, in general, there is a weak correlation between
OSN and DSN centralities. The obtained low correla-
tion values, in fact, reflect online and offline behaviors
different, both in the sociocentric and the egocentric
case. In particular, we note that for SIGCOMM and
Social Evolution datasets, characterized by a higher
number of nodes (67 and 55, respectively), the corre-
lation between each centrality measure assumes val-
ues very close to 0. In the first dataset, for exam-
ple, the participants are members of a big conference
mostly working on different research topics that were
located in different areas during the experiment due
to the different sessions where they attended, and few
of them were Facebook friends (see the very sparse
OSN graph compared to the DSN graph in Fig. 6).
In the second dataset dealing with undergraduate stu-
dents of a dormitory, on the contrary, many of the par-
ticipants are Facebook friends as can be observed by
the denser OSN graph in Fig. 5(b). However, OSN
and DSN graphs are significantly different consider-
ing centrality. Here, the students involved have more
virtual relationships than physical encounter opportu-
nities as can be observed in Fig. 5.
The results of this analysis clearly show that the
centralities of the Bluetooth-based social networks
differ from those of the Facebook social networks.
This happens because the co-location in a wireless
environment implies both connections between nodes
carried by individuals having an interaction (i.e. peo-
ple knowing each other and talking together) and con-
nections between nodes that are just in proximity
(e.g., strangers in the same room). In the Facebook
case, on the contrary, a node has only connections that
have been established intentionally. As such, the DSN
and the OSN result in structures that are different and
leading to different node centralities. From the results
of this analysis, we conclude that in the design of DIY
networking algorithms, this low correlation between
online and offline behavior should be taken into ac-
count. As an example, when a social-based forward-
ing algorithm needs to initialize the social behavior of
a node in the bootstrapping phase of the network, no
Do-it-yourself LocalWireless Networks: A Multidimensional Network Analysis of Mobile Node Social Aspects
33

Table 2: Correlation between OSN and DSN centrality measures.
Experimental dataset
Correlation
Betweenness Closeness Eigenvector Degree Ego Betweenness
UPB 0.2151 0.0988 -0.015 0.1541 0.2587
LAPLAND 0.1446 -0.1454 -0.1498 -0.098 0.1455
SASSY 0.05 0.5791 0.5135 0.5251 0.6224
SOCIAL EVOLUTION 0.0492 0.0278 0.1058 0.089 0.0816
SIGCOMM 0.0533 0.1052 0.0268 0.0573 0.0012
Table 3: Similarity (Normalized Mutual Information) between OSN and DSN communities.
Experimental datasets
UNICAL UPB LAPLAND SASSY Social Evolution SIGCOMM
NMI (OSN , DSN)
Louvain 0.3975 0.5738 0.3192 0.2521 0.0864 0.3466
k-CLIQUE 0.5026 0.3849 0 0.1611 0 0.0103
information or partial social information is available
because of the short history of contacts. In this case,
the algorithm needs time to reconstruct the social be-
havior of a node in order to exploit this feature for im-
proving message delivery. Hence, the node’s online
behavior could be considered. However, considering
the results of our analysis, this node’s online central-
ity should be conveniently leveraged with the avail-
able offline social centrality in order to find good for-
warding paths and obtain improvements in message
delivery.
In Table 3, we show the NMI quantifying the sim-
ilarity between layers in terms of communities for
each community detection method. UNICAL and
UPB datasets, show a significant similarity degree in
forming online and offline groups, both with Louvain
(see, for example, OSN and DSN red communities in
Fig. 2 containing both nodes 6, 22, 11, 13 and 10 and
differing just for two nodes) and k-CLIQUE commu-
nity detection methods, while, LAPLAND, SASSY
and SIGCOMM datasets show an overall low similar-
ity. Finally, Social Evolution shows OSN and DSN
communities that are completely different. By focus-
ing on the community detection method, we note that
the two methods produce different NMI values. We
thus conclude that the overlapping or non-overlapping
communities assumption influences the similarity be-
tween online and offline communities for a given
dataset. However, UNICAL, UPB and SASSY aca-
demic environments show near NMI values for the
two community detection methods. This leads us to
conclude that the three academic environments share
a similar behavior even if the community detection
methods are different. In general, by considering all
the datasets, we can conclude that the structure of on-
line and offline communities is different.
6 CONCLUSIONS
In this paper, we have focused on the emerging con-
cept of DIY networking, analyzing a set of real mo-
bility traces for DIY networks using a multi-layer net-
work approach. The aim of this initial study has been
to better understand user social behavior in terms of
centrality and communities not only focusing on the
social network layer that can be built on mobility data,
but also on the available additional information pro-
vided by the social network layer built on Facebook
friendships. Our results show that network centralities
and communities vary notably in the online and the
offline social world. As such, in the design of future
social-based algorithms for DIY networks, these fea-
tures should be taken into account. For future works,
we are planning to further analyze user behavior in
multi-layer DIY networks focusing on other social as-
pects.
REFERENCES
Antoniadis, P., Ott, J., and Passarella, A. (2014). Do it
yourself networking: an interdisciplinary approach. In
Dagstuhl reports, pages 125–151.
Arnaboldi, V., Guazzini, A., and Passarella, A. (2013). Ego-
centric online social networks: Analysis of key fea-
tures and prediction of tie strength in facebook. Com-
puter Communications, 36(10):1130–1144.
Bigwood, G., Rehunathan, D., Bateman, M., Henderson, T.,
and Bhatti, S. (2008). Exploiting self-reported social
networks for routing in ubiquitous computing envi-
ronments. In Networking and Communications, 2008.
WIMOB ’08. IEEE International Conference on Wire-
less and Mobile Computing, pages 484 –489.
Bigwood, G., Rehunathan, D., Bateman, M., Henderson,
T., and Bhatti, S. (2011). CRAWDAD trace set
st andrews/sassy/mobile (v. 2011-06-03).
DCNET 2016 - International Conference on Data Communication Networking
34

Blondel, V. D., Guillaume, J., Lambiotte, R., and Lefebvre,
E. (2008). Fast unfolding of communities in large net-
works. Journal of Statistical Mechanics: Theory and
Experiment, 2008(10):P10008.
Bonacich, P. (1972). Factoring and weighting approaches
to status scores and clique identification.
Br
´
odka, P. and Kazienko, P. (2012). Multi-layered social
networks. Encyclopedia of Social Network Analysis
and Mining.
Caputo, A., Socievole, A., and De Rango, F. (2015).
CRAWDAD data set unical/socialblueconn (v. 2015-
02-08). http://crawdad.org/unical/socialblueconn/.
Ciobanu, R. I. and Dobre, C. (2012). CRAW-
DAD data set upb/mobility2011 (v. 2012-06-18)
http://crawdad.org/upb/mobility2011/.
Ciobanu, R. I., Dobre, C., and Cristea, V. (2012). Social
aspects to support opportunistic networks in an aca-
demic environment. In Ad-hoc, Mobile, and Wireless
Networks, pages 69–82. Springer.
Danon, L., Diaz-Guilera, A., Duch, J., and Arenas, A.
(2005). Comparing community structure identifica-
tion. Journal of Statistical Mechanics: Theory and
Experiment, 2005(09):P09008.
De Rango, F., Amelio, S., and Fazio, P. (2013a). Enhance-
ments of epidemic routing in delay tolerant networks
from an energy perspective. In Wireless communi-
cations and mobile computing conference (IWCMC),
2013 9th international, pages 731–735. IEEE.
De Rango, F. and Monteverdi, F. (2012). Social and dy-
namic graph-based scalable routing protocol in a DTN
network. In Performance Evaluation of Computer and
Telecommunication Systems (SPECTS), 2012 Interna-
tional Symposium on, pages 1–8. IEEE.
De Rango, F., Socievole, A., Scaglione, A., and Marano,
S. (2013b). Novel activity-based metrics for efficient
forwarding over online and detected social networks.
In Wireless Communications and Mobile Computing
Conference (IWCMC), 2013 9th International.
De Rango, F., Tropea, M., Laratta, G. B., and Marano, S.
(2008). Hop-by-hop local flow control over interplan-
etary networks based on dtn architecture. In Commu-
nications, 2008. ICC’08. IEEE International Confer-
ence on, pages 1920–1924. IEEE.
Dunbar, R., Arnaboldi, V., Conti, M., and Passarella, A.
(2015). The structure of online social networks mir-
rors those in the offline world. Social Networks,
43:39–47.
Fall, K. (2003). A delay-tolerant network architecture for
challenged internets. In Proceedings of the 2003
conference on Applications, technologies, architec-
tures, and protocols for computer communications,
SIGCOMM ’03, pages 27–34, New York, NY, USA.
ACM.
Freeman, L. (1978). Centrality in social networks concep-
tual clarification. In Social Networks, pages 215–239.
Elsevier.
Freeman, L. C. (1977). A set of measures of centrality based
on betweenness. Sociometry, 40:35-41.
Gaito, S., Rossi, G. P., and Zignani, M. (2012). Facen-
counter: bridging the gap between offline and online
social networks. In Proceedings of 8th international
conference on signal image technology and Internet
based systems (SITIS), pages 768–775.
Hossmann, T., Nomikos, G., Spyropoulos, T., and Leg-
endre, F. (2012). Collection and analysis of
multi-dimensional network data for opportunistic
networking research. Computer Communications,
35(13):1613–1625.
Hui, P., Crowcroft, J., and Yoneki, E. (2011). Bubble
rap: Social-based forwarding in delay-tolerant net-
works. Mobile Computing, IEEE Transactions on,
10(11):1576–1589.
Madan, A., Cebrian, M., Moturu, S., Farrahi, K., et al.
(2012). Sensing the” health state” of a community.
IEEE Pervasive Computing, (4):36–45.
Magnani, M. and Rossi, L. (2011). The ML-model for
multi-layer social networks. In Advances in Social
Networks Analysis and Mining (ASONAM), 2011 In-
ternational Conference on, pages 5–12. IEEE.
Palla, G., Der
´
enyi, I., Farkas, I., and Vicsek, T. (2005).
Uncovering the overlapping community structure of
complex networks in nature and society. Nature,
435(7043):814–818.
Pelusi, L., Passarella, A., and Conti, M. (2006). Oppor-
tunistic networking: data forwarding in disconnected
mobile ad hoc networks. Communications Magazine,
IEEE, 44(11):134 –141.
Pietil
¨
ainen, A. and Diot, C. (2012). CRAWDAD data
set thlab/sigcomm2009 (v. 2012-07-15). Down-
loaded from http://crawdad.cs.dartmouth.edu/thlab/
sigcomm2009.
Sabidussi, G. (1966). The centrality index of a graph. Psy-
chometrika, 31(4):581–603.
Socievole, A. and De Rango, F. (2015). Energy-aware cen-
trality for information forwarding in mobile social op-
portunistic networks. In Wireless Communications
and Mobile Computing Conference (IWCMC), 2015
International, pages 622–627. IEEE.
Socievole, A., De Rango, F., and Marano, S. (2013). Face-
to-face with facebook friends: Using online friendlists
for routing in opportunistic networks. In Personal In-
door and Mobile Radio Communications (PIMRC),
2013 IEEE 24th International Symposium on, pages
2989–2994.
Socievole, A. and Marano, S. (2012). Exploring user so-
ciocentric and egocentric behaviors in online and de-
tected social networks. In Future Internet Communi-
cations (BCFIC), 2012 2nd Baltic Congress on, pages
140 –147.
Socievole, A., Yoneki, E., Rango, F. D., and Crowcroft,
J. (2015). ML-SOR: Message routing using multi-
layer social networks in opportunistic communica-
tions. Computer Networks, 81:201–219.
Yoneki, E. and Abdesslem, F. B. (2009). Finding a data
blackhole in Bluetooth scanning. ExtremeCom.
Do-it-yourself LocalWireless Networks: A Multidimensional Network Analysis of Mobile Node Social Aspects
35
