
Modelling Population Growth, Shrinkage and Aging using a Hybrid
Simulation Approach: Application to Healthcare
Bożena Mielczarek and Jacek Zabawa
Department of Operations Research, Faculty of Computer Science and Management, Wrocław University of Technology,
Wybrzeże Wyspiańskiego 27, PL50-370 Wrocław, Poland
Keywords: Hybrid Simulation, System Dynamics, DES, Population, Age Pyramid.
Abstract: This paper describes a hybrid simulation model that integrates the System Dynamic approach with discrete
time control to formulate the projections of population evolution. The study relies on historical demographic
data and the officially formulated scenarios for the most likely population projections developed for the
region. The results of the simulation experiments provide valuable insights into dynamics of regional
demographic trends and offer a well-defined starting point for future research in the health policy field. The
intensity and structure of the demand for healthcare services depend heavily on age-gender profiles that
change due to ongoing extensions of the average expected length of life, the aging of population, the
continuing trend of declining number of births and the steadily growing number of deaths. The preliminary
findings show promise in using the hybrid simulation approach for more advanced exploration of
demography dependent health policy issues.
1 INTRODUCTION
Credible demographic forecasts are an essential and
imperative input for a range of economic studies.
The precise replication of population structure
affects the proper examination of long-term
implications of population dynamics on
macroeconomic performances. Quantitative
evaluations that include the effects of population
changes must consider demographic forecasts. There
is, for example, considerable interest in the impact
of population aging on economic growth and the
macro-economy in general (Lisenkova et al. 2013).
Financial sustainability of social security systems
depends on the size of the older population and the
percentage of insured employees (Tian & Zhao
2016). Population dynamics affect urban
development and land use (Lauf et al. 2016).
Population projections are utilized as inputs in health
policy models (Ansah et al. 2014).
One approach to including the population
forecast in the scientific analysis assumes that the
population projections are derived from census data
and are based on moderate demographic scenarios
developed and published by national statistical units
or world-wide organizations such as the World Bank
or the United Nations. Another approach is to utilize
the stochastic forecasting method to predict
population evolution. Time series modelling
techniques are frequently adopted to estimate the
basic input parameters such as fertility, mortality
and migration rates (Lutz et al. 2001). This well-
developed methodology allows for short-term
fluctuations in vital statistics. The original method of
stochastic forecasting with revisions of demographic
forecasts was developed by Lassila et al. (2014).
The primary concept of their approach is that each
update in the official population projection alters
people’s perception of the future.
Simulation studies are vital tools for analysing
the behaviour of many real-life systems and age
structured population models are often part of these
studies. When population projections are formulated
within simulation models, two options are available.
The stochastic population sub-models take into
account demographic uncertainty. Primary
parameters such as fertility, mortality and migration
may be considered as stochastic processes. Samples
are taken from the predictive distributions of future
population, and utilizing the Monte Carlo (MC)
stochastic simulations, the population distribution is
obtained (Tian & Zhao 2016). Certain authors
(Davis et al. 2010) prefer to use micro-simulation to
Mielczarek, B. and Zabawa, J.
Modelling Population Growth, Shrinkage and Aging using a Hybrid Simulation Approach: Application to Healthcare.
DOI: 10.5220/0005960800750083
In Proceedings of the 6th International Conference on Simulation and Modeling Methodologies, Technologies and Applications (SIMULTECH 2016), pages 75-83
ISBN: 978-989-758-199-1
Copyright
c
2016 by SCITEPRESS – Science and Technology Publications, Lda. All rights reserved
75

model individual behaviour and the MC process to
convert probabilities into characteristics of
individuals.
Another well-known simulation methodology
utilized to capture the population evolution is
System Dynamics (SD); this methodology proved to
be useful in policy formulation and addressing
dynamic complexity of the system (Homer & Hirsch
2006). For example, Barber and Lopez-Valcarcel
(2010) used a SD submodel to simulate a
demographic pyramid to analyse the demand for
medical specialties. Masnick and McDonnel (2010)
modelled the population utilizing the SD approach to
link individuals with health conditions to the clinical
workload.
These two approaches differ significantly. MC
simulation is performed on one or more typical
individuals who are used to describe the experience
of a larger group within a population. A model
simulates hundreds or thousands of potential
scenarios and produces forecasts as outputs, usually
in the form of relevant means, probabilities and a
dispersion of results similar to an expected value.
The SD approach is particularly helpful when
attempting to formalize a mental model of a given
problem. In addition, it is useful when analysing the
relationship between a system’s structure and its
behaviour after changes have occurred. Typically,
SD models are not designed to yield exact numerical
predictions but are intended to explore multiple
policy options.
The overall goal of our project is to build a
hybrid simulation model that would allow alignment
of short-term demographic forecasts with health
policy models to predict the future demand for
healthcare services. In this paper, we present the SD
population submodel driven by the separate discrete
module that controls the frequency of near
continuous computation and shifts the members of
age cohorts. The hybrid model enables us to perform
time-step simulations that describe population
evolution according to the continuous SD paradigm.
The ongoing demographic changes directly
influence the discrete event simulation (DES)
submodel that generates the discrete demand for
healthcare services.
The values of the input parameters are calculated
based on forecasted rates of the primary
demographic parameters, retrieved from projections
published by the Polish Central Statistical Office
(CSO). The output is expressed by the total
population in every cohort; however, each individual
in our model is distinguishable. In the latter phase of
the simulation, when individuals with health
conditions first arrive at the healthcare system, the
model records their movements. In addition, the
model creates and adjusts attributes that describe
individual patients. These attributes are sampled
from empirical distributions and characterize every
individual patient.
In our research, we expect to verify the
credibility of the approach based on the System
Dynamic method developed by Forrester (1968) and
allow a modification of the time step dt inside the
population module in response to feedback from the
discrete module.
2 HEALTHCARE SIMULATION
Simulation plays a vital role in healthcare decision
making (Mustafee et al. 2010). It is widely utilized
in research studies and is also a popular educational
tool and decision support technique that allows
stakeholders to assist in long-term planning
processes. Simulation modelling provides an
opportunity to gain deeper understanding of mass
events such as the spread of infectious diseases
(Hughes et al. 2006, Alfonesca et al. 2000); to
analyse the performance of a particular healthcare
unit: hospital, operating theatre, outpatient
department and diagnostic centre (Testi et al. 2007);
or to forecast the future behaviour of a particular
system under study (Ashton et al. 2005).
Numerous applications of simulation have been
conducted in healthcare in past decades and
according to many surveys, the discrete-event
simulation approach (DES) is the most often used
technique in the field of healthcare management (Jun
et al. 1999, Mielczarek & Uziałko-Mydlikowska
2012). However, in the health policy field, when the
objective of the study is to establish long-term
predictions of the total level of demand for health
services, the SD approach is also frequently used.
Health policy studies usually begin with an analysis
of the population structure and its dynamics on a
local, regional or national level. The intensity and
structure of population needs depend on age-gender
profiles that, in turn, evolve according to changes
that occur regarding average expected length of life,
levels of birth and death rates and fluctuations in
migration parameters (Ansah et al. 2014).
Additionally, the need of services by patients with
diagnosed diseases change in relation to the amount
of time that has passed from the moment a diagnosis
was formulated (Caro et al. 2006).
According to (Lane et al. 2000), when using the
system dynamic approach, we lose the ability to
SIMULTECH 2016 - 6th International Conference on Simulation and Modeling Methodologies, Technologies and Applications
76
include uncertain factors that are prominent in
healthcare systems. In addition, patient-oriented
issues are considered on the aggregate, instead of
individual level. However, what we gain is a
systematic view of patient movements and a more
strategic perspective of system behaviour.
In this paper we used the well-established
methodology of SD modelling to capture overall
population evolution. We modified the approach to
allow for the use of age-gender cohorts simulated by
the SD submodel to generate discrete demand for
healthcare services.
3 POPULATION
The population of interest resides in the two
subregions of Lower Silesia, the fourth largest
region in Poland. These two subregions are denoted
as the Wrocław Region (WR) and encompass nine
administrative districts: the capital of Lower Silesia
(Wrocław) and eight districts that are nearby the
capital. According to the Central Statistical Office
(GUS, 2015) the total WR population increases
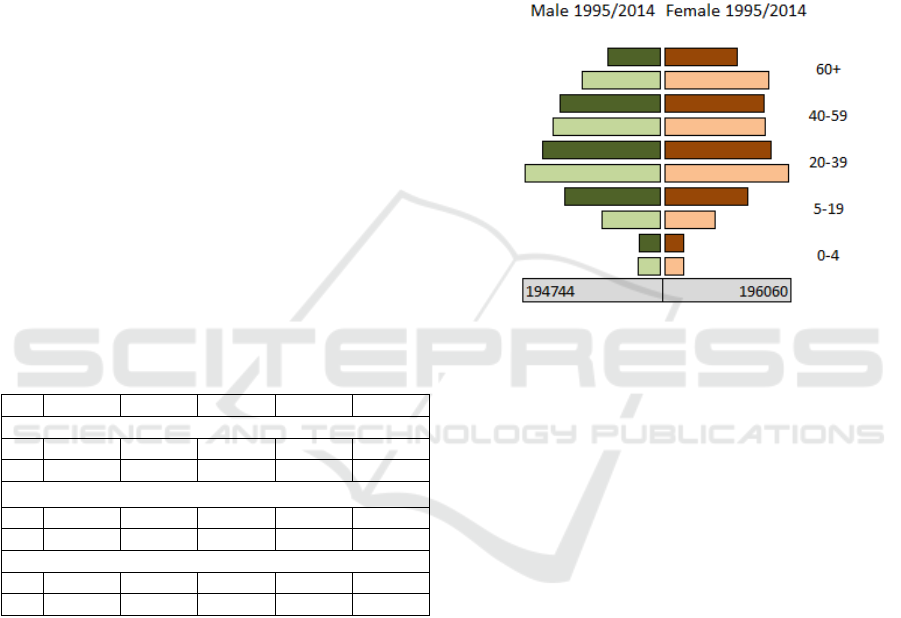
annually (Table 1, Figure 1) for both genders.
Table 1: Structure of the WR population according to age-
gender groups from 1995 to 2014.
1995 2000 2005 2010 2014
Total number of women (F) and men (M):
F: 604848 604226 608160 622112 633074
M 561852 557928 558057 570442 579707
Children ages 0−4 as % of total number of women:
F: 5.05% 4.19% 3.87% 5.03% 4.82%
M: 5.72% 4.79% 4.45% 5.74% 5.62%
People ages 60+ as % of total number of women/men:
F: 19.16% 20.40% 20.79% 23.38% 26.17%
M: 13.57% 14.05% 14.19% 16.84% 19.52%
4 MODEL
Our approach to chronological ageing is based on
the concept described by Eberlein et al. (2011). The
outline of the first, basic version of the model was
presented in (Mielczarek et al. 2014). To better
visualize the general concept, we present population
aging chains using System Dynamics notation
(Figure 2).
Ten state variables define the population inside
ten cohorts: five female and five male cohorts. Each
cohort represents a separate state variable described
by the stock level. In accordance with Krahl (2009),
we defined the internally generated state-change
events and linked them with state variables. The
state variables change at discrete times when their
associated flow rates also change. Input and output
flows that move to and from the particular stock are
aggregated into one dynamic object that controls the
appropriate state variable. The resultant flow
instantly increases or decreases the number of
individuals in the cohort. This eliminates rounding
errors and improves accuracy of the simulation.
Figure 1: Comparison of age pyramids of the WR
population using historical data from 1995 (dark colour)
and 2014 (light colour).
The initial population data matches historical
conditions in 2002 based on information published
by the CSO (GUS, 2015). The simulation begins in
2002 and runs through 2014 according to parameters
calculated on the basis of historical values extracted
from statistical data bases for the Wrocław Region.
Beyond 2014, the exogenous parameters are
extrapolated based on the forecasts published by the
CSO (Waligórska et al. 2014).
4.1 Computer Model
The computer model was constructed in the
ExtendSim environment. There are two submodels
that closely cooperate with each other: DES sub-
model was developed using modules from the Item
library and SD submodel was based on the Value
library. Both libraries are available in the standard
software package. The model uses over 700
elementary blocks and a number of integrated blocks
defined according to the hierarchic approach.
Modelling Population Growth, Shrinkage and Aging using a Hybrid Simulation Approach: Application to Healthcare
77
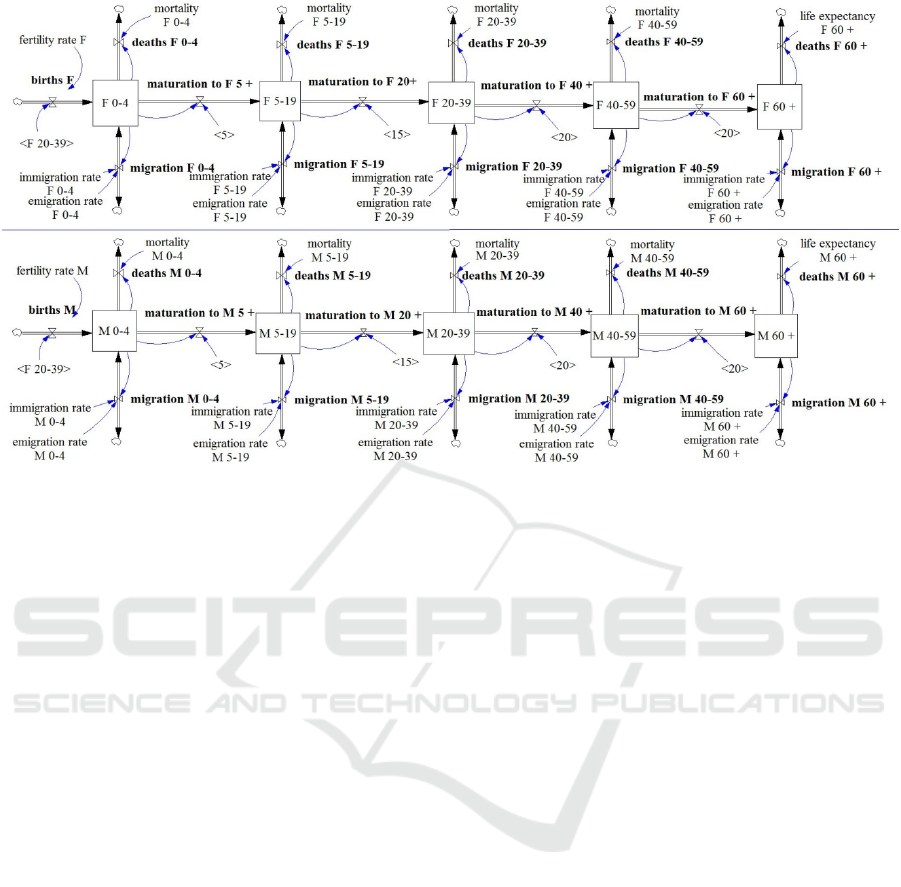
Figure 2: Population aging chains.
The SD submodel simulates the on-going
evolution of the population. It is based on ten main
integrated blocks representing ten age-gender
population cohorts (see Figure 2). The crucial role
inside the hierarchic SD blocks is played by the
Holding Tanks – the elementary blocks that
represent the stocks of the System Dynamic
approach.
The DES submodel generates patients arrivals to
the healthcare system. It consists of the integrated
block that simulates the prevalence of needs-for
service events. The additional DES module helps to
control the passage of time inside both of the
submodels. Consequently, the control of the SD
objects is overtaken by the discrete blocks.
The built-in mechanism for data base
management is applied to enable storing all the input
parameters and output simulation data in the external
data bases.
4.2 Cohorts 0 to 4
The cohorts F 0−4 and M 0−4 (Figure 2) describe
the youngest children, separately for females and
males. The youngest cohorts are affected by two
input and three output flows. There is one primary
and one additional input flow: births and
immigration and there is one primary and two
additional output flows: maturation, deaths and
emigration.
The primary input flow (births) for both females
and males depends on the current number of female
20−39 cohorts. Historical values of fertility rates
(from 2002 to 2014) are estimated based on
published data (GUS, 2015). Female fertility rates
are calculated by dividing the total number of girls
ages 0−4 by the total number of women ages 20−39
for each historical year. Accordingly, male fertility
rates are calculated by dividing the total number of
boys ages 0−4 by the total number of women ages
20−39.
The migration input and output flows depend on
migration rates (immigration and emigration) that
are calculated based on data describing the number
of young children moving to and from the Wrocław
Region and the total number in the youngest cohort.
The deaths output flow is driven by death rates
calculated based on the number of deaths among the
youngest WR citizens and the total number of
children ages 0−4 living in the Wrocław Region,
separately for females and males.
The primary output flow (maturation) is
interpreted as the average residence time that is
necessary for an individual to leave the younger
cohort and enter the older one. The values of
maturation time differ between every set of cohorts.
It is, for example, five years between F 0−4 and
F 5−10 but 20 years between M 40−59 and M 60+.
Beginning in 2015, the hypothetical values of
female and male fertility rates, migration rates and
death rates are adopted according to different
SIMULTECH 2016 - 6th International Conference on Simulation and Modeling Methodologies, Technologies and Applications
78
scenarios of population projections (Waligórska et
al. 2014)
4.3 Cohorts 5−19, 20−39 and 40−59
The series of cohorts 5−19, 20−39 and 40−59
represents the population that is between four and 60
years old, separately for females and males. Stocks
include three input and two output flows defined
similarly to those of the youngest cohort. The only
difference relates to primary input flow, where
instead of births, we use maturation from the
previous cohort.
4.4 Cohort 60 +
The final two cohorts, F 60+ and M 60+, describe
the oldest population, separately for females and
males. The cohorts are affected by two input and
two output flows: maturation from the previous
cohort, immigration, emigration and deaths. The
primary output flows (deaths) are defined using the
average life expectancy for female/male(s) at the age
of 60. Historical values of these parameters (from
2002 to 2014) are estimated based on data published
by the GUS (2015). Beginning in 2015, hypothetical
values of female and male average life expectancy
are adopted according to different scenarios of
population projections (Waligórska et al. 2014).
4.5 SD-DES Time Mechanism
The SD modelling approach is based on differential
equations and therefore enables the simulation of a
continuously changing system as well as the
continuous observation of the dynamic behaviour of
that system over time. In demography studies,
however, a more appropriate technique is to push
elements from one cohort to another at discrete
intervals to capture key events such as births and
deaths.
The time-step mechanism implemented in our
model is designed with the assumption that time
passes according to constant discrete values. At
discrete moments, the flow rates change and all
input and output flows that move to and from a
particular stock are aggregated into one dynamic
object. The resultant flow instantly increases or
decreases the number of individuals in the cohort
and the new values of stocks are registered. This
procedure is similar to sampling the values of stock
levels from the population model and then
downloading the obtained values into separate
objects (so called holding tanks). An important
feature of this approach is that not only is the
number of people belonging to a particular cohort at
any moment of simulation registered, but individual
attributes are maintained (for example age, sex or
other attributes if they were assigned to the moving
objects). This ability to memorize the attributes is an
extremely valuable quality when attempting to link
the SD and DES approaches.
The values sampled from the holding tanks are
then used to parameterize the inter-arrival time
distributions that describe the patient’s presentations
to the healthcare system and create the demand for
healthcare services. The discrete objects and their
attributes may enter the DES model without any
delay.
4.6 Model Testing and Calibration
The output measures of the population sub-model
are the number of individuals in every cohort as
registered during the simulation at the end of the
calendar year. The simulation begins in 2002 and
runs through 2014; it runs using parameters
estimated from historical values. Therefore, the
population module was tested for fit against 2002
–
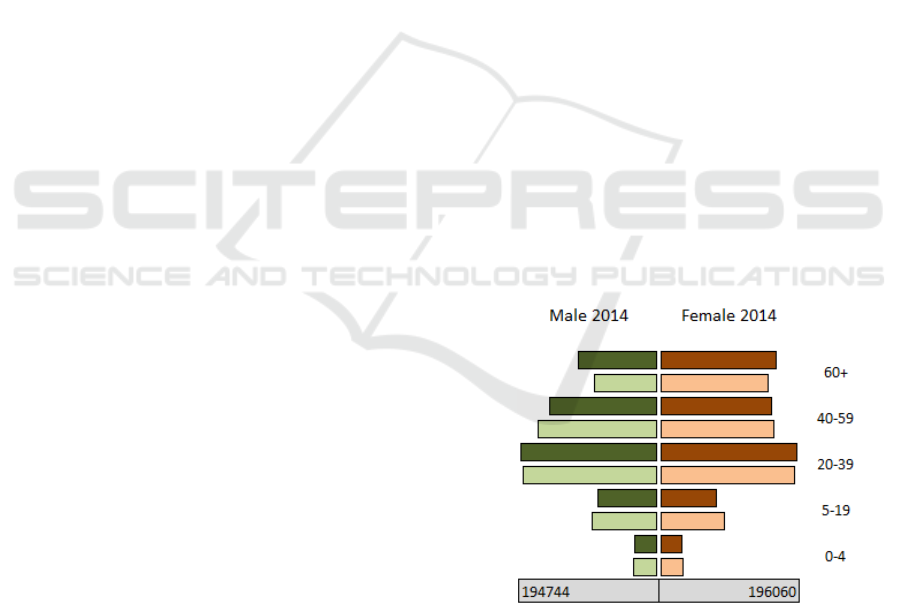
2014. Figure 3 presents two age pyramids for 2014:
the dark-coloured pyramid represents the
distribution of the WR population based on
historical data published by the GUS (2015). The
light-coloured pyramid represents the simulation
data.
Figure 3: Comparison of the age pyramids of the WR
population built from historical (dark colour) and
simulation (light colour) data.
Relevant parameters of the model include the
values of time that are necessary for the individual to
transfer from one cohort to another. The proper
values of maturation lengths are determined
utilizing an optimization technique delivered by
Modelling Population Growth, Shrinkage and Aging using a Hybrid Simulation Approach: Application to Healthcare
79

ExtendSim Optimizer. This model is run several
times, and the primary function is to minimize the
total differences between the number of males and
females in particular cohorts. This infers that
although, in consecutive years, there are differences
between historical and simulation data when
comparing the particular age cohorts, the difference
that relates to the total number of population is
minimized. The maturation lengths, which are found
when the optimization process is not able to provide
more optimal solutions, are used during the
simulation experiments in forecasting the future WR
population.
Mean absolute percentage errors (MAPEs),
calculated for the entire WR population in the
particular years, indicate that the simulation model
provides on average acceptable results for the
estimation of the WR population (Table 2).
For particular age cohorts in 2014, the MAPEs
range from 5.72% to 10.93% (male population) and
from 4.87% to 9.88% (female population). These
results demonstrate the usefulness of the System
Dynamic approach to capture the population
evolution.
Table 2: Mean Absolute Percentage Errors (MAPEs)
calculated between historical and simulation data for the
total number of the WR population in particular years.
Year Male Female
2002 0.04% 0.13%
2003 0.17% 0.20%
2004 0.27% 0.31%
2005 0.54% 0.42%
2006 0.72% 0.49%
2007 1.03% 0.58%
2008 1.22% 0.71%
2009 1.28% 0.75%
2010 0.24% 0.20%
2011 0.29% 0.19%
2012 0.24% 0.39%
2013 0.06% 0.56%
2014 0.05% 0.48%
5 SIMULATION EXPERIMENTS
From among several dozens of scenarios of
projection assumptions for population dynamics
discussed by the Government Population Council in
2014 (Waligórska et al. 2014), four scenarios were
considered to be the most likely, but only one
scenario was officially recognized and published by
the CSO. Below, we present the simulation results
assuming that the development of the WR
population will be affected by demographic trends
described in the official forecasts published by the
CSO for the years 2014
–2050.
5.1 Simulation Scenario
The following assumptions were included in the
model to run the simulation beyond the year 2015:
• Fertility rates. It is assumed that fertility rates
will incur a slight decline during the next few
years and then a gradual increase will be
observed. In 2035 the increase of fertility rates
values is expected to be approximately 20.0%
(males) and 22.0% (females).
• Death rates. It is expected that death rates will
increase gradually from 2015 to 2035. However,
the number of deaths in the middle-aged cohorts
(M 40
–59 and F 40–59) will slightly decline.
• Life expectancy. The difference between Poland
and European countries will remain at the same
level during the next 20 years. This indicates that
in the year 2035, a woman age 60 will live on
average 27.75 years and a man at this same age
will live on average 24.27 more years.
• An alignment trend will be observed between
emigration and immigration and in the year
2035, the international and internal net
migrations will decrease to almost zero. The total
number of immigrating and emigrating
individuals will decrease by approximately 20%.
5.2 Simulation Results and Discussion
The forecasted number of male and female
populations within 10 distinguished age cohorts
were obtained, see Figure 4. The simulation results
are compatible with the CSO forecasts. Aging of the
population is an irreversible phenomenon. The old-
age rate, i.e., the number of the oldest cohorts
among the entire population will increase from
18.84% in 2014 to 22.17% in 2035. The median age
of population, i.e., the age that half of the population
have not yet reached and the other half has already
lived, will in 2035 be approximately 50 years. The
subpopulation of females will exceed the male
subpopulation by more than 10%. The decrease of
children 0
–18 years old in 2035 compared to 2014
will be negligible.
SIMULTECH 2016 - 6th International Conference on Simulation and Modeling Methodologies, Technologies and Applications
80
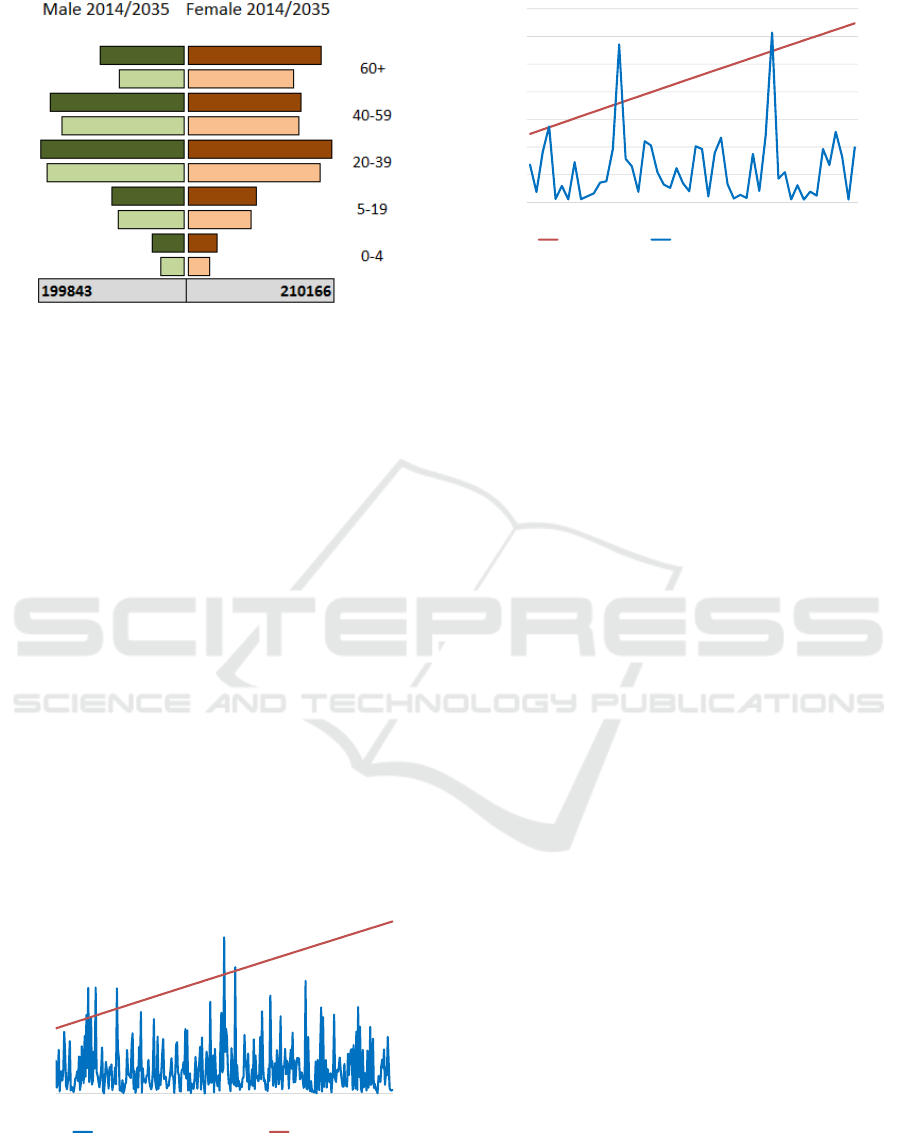
Figure 4: Comparison of the age pyramids of the WR
population built from the 2014 historical (light colour) and
2035 simulation (dark colour) data.
Figures 5 and 6 present selected output generated
by the SD module and directed to the DES module.
The stock level that represents the total number of
the F 60+ population (the upper line) from 2014 to
2016 is converted to the flow of patients arriving to
the healthcare system (the bottom line). The
indistinguishable mingling of individuals, often
referred to as the blending problem, was modelled
by the discrete volume of needs-for-service
expressed by women ages 60 and over, inhabiting
the WR. The results of the simulation demonstrate
the integration of two opposite perspectives: the
projection of long-term population evolution based
on the aggregated data (the upper line) and discrete
movement of individuals arriving to healthcare
system (the bottom line). The added value of this
approach is the flexibility in the modelling of the
arrival process. Figures 5 and 6 present the number
of patients F 60+ arriving to health units; however,
the graph 5 was created based on daily sampling and
graph 6 – based on weekly sampling.
Figure 5: Daily weekly trend of arrivals/day sampled from
F 60+ cohort.
Figure 6: Weekly trend of arrivals/day sampled from
F 60+ cohort.
6 CONCLUSIONS
Changes in population demography have a
significant effect on healthcare demand. The
provision of healthcare resources is a long-term
planning task and the increasingly complex nature of
problems faced by healthcare managers stimulates
growing interest in hybrid simulation approaches.
We have demonstrated the usefulness of
integrating the SD and DES approaches to better
explore the relationship between projections of
population dynamics and forecasted demand for
healthcare services. System Dynamics is a well-
known and often applied simulation technique to
model demography changes. This time-step
simulation produces, however, the indistinguishable
blending of age/gender cohorts. The discrete event
simulation is, in turn, the most often used technique
in the healthcare management field. This approach
easily captures individual choices made by patients.
Individual attributes, such as age, place of residence,
type of injury and requested services, influence
patients’ decisions and consequently determines the
utilization of healthcare resources. Our goal was to
construct the hybrid simulation model that would
allow linkage of short-term demographic forecasts
with a discrete model to predict future demand for
healthcare services.
This analysis is a first step in the direction of
more comprehensive studies and several research
topics seem to be warranted. The aging chain
population model needs more extensive refinement
and testing. Although the total population is
precisely simulated in the model, the sizes of
particular cohorts require additional calibration. We
also seek to better specify the uncertainty describing
the morbidity trends and to determine the impact of
this uncertainty on the demand for healthcare
services. It could be also interesting to parameterise
154000
154500
155000
155500
156000
156500
157000
157500
1
15
29
43
57
71
85
99
113
127
141
155
169
183
197
211
225
239
253
267
281
295
309
323
337
351
365
0
100
200
300
400
500
600
Yearly trend of arrivals/day F 60+ cohort
0
500
1000
1500
2000
2500
3000
154000
154500
155000
155500
156000
156500
157000
157500
1 3 5 7 9 11 13 15 17 19 21 23 25 27 29 31 33 35 37 39 41 43 45 47 49 51
F 60+ cohort Yearly trend of arrivals/week
Modelling Population Growth, Shrinkage and Aging using a Hybrid Simulation Approach: Application to Healthcare
81

the model with some external/indirect incentives
such as the economic growth, the development of
education or transportation infrastructure, and the
influence of the national pro-demography
programme that has been recently started by the
Polish Government. The so called family 500+
programme supports the families having at least two
children by granting the monetary educational
benefits. The programme is intended to increase the
fertility rates.
There are still numerous technical problems that
need to be solved to better integrate two modules
driven by different simulation paradigms. For
example, the single simulation run lasts about 25
minutes. This length of time is unacceptable when
running the stochastic simulation that requires a
number of independent replications.
ACKNOWLEDGEMENTS
This project was financed by the grant Simulation
modeling of the demand for healthcare services from
the National Science Centre, Poland, and was
awarded based on the decision
2015/17/B/HS4/00306.
REFERENCES
Alfonesca, M., Martinez-Bravo, M.T., Torrea, J.L., 2000.
Mathematical models for the analysis of Hepatitis B
and AIDS epidemics. Simulation - transactions of the
society for modeling and simulation international,
74(4), pp. 219-226.
Ansah, J.P., Eberlein, R.L., Love, S.R., Bautista, M.A.,
Thompson, J.P., Malhotra, R. and Matchar, D.B.,
2014. Implications of long-term care capacity response
policies for an aging population: A simulation
analysis. Health Policy, 116(1), pp. 105-113.
Ashton, R., Hague, L., Brandreth, M., Worthington, D.
and Cropper, S., 2005. A simulation-based study of a
NHS walk-in centre. The Journal of the Operational
Research Society, 56(2), pp. 153-161.
Barber, P. and Lopez-Valcarcel, B., 2010. Forecasting the
need for medical specialists in Spain: application of a
system dynamics model. Human Resources for
Health, 8(1), pp. 24.
Caro, J.J., Guo, S., Ward, A., Shajil, C., Malik, F. and
Leyva, F., 2006. Modelling the economic and health
consequences of cardiac resynchronization therapy in
the UK. Current medical research and opinion, 22(6),
pp. 1171-9.
Davis, P., Lay-Yee, R. and Pearson, J., 2010. Using micro-
simulation to create a synthesised data set and test
policy options: The case of health service effects under
demographic ageing. Health Policy, 97(2–3), pp. 267-
274.
Eberlein, R.L., Thompson, J.P. and Matchar, D.B., 2011.
Chronological aging in continuous time, E. Husemann
and D. Lane, eds. In: Proceedings of the 30th
International Conference of the System Dynamics
Society, July 22-26, 2011 St. Gallen, Switzerland
2011.
Forrester, J.W., 1968. Industrial dynamics - after the first
decade. Management Science, 14(7), pp. 398-415.
GUS, 2015, Główny Urząd Statystyczny. Available:
www.stat.gov.pl [December, 2015].
Homer, J.B. and Hirsch, G.B., 2006. System dynamics
modeling for public health: background and
opportunities. American Journal of Public Health,
96(3), pp. 452-458.
Hughes, G.R., Currie, C.S.M. and Corbett, E.L., 2006.
Modeling tuberculosis in areas of high HIV
prevalence. Proceedings of the 38th conference on
Winter Simulation. Monterey, California, pp. 459-465.
Jun, J.B., Jacobson, S.H. and Swisher, J.R., 1999.
Application of discrete-event simulation in health care
clinics: A survey. The Journal of the Operational
Research Society, 50(2), pp. 109-123.
Krahl, D., 2009. ExtendSim advanced techology: discrete
rate simulation, M.D. Rossetti, R.R. Hill, B.
Johansson, A. Dunkin and R.G. Ingalls, eds. In:
Proceedings of the 2009 Winter Simulation
Conference 2009, pp. 333-338.
Lane, D.C., Monefeldt, C. and Rosenhead, J.V., 2000.
Looking in the wrong place for healthcare
improvements: A system dynamics study of an
accident and emergency department. The Journal of
the Operational Research Society, 51(5), pp. 518-531.
Lassila, J., Valkonen, T. and Alho, J.M., 2014.
Demographic forecasts and fiscal policy rules.
International Journal of Forecasting, 30(4), pp. 1098-
1109.
Lauf, S., Haase, D. and Kleinschmit, B., 2016. The effects
of growth, shrinkage, population aging and preference
shifts on urban development—A spatial scenario
analysis of Berlin, Germany. Land Use Policy, 52, pp.
240-254.
Lisenkova, K., Mérette, M. and Wright, R., 2013.
Population ageing and the labour market: Modelling
size and age-specific effects. Economic Modelling, 35,
pp. 981-989.
Lutz, W., Sanderson, W. and Scherbov, S., 2001. The end
of world population growth. Nature, 412(6846), pp.
543-545.
Masnick, K. and Mcdonnell, G., 2010. A model linking
clinical workforce skill mix planning to health and
health care dynamics. Human Resources for Health,
8(1), pp. 11.
Mielczarek, B., Zabawa, J. and Lubicz, M., 2014. A
system dynamics model to study the impact of an age
pyramid on emergency demand, M.S. Obaidat, J.
Kacprzyk and T. Oren, eds. In: SIMULTECH 2014 -
Proceedings of the 4th International Conference on
Simulation and Modeling Methodologies,
SIMULTECH 2016 - 6th International Conference on Simulation and Modeling Methodologies, Technologies and Applications
82

Technologies and Applications 2014, SciTePress, pp.
879-888.
Mielczarek, B. and Uziałko-Mydlikowska, J., 2012.
Application of computer simulation modeling in the
health care sector: a survey. Simulation - transactions
of the society for modeling and simulation
international, 88(2), pp. 197-216.
Mustafee, N., Katsaliaki, K. and Taylor, S.J.E., 2010.
Profiling literature in healthcare simulation.
Simulation, 86(8-9), pp. 543-558.
Testi, A., Tanfani, E. and Torre, G., 2007. A three-phase
approach for operating theatre schedules. Health Care
Management Science, 10(2), pp. 163-72.
Tian, Y. and Zhao, X., 2016. Stochastic Forecast of the
Financial Sustainability of Basic Pension in China.
Sustainability, 8(1), pp. 46.
Waligórska, M., Kostrzewa, Z., Potyra, M. and
Rutkowska, L., 2014. Population projection 2014-
2050. CSO, Demographic Surveys and Labour Market
Department.
Modelling Population Growth, Shrinkage and Aging using a Hybrid Simulation Approach: Application to Healthcare
83
