
Searching Vaccination Strategy with Surrogate-assisted Evolutionary
Computing
Zong-De Jian, Tsan-Sheng Hsu and Da-Wei Wang
Institute of Information Science, Academia Sinica, Taipei, Taiwan
Keywords:
Agent-based Simulation, Simulation for Disease Control, Surrogate-based Genetic Algorithm.
Abstract:
Agent-based stochastic simulation is an established approach to study infectious diseases. Its advantage is the
flexibility to incorporate important concepts. The effect of various mitigation strategies has been demonstrated
using simulation models. Most of the previous studies compared a few options with a few selected scenarios.
We propose to use genetic algorithms to search for the best vaccination strategy for a given scenario with the
simulation program as fitness scorer. Vaccination efficacy varies significantly. Therefore, the real challenge is
to find a good strategy without the knowledge of it. The simulation software is efficient, yet still takes three
minutes to complete a simulation run with Taiwan population. We use surrogate to speed up the search about
1000 times. The surrogate has the average of the absolute value of error around 0.284 percent and the rank
correlation coefficient is greater than 0.98 for all the scenarios except one. The optimal solution with surrogate
has fitness value very close to use simulations. The difference is generally less than one percent. We envision
that an autonomous software searches through the huge scenario space with the help of surrogate function and
adaptively executes simulation program to revise the surrogate function to produce higher fidelity surrogate
and better search results.
1 INTRODUCTION
Agent-based stochastic simulation is an established
approach for the study of infectious diseases. The
flexibility to incorporate important concepts into sim-
ulation model is one of the advantage to such ap-
proach. However, it still needs a significant amount
of computing resources sometimes. Epidemiologists
usually have to carefully craft the scenarios to demon-
strate their points. Vaccination is one of the important
means to mitigate pandemic flu, thus determining the
vaccination priority with limited amount of vaccine
is vital. Instead of evaluating a few options, we for-
mulate it as an optimization problem and use genetic
algorithm to search for the best vaccination priority.
The search space can contain many dimensions, for
example, house-hold structure is one of the important
dimensions (Chang et al., 2015). Here we focus on
the dimension of vaccine efficacy.
The vaccine efficacy(VE) is a measure of relative
risk(RR) that generally takes the form VE = 1 − RR.
The absolute efficacy of a vaccine compares rela-
tive risk in a vaccinated group with that in a con-
trol group (Basta et al., 2008). Two important mea-
sures for vaccine efficacy are vaccine efficacy for
susceptibility(VE
s
), that is the relative risk a vacci-
nated individual being infected, and vaccine efficacy
for infectiousness(VE
i
), that is the relative risk of an
individual being infected by a vaccinated one. Vac-
cine efficacy varies significantly, for example, Basta
et al. categorized several reports of influenza vaccine
trail, and estimated that the VE
s
ranges from 0.08 to
0.79 (Basta et al., 2008).
With limited amount of available vaccine, the in-
fectious disease control agency has to determine the
amount of vaccine allocated to various groups. Usu-
ally the health care professionals has the highest pri-
ority and then the agency can use policy tools to dis-
tribute vaccines to different age groups. We focus on
the distribution of vaccine among different age groups
and search for the distribution which reduces the num-
ber of infected cases the most. For a given scenario,
that is the setting of our simulation module, the gene
encodes the vaccine distribution among age groups
and the fitness function is the total number of infected
cases. The fitness evaluation is done by running the
simulation module.
Each simulation run takes about 3 minutes, thus
the fitness evaluation becomes the bottleneck of the
optimization process. Using a faster approxima-
56
Jian, Z-D., Hsu, T-S. and Wang, D-W.
Searching Vaccination Strategy with Surrogate-assisted Evolutionary Computing.
DOI: 10.5220/0005958600560063
In Proceedings of the 6th International Conference on Simulation and Modeling Methodologies, Technologies and Applications (SIMULTECH 2016), pages 56-63
ISBN: 978-989-758-199-1
Copyright
c
2016 by SCITEPRESS – Science and Technology Publications, Lda. All rights reserved

tion fitness evaluation in place of the true fitness
function, in our case the simulation program, is
called surrogated-assisted evolutionary computation
(Jin, 2011). The idea was first suggested in the mid-
1980s (J.J. Grefenstette, 1985). We construct a sur-
rogate function, which combines table lookups and
linear interpolation.
We study 9 different vaccine efficacy settings,
bothVE
s
andVE
i
are enumerated from 0.1 to 0.9 with
the increment equal to 0.5. For each setting, the ge-
netic algorithm with simulation as well as surrogate as
fitness function are applied to search for the optimal
solutions. The top solutions for both cases point to the
arrangement to allocate more vaccine to school-age
children, which confirms the results in the literature
(Lee et al., 2010).
The fidelity of the surrogate function is studied.
The difference between the output of surrogate func-
tion and the simulation divided by the output of sim-
ulation is less than one percent in average, the worst
case is less than four percent and the average of the
absolute value of error is also less than one percent.
The search results with the surrogate in place of the
simulation system have error margin less than one
percent.
2 MATERIAL AND METHOD
In this paper, the simulation software that we used is
developed by (Tsai et al., 2010). Below is a brief de-
scription of the simulation software. The Simulation
software implements a stochastic discrete time agent-
based model. The mock population of the model is
constructed according to national demographics from
Taiwan Census 2000 Data (http://eng.stat.gov.tw/).
The connection between any two individuals indicates
the possibility of daily and relatively close contact
that could result in the successful transmission of the
flu virus. An important virus-dependent parameter
is the transmission probability which is denoted by
p
trans
. It is the probability that an effective contact re-
sults in an infection. A contact group is a daily close
association of individuals, where every member is
connected to all other members in the same group. We
designate eleven classes of such contact groups in the
model: community, neighborhood, household cluster,
household, work group, high school, middle school,
elementary school, daycare center, kindergarten, and
playgroup (Chang et al., 2015). The population size
of Taiwan is about 22.12 million. There are about
1.72 million
preschool children
(0-5 years old), about
2.36 million
elementary school children
(6-12 years
old), about 0.99 million
middle school children
(13-
15 years old), about 0.97 million
high school children
(16-18 years old), about 3.86 million
young adults
(19-29 years old), about 10.28 million
adults
(30-64
years old), and about 1.94 million
elders
(65+ years
old).
Each individual can belong to several contact
groups simultaneously at any time. The duration of
a simulation run is set at 365 days. Each day has
two 12-hour periods, daytime and nighttime respec-
tively. During daytime, contact occurs in all contact
group. School aged children go to schools. There
are around 7.8% school aged children do not go to
school in Taiwan. They stay home in our simula-
tion. Preschool children go to daycare center, kinder-
garten or playgroup. Young adults and adults go to
work group. In the nighttime, contact occurs only in
communities, neighborhoods, household clusters, and
household. School closure policy of CDC Taiwan is
also implemented. The so called 325 policy works
as follow: when two symptomatic cases occurred in
the same class with a 3 days interval then that class is
closed for 5 days. The model parameters are similar to
ones in a study by (Germann et al., 2006), with modi-
fications to fit Taiwan situation better with the help of
study outcome in contact diary study. (Fu et al., 2012)
In this paper, the scenario of the simulation is the
following: the p
trans
is set at 0.1, the vaccine is avail-
able 30 days after the index case occurred, total 2.5
million of doses are applied to different age groups
according to the priority. Only the vaccine priority
and vaccine efficacy can be changed. There are two
parameters for vaccine efficacy, they areVE
i
andVE
s
.
There are seven age groups in our simulation, the
vaccine is allocated in the unit of 10,000 doses. The
total number of possible combination is C
250+7−1
250
≈
3.69 × 10
11
. An exhaustive search is not feasible.
We thus use genetic algorithm with simulated anneal-
ing to search for optimal solution. The hybrid sim-
ulated annealing genetic algorithm(HSAGA) adds a
simulated annealing component in each iteration in
the genetic algorithm. The idea is to increase stochas-
tic variability at the early stage of evolutionary step to
escape local minima/maxima.
We define a candidate that represents a vaccine
priority. The population size is ten, and each iteration
begins with simulated annealing step to perturb each
candidate, followed by selection, crossover and mu-
tation. For a given allocation, we carried out 5 sim-
ulation runs, and the fitness score is the average the
number of infected cases. the smaller the fitter. The
best solution of the previous generation and the first
nine solutions for this generation become the candi-
dates of next generation. When five consecutive it-
erations consist of the same candidates, the process
Searching Vaccination Strategy with Surrogate-assisted Evolutionary Computing
57
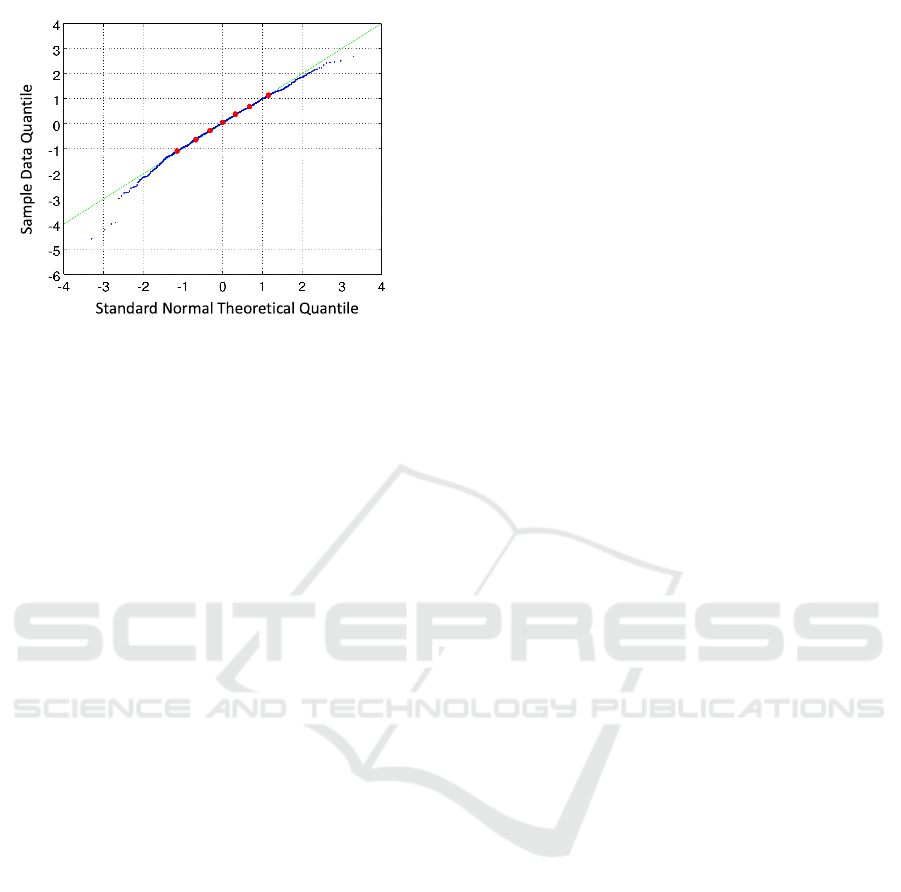
Figure 1: The quantile-quantile (q-q) plot.
stops. (the convergence of the stopping criterion dis-
cussed in Section 3.) When a new candidate appears,
the simulation program is invoked to get the fitness
score. The simulation is time consuming, we thus
explore the possibility of using surrogate in place of
simulation.
The simulation is a stochastic process. To as-
sess the stochastic variability of simulation result,
we carried out a thousand-run experiment for a typ-
ical baseline case, where VE
i
= VE
s
= 0.5 and each
age group is allocated 500,000 doses. Similar to
the finding reported in (Tsai et al., 2010), the the
number of infected cases follows normal distribu-
tion. The quantile-quantile plot is shown in Figure
1. The mean of the number of infected cases is
5,694,972 and standard deviation is around 10,850.
These numbers serve as a reference of the stochas-
tic variability of the simulation system, especially we
take 10,850/5,694,972 ≈ 0.002 as the coefficient of
variation of the simulation system.
It is feasible to use simulation results as fitness
score, however, the cost can easily become pro-
hibitively high if we allow the search space to include
more dimensions, for example, the infectiousness of
the virus which is the value of p
trans
. A more effi-
cient approximation function for the fitness score, the
surrogate, can speed up the search yet sacrifices accu-
racy.
A vaccination priority is defined by (e,
~
X) where
e = (VE
i
,VE
s
) represent the vaccine efficacy and
~
X =
(x
1
,x
2
,...,x
7
) represent the allocation of vaccine to
age groups, x
i
is the amount of vaccine for age group
i. We sometimes omit e when it is clear. Let p de-
note a vaccine priority, and we use Sim(p) to denote
the number of infected cases reported by the simula-
tion program with p. We use point instead of vac-
cination priority when there is no confusion. Let S
denotes the set of points already simulated, that is for
all p ∈ S the value of Sim(p) is known. Let C
basis
denote the baseline case with no vaccination, that is
C
basis
= Sim(
~
0). We use p
i
and p
j,k
to denote vectors
with only nonzero dimension i and nonzero dimen-
sions j and k respectively. We sometimes abuse the
notion to use p
i
and p
j,k
to denote the projection of
point p to i
th
dimension and to j
th
and k
th
dimensions
respectively.
We first construct the surrogate for points in which
only single age group is vaccinated. That is p
i
=
(0,0,...,x
i
,...,0). We set our resolution at 100,000,
that is the vaccine allocated at 100,000 doses per unit.
We carry out simulation at the resolution 100,000,
and use linear interpolation to estimate the points
not sampled. Note that only a few points are sam-
pled, i.e., simulated, other points are estimated. Let
Sim(p
i
) denote the outcome for all points with only
one nonzero dimension. Let ∆(p
i
) denote the number
of cases reduced (saved) at point p
i
, that is ∆(p
i
) =
Sim(p
i
) − Sim(
~
0), note that it is always a negative
value. Given a point p = (x
1
,...,x
7
), the single vari-
able surrogate for p, denoted by
g
Sim
1
(p), is:
g
Sim
1
(p) = Sim(
~
0) +
7
∑
i=1
∆(p
i
) (1)
The intuitive explanation is that we can add the con-
tribution of individual age group to be the effect of
vaccination priority p.
The above approximation works better if the in-
dependent assumption is closer to the reality. How-
ever, it is apparent that the vaccination of one age
group has some effect on other age groups too. Their
interaction can be intricate. To study the interac-
tion, we sample some two value points, that is p
j,k
=
(0,0,...,x
j
,0,...,x
k
,...,0), for each age group we use
one fifth of the population as the incremental unit.
That is for each age group we try five possible values,
called sampled value. There are twenty one combi-
nations of two age group, and for each combination
there are twenty five points to be simulated.
We again use δ(p
j,k
) to denote the extra cases
reduced due to interaction. That is the cases
saved after individual effects being accounted. If
p
j,k
is a sampled point then δ(p
j,k
) = Sim(p
j,k
) −
g
Sim
1
(p
j,k
), otherwise pick sampled values which
are closet lower bound and upper bound of x
j
,x
k
a
j,s
,a
j,s+1
,a
k,t
,a
k,t+1
, such that a
j,s
≤ x
j
≤ a
j,s+1
and
a
k,t
≤ x
k
≤ a
k,t+1
. The combination of these four val-
ues gives us four sampled points, and using a bilin-
ear interpolation we derive δ(p
j,k
). Given an arbitrary
point p, we can define the surrogate to be:
g
Sim
2
(p) = Sim(
~
0)+
7
∑
i=1
∆(p
i
)+
6
∑
j=1
7
∑
k= j+1
δ(p
j,k
) (2)
SIMULTECH 2016 - 6th International Conference on Simulation and Modeling Methodologies, Technologies and Applications
58
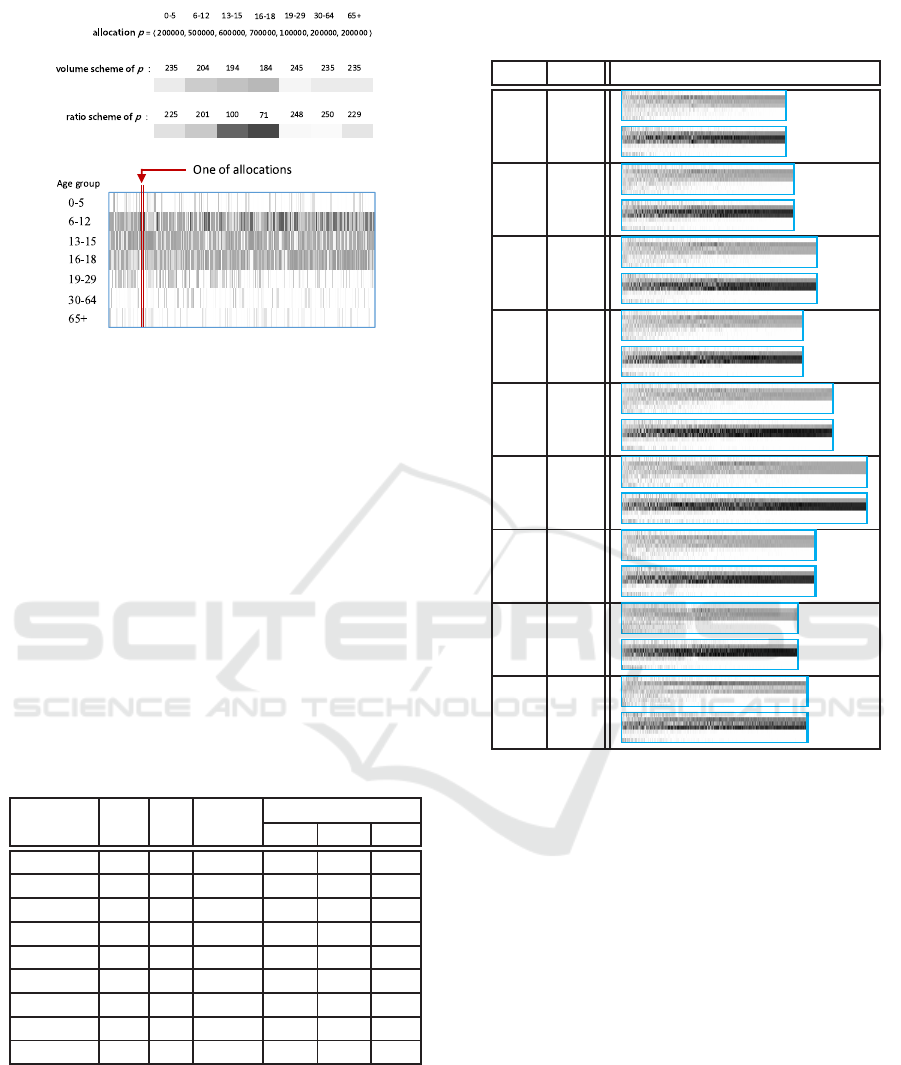
Figure 2: The gray level.
3 RESULTS
The result of HSAGA with simulation as fitness func-
tion is shown in Table 1. All the searches end in less
than one hundred iteration, and the number of points
examined is in the vicinity of one thousand. We note
that the best allocations always concentrate on vacci-
nating students regardless the efficacy of the vaccine.
To further explore and visualize the relationship
between the structure of the allocations and the fi-
nal outcomes, we use gray level to encode the allo-
cation policy: One encoding scheme, called volume
scheme, is to set the color white to denote zero dose
Table 1: The best allocation of HSAGA ( Sim(p) ).
e C I N
p (×10
4
doses)
ES MS HS
0.9,0.9 4.9 59 806 104 79 67
0.9,0.5 5.2 60 846 95 83 72
0.9,0.1 5.5 71 958 95 78 77
0.5,0.9 5.0 63 887 97 80 73
0.5,0.5 5.8 79 1,038 91 83 76
0.5,0.1* 6.6 93 1,207 83 83 83
0.1,0.9 5.1 70 950 90 81 79
0.1,0.5 6.6 64 864 70 93 87
0.1,0.1 7.9 68 911 120 51 79
’ e ’: vaccine efficacy VE
i
,VE
s
’ C ’: total cases (×10
6
)
’ I ’: total iterations
’ N ’: total allocations
’ ES ’:
elementary school children
’ MS ’:
middle school children
’ HS ’:
high school children
’ * ’:
young adults
have 1,000 doses
Table 2: The gray level of total allocations of HSAGA
(Sim(p)).
VE
i
VE
s
allocations
0.9 0.9
volume scheme
ratio scheme
0.9 0.5
0.9 0.1
0.5 0.9
0.5 0.5
0.5 0.1
0.1 0.9
0.1 0.5
0.1 0.1
and black for 2.5 million doses. Let x
i
be the num-
ber of doses for age group i, the gray level is com-
puted by following equation: g
volume
i
= 255−x
i
÷(2.5
million) × 255. Another encoding scheme, called ra-
tio scheme, is to set the color white to denote zero
percent of the age group vaccinated and black hun-
dred percent. The gray levelis computed by following
equation: g
ratio
i
= 255− x
i
÷ (the number of individu-
als of age group i)×255. For example, the gray levels
are 235 and 225 for volume scheme and ratio scheme
respectively for the allocation of 200,000 doses to
preschool children. Each age group is then assigned a
gray level according to the encoding scheme. We use
a line segment with that gray level to represent vac-
cination level of that age group, as shown in the top
half of Figure 2. The allocation is then represented
by stacking the seven line segment vertically (in the
middle part of Figure 2, we put the line segment hor-
izontally). For a set of ordered allocations, the line
segment for each allocation is stitched together ac-
cording to the ordering. The sequence of allocations
is sorted from left to right where the better allocations
Searching Vaccination Strategy with Surrogate-assisted Evolutionary Computing
59
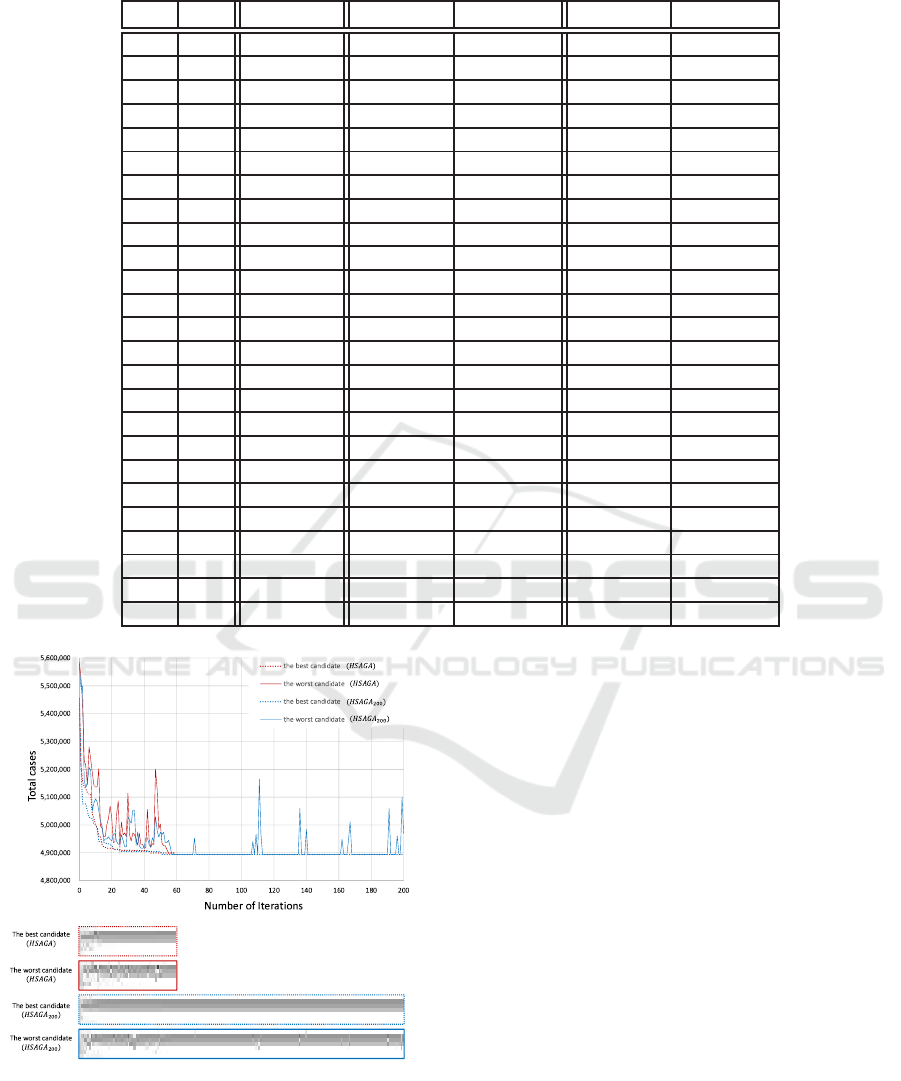
Table 3: Basic data (p
trans
= 0.1).
VE
i
VE
s
Sim(p)
g
Sim
1
(p) error 1(%)
g
Sim
2
(p) error 2(%)
0.9 0.9 4,455,427 4,788,075 7.466 4,554,759 2.229
0.9 0.7 4,698,266 5,147,952 9.571 4,731,243 0.702
0.9 0.5 4,927,159 5,456,860 10.751 4,993,846 1.354
0.9 0.3 5,136,272 5,704,787 11.069 5,234,124 1.905
0.9 0.1 5,325,681 5,916,227 11.089 5,438,429 2.117
0.7 0.9 4,525,532 4,860,707 7.406 4,600,653 1.660
0.7 0.7 4,923,963 5,344,757 8.546 4,974,683 1.030
0.7 0.5 5,305,347 5,749,844 8.378 5,348,224 0.808
0.7 0.3 5,662,708 6,102,766 7.771 5,719,132 0.996
0.7 0.1 5,989,095 6,396,327 6.800 6,017,286 0.470
0.5 0.9 4,595,987 4,926,931 7.201 4,615,127 0.416
0.5 0.7 5,154,211 5,519,088 7.079 5,217,634 1.231
0.5 0.5 5,696,168 6,054,460 6.290 5,761,392 1.145
0.5 0.3 6,197,872 6,496,988 4.826 6,269,209 1.151
0.5 0.1 6,643,572 6,871,103 3.425 6,686,484 0.646
0.3 0.9 4,667,510 4,986,218 6.828 4,715,911 1.037
0.3 0.7 5,382,617 5,706,862 6.024 5,456,423 1.371
0.3 0.5 6,088,743 6,352,334 4.329 6,146,112 0.942
0.3 0.3 6,729,075 6,904,506 2.607 6,747,887 0.280
0.3 0.1 7,263,008 7,372,166 1.503 7,314,731 0.712
0.1 0.9 4,736,192 5,055,614 6.744 4,821,752 1.807
0.1 0.7 5,618,656 5,903,184 5.064 5,665,777 0.839
0.1 0.5 6,489,120 6,668,593 2.766 6,492,402 0.051
0.1 0.3 7,237,598 7,320,671 1.148 7,259,207 0.299
0.1 0.1 7,818,985 7,838,093 0.244 7,838,812 0.254
Figure 3: The best and worst candidates for each iteration.
are on the right side.
For a given vaccine efficacy setting, the HSAGA
examined around one thousand vaccine allocations.
These allocations are sorted according to their fitness
score and the sequence is visualized according to the
method above shown in Table 2. The sorted sequence
for each setting is visualized with volume scheme, the
top one, and with ratio scheme, the bottom one. We
can see that for those allocations on the right end, the
black segments are concentrating on school children.
And according to those bottom graphs junior high and
high school students get the highest priority. More
specifically, for 2.5 million doses, 70 to 90 percent of
junior high and high school students get vaccinated
and the rest goes to elementary school students.
The rationale of our choice of stopping criteria is
explained below. We carried out long testing run with
200 iterations (HSAGA
200
) for VE
s
= VE
i
= 0.9. For
each iteration we record the best and the worst can-
didates(allocations) in population. As shown in Fig-
ure 3, the best candidate stayed roughly the same af-
ter 50 iterations. Therefore, the algorithm stops when
all candidates for the last 5 iterations stays the same.
The difference between the solutions of HSAGA and
HSAGA
200
is comparable to the coefficient of vari-
ation of the simulation system. But the number of
allocation examined are 2,379 and 806 respectively.
To study the fidelity of surrogates. We first de-
fine a specific point where every age group is allo-
cated five hundred thousand doses and evaluate this
SIMULTECH 2016 - 6th International Conference on Simulation and Modeling Methodologies, Technologies and Applications
60
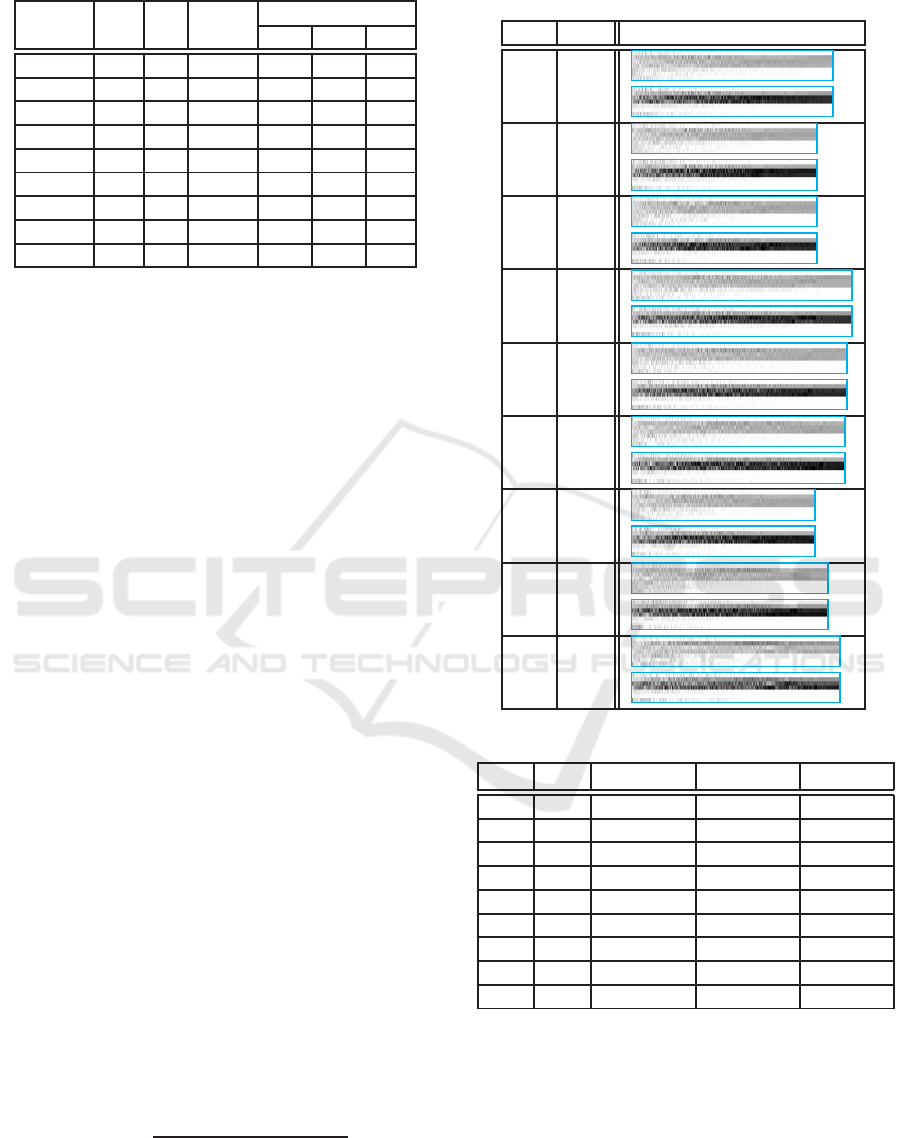
Table 4: The best allocation of HSAGA (
g
Sim
2
(p) ).
e C I N
p (×10
4
doses)
ES MS HS
0.9,0.9 4.9 72 989 89 81 80
0.9,0.5 5.2 68 910 80 90 80
0.9,0.1 5.5 69 911 80 90 80
0.5,0.9 5.0 82 1,086 90 80 80
0.5,0.5 5.8 81 1,060 88 80 82
0.5,0.1 6.7 79 1,047 72 88 90
0.1,0.9 5.1 67 901 79 88 83
0.1,0.5 6.6 71 964 79 81 90
0.1,0.1 7.9 80 1,025 100 70 80
point in twenty five vaccine efficacy scenarios, they
are the combination of VE
i
= {0.1,0.3,0.5,0.7, 0.9}
and VE
s
= {0.1, 0.3,0.5, 0.7,0.9}. The results are
summarized in Table 3. It is obvious that when vac-
cine efficacy increases the number of cases decreases.
We define the error to be the difference between the
output of the surrogate and the fitness score produced
by running simulations divided by the output of sim-
ulation. The error of the two variable surrogate is
less than 2.3 percentage which is a significant im-
provement of single variable surrogate which has er-
ror rate up to 11 percent. The improvement testi-
fies that δ(p
i, j
) captures some interaction between age
group. We only compare the two variable surrogate
with real simulation below.
The same HSAGA process is carried out with sur-
rogate in place of the simulation and and the re-
sults are summarized in Table 4. The visualization
is shown in Table 5. It is clear that the general recom-
mendation is also to vaccinate school children. Next
we feed the points selected by HSAGA with surrogate
to the simulation program and the results are summa-
rized in Table 6. The errors are all below one percent-
age and the average of absolute valueis 0.253% which
is not too far from the stochastic variation, estimated
to be 0.2 percent.
For all points simulated, total 8,492 of them. We
compute the error for each point, the average of the
absolute value of the error is 0.284% which is very
close to the coefficient of variation of the simulation
system.
For genetic algorithms, the rank preserving sur-
rogates are preferred. One metric to measure the fi-
delity of surrogates is rank correlation coefficient (r
s
)
(Loshchilov et al., 2010):
r
s
= 1−
6×
∑
N
i=1
(R
A
[i] − R
B
[i])
2
N(N
2
− 1)
(3)
All the allocations of Table 1 evaluated by the simula-
tion program are collected. For each allocation there
Table 5: The gray level of total allocations of HSAGA
(
g
Sim
2
(p)).
VE
i
VE
s
allocations
0.9 0.9
0.9 0.5
0.9 0.1
0.5 0.9
0.5 0.5
0.5 0.1
0.1 0.9
0.1 0.5
0.1 0.1
Table 6: Best points by surrogate evaluated with simulation.
VE
i
VE
s
g
Sim
2
(p) Sim(p) error(%)
0.9 0.9 4,901,232 4,920,204 -0.386
0.9 0.5 5,208,127 5,242,480 -0.655
0.9 0.1 5,507,174 5,514,175 -0.127
0.5 0.9 5,006,845 5,011,839 -0.100
0.5 0.5 5,844,636 5,831,230 0.230
0.5 0.1 6,661,038 6,663,824 -0.042
0.1 0.9 5,102,442 5,125,954 -0.459
0.1 0.5 6,616,598 6,604,124 0.189
0.1 0.1 7,851,587 7,858,971 -0.094
are two fitness scores associated with it, one by sim-
ulation program and one by surrogate function. Let
R
A
be the rank by simulation and R
B
rank by surro-
gate. The rank correlation coefficient of these two se-
quences for each setting is shown in Table 7. The co-
efficients are all greater than 98% except one at 93%.
It is reasonable to conclude that the surrogate function
preserves the ordering well.
Searching Vaccination Strategy with Surrogate-assisted Evolutionary Computing
61
Table 7: Rank correlation coefficient.
VE
i
VE
s
r
s
0.9 0.9 0.9920
0.9 0.5 0.9906
0.9 0.1 0.9904
0.5 0.9 0.9858
0.5 0.5 0.9907
0.5 0.1 0.9907
0.1 0.9 0.9852
0.1 0.5 0.9927
0.1 0.1 0.9394
Table 8: Runtime with surrogate and simulation.
VE
i
VE
s
T(Sim(p)) T(
g
Sim
2
(p))
0.9 0.9 82,653.61 53.16
0.9 0.5 89,637.37 49.65
0.9 0.1 104,406.32 49.20
0.5 0.9 91,068.05 57.12
0.5 0.5 116,980.7 55.30
0.5 0.1 145,683.09 55.28
0.1 0.9 99,839.43 47.76
0.1 0.5 85,584.94 50.45
0.1 0.1 121,445.46 54.24
’ T() ’: runtime (sec)
In Table 8, we summarize the statistics of compu-
tational complexity of the two approaches. It clearly
demonstrated that time complexitywise, the surrogate
approach is 1000 times faster than using simulation as
fitness function.
The efficacy of the vaccine is difficult to deter-
mined beforehand. Although, we searched for best
allocation for each vaccine efficacy setting. It is de-
sirable to know if vaccine efficacy has a big impact
on the choice of vaccine allocation. It is clear that
the qualitative statement, ”vaccinate school children”,
applied to all scenarios. We compute one specific
allocation, p
sp
= (0,900000,800000, 800000,0,0,0),
for all scenarios, and compare with the solutions pro-
duced by HSAGA with surrogate(Table 6, column 3).
The result is show in Table 9. Since the standard de-
viation of the simulation system is 10,850 and the co-
efficient of variation is about 0.2 percentage, it is not
too stretchy to say that allocation p
sp
works well even
if we do not know the efficacy of the vaccine.
4 CONCLUSION AND
DISCUSSION
Our results confirm the finding of previous studies
that school children should be vaccinated with high
Table 9: Impact of vaccine efficacy.
e
g
Sim
2
(p
sp
) difference error(%)
0.9,0.9 4,900,564 -668 -0.014
0.9,0.5 5,222,468 14,341 0.275
0.9,0.1 5,509,732 2,558 0.046
0.5,0.9 5,006,845 0 0.000
0.5,0.5 5,844,413 -223 -0.004
0.5,0.1 6,674,396 13,358 0.201
0.1,0.9 5,097,761 -4,681 -0.092
0.1,0.5 6,618,829 2,231 0.034
0.1,0.1 7,862,525 10,938 0.139
priority. We further demonstrated that a good allo-
cation for one specific vaccine efficacy setting works
well for other settings. Although the preliminary re-
sults are promising, a thorough study with parameters
such as transmission probability as well as household
structures is necessary before a definite conclusion
can be drawn.
We proposeto use surrogate-basedevolution com-
putation to search the vast scenarios of agent based
stochastic disease spreading simulation. The average
of error of two variable surrogate is less then 0.3%
and the optimal solution produced by genetic algo-
rithm with surrogate has fitness value very close to
the solution produced by using real fitness score. The
difference is generally less than one percent.
We note that certain age group combination has
stronger interaction, that is their collective protection
is much stronger than the sum of individual protec-
tions. And we suspect the connection patterns of the
underlying contact network implicitly defined in the
simulation play an important role.
One obvious future direction is to explore the vast
landscape of scenarios with various objective func-
tions and constraints. For example, the vaccine avail-
able date may vary, the infectiousness of the virus
strand might vary, and other mitigation strategies such
as antiviral treatment and school closure might vary.
The objective function can vary too. Instead of min-
imizing infected cases, one might want to minimize
economical cost (Meltzer et al., 1999).
Currently, we construct our surrogate using only
the output of the simulation results. However, the in-
trinsic structure used by the simulation program might
be useful information to construct more efficient and
higher fidelity surrogate. Moreover, mathematical
diseases modes might provide important insight for
this direction.
Finally, we envision that an autonomous software
searches through the huge scenario space with the
help of surrogate function and adaptively executes
simulation program to revise the surrogate function
SIMULTECH 2016 - 6th International Conference on Simulation and Modeling Methodologies, Technologies and Applications
62

to produce higher fidelity surrogate and better search
results.
REFERENCES
Basta, N. E., Halloran, M. E., Matrajt, L., and Longini, I. M.
(2008). Estimating influenza vaccine efficacy from
challenge and community-based study data. Ameri-
can Jourmal of Epidemiology, 168(12):1343–1352.
Chang, H.-J., Chuang, J.-H., Fu, Y.-C., Hsu, T.-S., Hsueh,
C.-W., Tsai, S.-C., and Wang, D.-W. (2015). The im-
pact of household structures on pandemic influenza
vaccination priority. In Proceedings of the 5th In-
ternational Conference on Simulation and Modeling
Methodologies, Technologies and Applications, pages
482–487.
Fu, Y.-c., Wang, D.-W., and Chuang, J.-H. (2012). Rep-
resentative contact diaries for modeling the spread of
infectious diseases in taiwan. PLoS ONE, 7(10):1–7.
Germann, T. C., Kadau, K., Longini, I. M., and Macken,
C. A. (2006). Mitigation strategies for pandemic in-
fluenza in the United States. Proceedings of the Na-
tional Academy of Sciences, 103(15):5935–5940.
Jin, Y. (2011). Surrogate-assisted evolutionary computa-
tion: Recent advances and future challenges. Swarm
and Evolutionary Computation, 2(1):61–70.
J.J. Grefenstette, J. F. (1985). Genetic search with approxi-
mate fitness evaluations. In International Conference
on Genetic Algorithms and Their Applications, pages
112–120.
Lee, B. Y., Brown, S. T., Korch, G. W., Cooley, P. C.,
Zimmerman, R. K., Wheaton, W. D., Zimmer, S. M.,
Grefenstette, J. J., Bailey, R. R., Assi, T.-M., and
Burke, D. S. (2010). A computer simulation of
vaccine prioritization, allocation, and rationing dur-
ing the 2009 {H1N1} influenza pandemic. Vaccine,
28(31):4875–4879.
Loshchilov, I., Schoenauer, M., and Sebag, M. (2010).
Parallel Problem Solving from Nature, PPSN XI:
11th International Conference, Krak´ow, Poland,
September 11-15, 2010, Proceedings, Part I, chap-
ter Comparison-Based Optimizers Need Comparison-
Based Surrogates, pages 364–373. Springer Berlin
Heidelberg, Berlin, Heidelberg.
Meltzer, M. I., Cox, N. J., and Fukuda, K. (1999). The
economic impact of pandemic influenza in the United
States: priorities for intervention. Emerging Infect.
Dis., 5(5):659–671.
Tsai, M.-T., Chern, T.-C., Chuang, J.-H., Hsueh, C.-W.,
Kuo, H.-S., Liau, C.-J., Riley, S., Shen, B.-J., Shen,
C.-H., Wang, D.-W., and Hsu, T.-S. (2010). Efficient
simulation of the spatial transmission dynamics of in-
fluenza. PLoS ONE, 5(11):1–8.
Searching Vaccination Strategy with Surrogate-assisted Evolutionary Computing
63
