
Simulation and Testbed Evaluation for Optimizing Energy
Consumption in Ad Hoc Networks based on OLSR Protocol
Santiago González, Pau Arce and Juan Carlos Guerri
Institute of Telecommunications and Multimedia Applications (iTEAM), Universitat Politècnica de València,
Camino de Vera s/n CP.46022, Valencia, Spain
Keywords: Ad Hoc Networks, OLSR, Energy Consumption, Overhearing Effect, Testbed Evaluation.
Abstract: This paper presents a proposal to optimize energy consumption in ad hoc networks based on the OLSR
protocol. This approach focuses on the set up of routes with less congestion level and higher energy
capacity. Therefore, in addition to the remaining energy of nodes, a new metric is introduced, the strategic
value, which reports the importance of a specific node in the network based on the numbers of neighbors it
has. In order to obtain valuable results, the evaluation was performed in a simulation environment (NS3)
and on a real testbed. In that sense, an actual ad hoc network was implemented using embedded devices
(Raspberry Pi). Results show a decrease in energy consumption, especially in zones with the highest device
density, as well as an increase of the time of operation for nodes with higher amount of neighbors.
Additionally, the performed evaluation shows a positive effect in the quality of traffic flows, avoiding route
breakages and packet losses.
1 INTRODUCTION
Ad hoc networks represent an alternative in order to
implement new schemes of communication, for
example the concept of opportunistic
communication (Giordano 2014). In particular, such
approach stands out the possibility to take advantage
of the high density of mobile devices in order to set
up wireless links through a collaborative
mechanism, as described in (Tehrani et al. 2014) and
(Do et al. 2012).
Also, ad hoc networks present a real potential for
the implementation of services focused on smart
cityes, especially for the capture and fast
dissemination of data in urban zones (Bellavista et
al. 2013).
In spite of the advantages described, there are a
set of challenges attached to an ad hoc scenario.
Mainly, energy limitation in mobile devices due
to the use of batteries is a significant factor for the
design and implementation in real enviroments.
In that sense, the transmission of multimedia
traffic as well as the increase in the data rate
achieved using recent standards, such as IEEE
802.11n/ac, result in a higher traffic load and,
therefore, higher demand of energy consumption on
devices.
Moreover, wireless medium is another factor that
deserves to be analized in regard to energy
consumption, due to the operation of a radio
interface. A wireless card analyzes the power level
of detected signals in order to change to receiving
mode, or starts a transmission process if the medium
is available and there are packets to transmit. Such
mode of operation causes that a node located in an
interference zone changes to a receiving state due to
the detection of signals with a power level higher
than the threshold, even if it is not the target of data.
This effect is named overhearing and contributes
to the increase of energy consumption.
In this paper, we have focused on mechanisms at
routing level in order to optimize the energy
expenditure, specifically in Ad hoc networks based
on the OLSR protocol. In particular, OLSR
implements a mechanism to disseminate the routing
information over special nodes named MPR (Multi
Point Relay). These nodes are selected in a process
which consitently analyzes the availability to carry
out the MPR function (willingness), the number of
nodes within its connectivity area (reachability), and
the simmetry of the links with neighbour nodes
(Clausen and P. Jacquet 2003). However, the
original standard does not consider energy
limitations.
González, S., Arce, P. and Guerri, J.
Simulation and Testbed Evaluation for Optimizing Energy Consumption in Ad Hoc Networks based on OLSR Protocol.
DOI: 10.5220/0005955301290136
In Proceedings of the 13th International Joint Conference on e-Business and Telecommunications (ICETE 2016) - Volume 6: WINSYS, pages 129-136
ISBN: 978-989-758-196-0
Copyright
c
2016 by SCITEPRESS – Science and Technology Publications, Lda. All rights reserved
129

In this sense, this paper presents a new approach
in order to optimize the enegy consumption by
means of analyzing energy capacity as well as the
distribution of the nodes in the network. Thus,
energy expenditure in zones with higher device
density is reduced while the lifetime of strategic
nodes (i.e. nodes with higher connectivity, with
higher number of neighbours) is increased. The
presented proposal is called, therefore, Strategic
OLSR (S-OLSR).
The evaluation was performed, on the one hand,
in a simulation environment (NS3) (Ns3-project
2014) and, on the other hand, over a real testbed
formed by a set of ten ad hoc nodes. The testbed
was implemented using Raspberry Pi. The results
prove that the proposed scheme contributes to
reduce the energy expenditure and, additionally,
causes a positive impact on the quality of
transmitted traffic.
The paper is organized as follows. Section 2
presents related work. Section 3 describes the
mechanism of optimization proposed. The
evaluation and results in the simulation environment
is presented in Section 4. Section 5 describes the
testbed implementation as well as the experiments
performed and results. Finally, Section 6 presents
conclusions and future lines of work.
2 RELATED WORK
This section presents a classification of related work
regarding energy optimizations implemented over
the OLSR protocol.
2.1 EMPR-OLSR
A first set of solutions propose to include the
residual energy level as metric in order to select
MPR nodes. In this paper, this methodology is
referred as Energy MPR - OLSR (EMPR-OLSR).
As an example, (Wardi et al. 2011) presents a
proposal that uses this approach based on a minimun
energy threshold as a condition to consider a node
for being part of the set of MPR candidates.
A modification is proposed in (Fatima Lakrami
and Najib Elkamoun 2012), in which the willingness
parameter is defined as a function of the residual
energy and, consequently, the normal process of
selection described in the standard is used.
However, these mechanisms cause an increment
in the number of nodes selected as MPR to reach the
nodes at more than one hop. Therefore, it generates a
flooding increase of Topology Control (TC)
messages. An analysis of this effect is described in
(Mahfoudh and Minet 2008).
2.2 ER-OLSR
The second related methodology takes into account
the energy capacity of nodes for routing
computation. Consequently, these mechanisms have
been called Energy Routing – OLSR (ER-OLSR). In
this sense, (Toh 2001) proposes a cost function in
order to evaluate the energy expenditure related to a
route between transmitter and receiver nodes, and
then select the path with less cost. The main
disadvantage of such strategy is that the evaluation
is performed globally on a route and, therefore,
intermediate nodes with critical energy levels may
not be taken into account.
In order to avoid such effect, (Adoni and Joshi
2012) proposes to set the value corresponding to the
node with less residual energy in a path as the route
cost. Additionally, (Rango et al. 2008) and (De
Rango and Fotino 2009) describe schemes
conceptually similar to (Adoni and Joshi 2012), in
this case introducing a metric called MDR
(Minimum Drain Rate) that provides an estimation
about the lifetime of a node.
Nevertheless, the main drawback of these
proposals is the liability to increase the number of
hops due to an evaluation focused on a single node.
In that sense, an analysis in each node along the
route represents a better indicator about the real
energy conditions in the network.
2.3 EA-OLSR
Finally, the third mechanism described in previous
works proposes the application of the metric of
residual energy for both MPR nodes selection and
route computation, simultaneously. These proposals
have been called Energy Aware – OLSR (EA-
OLSR) in this paper.
Regarding this mechanism, (Kunz 2008) uses the
residual energy in order to select MPR nodes and
additionally, a weigth is assigned in each link
accordign to the energy capacity in the node that
forwards the traffic.
A variation of this approach is presented in
(Machado et al. 2013), which introduces the usage
of the ETX (Expected Transmission Count) metric
for route computation. Such a metric allows to
evaluate the reliability of a link and, consequently,
an indirect management of the energy capacity can
be performed.
WINSYS 2016 - International Conference on Wireless Networks and Mobile Systems
130

3 STRATEGIC OLSR (S-OLSR)
In this paper, we introduce a new metric called
Strategic Value (SV). This metric consists in an
indicator about the number of neighbor nodes within
an interference zone. Consequently, the strategic
value is related to the relative location of a node and,
therefore, provides information about the
distribution of nodes in the network.
The SV is obtained from the information
collected during the exchange of hello messages
(OLSR protocol) and, therefore, it is updated
according to the configured hello interval. Then, the
SV is used in routing computation using information
from every hop, in order to find intermediate nodes
with less strategic value. Additionally, this process is
complemented with an energy analysis. The
proposed scheme selects the nodes with an energy
capacity equal or greater than 90% compared with
the residual energy available in a competitor node.
This is performed in order to set up routes with
less overhearing effect and suitable energy capacity.
Moreover, the tolerance configured guarantees
the priority for the routes selected. The presented
approach based on OLSR protocol, that takes into
account both energy capacity and strategic value of
nodes, is called Strategic OLSR (S-OLSR).
Figure 1: Descriptive diagram of S-OLSR operation and
interference zones for nodes: (a) Node A, (b) Node B, (c)
Node C, (d) Route analysis.
Figure 1 describes a diagram showing how the
proposal works. The routing protocol is going to set
up a route between nodes src and dst. Thus, the
coverage areas depicted in Figures 1(a), (b) and (c)
indicate that nodes A, B and C, respectively, are
candidates to be forwarder nodes in order to find the
shorter route to the target. The residual energy, as
well as the SV metric for these candidate nodes are
also depicted in the diagram. Additionally, there are
a set of neighbor nodes inside the interference zone
of each candidate node. Examples of SV and
remaining energy values were defined in order to
describe the operation of the proposal.
Then, according to the scenario, node B, which
has the lower strategic value and more residual
energy, becomes the best option to forward packets
towards the destination node (dst), as can be seen in
Figure 1(d). Especially, it can be observed that the
overhearing effect is lower (7 nodes within the
interference area) when using node B as forwarder
node than when using node A or C (10 nodes and 11
nodes within the interference area, respectively).
In order to carry out the assessment, the proposal
was implemented using the NS3 simulator,
performing the required modifications to the
standard protocol (OLSR RFC3626). Mainly, the
strategic value and the residual energy information
were included inside the header of hello messages.
Regarding the residual energy, this information
is provided by the physical layer in a cross-layer
operation. Finally, the metrics are evaluated for
routing computation as described above. The
pseudo-code for the routing modification is
presented in Table I. Moreover, next section
describes the methodology used for the evaluation of
the proposal in the simulation environment.
Table 1: Algorithm S-OLSR: Operation on each node n
for routing computation.
Required: TargetNode (tn), Neighbor-Set Nodes (N),
StrategicValue (SV), Residual Energy (Er), HopNumber
(h), Address (add), EnergyTolerance (
α
).
Initialize:(add
table
, SV
table,
Er
table
= null; h = 2;
α
=0.9)
1:Begin RoutingTableComputation
2:
while (RoutingFinished = false )
3:
for (n = 0 ; n < N ; n++)
4:
if (add
n
=NextHopToadd
tn
&(add
table
=null||(SV
n
< . SV
table
& Er
n
≥
α*(Er
table
)))) then
5: add
table
= add
n
;
6: SV
table
= SV
n
;
7: Er
table
= Er
n
;
8:
endif
9:
endfor
10:
if add
table
= add
tn
then
11: RoutingFinished = true;
12:
else
13: h++;
14:
endif
15:
endwhile
16:
end
Simulation and Testbed Evaluation for Optimizing Energy Consumption in Ad Hoc Networks based on OLSR Protocol
131

4 SIMULATION EVALUATION
4.1 Methodology
Figure 2 presents a diagram of the process for the
evaluation in the simulation environment.
Figure 2: Evaluation methodology for the proposal in the
simulation environment.
First, it is worth mentioning that a video
sequence has been used as traffic flow, mainly due
to the significant load of traffic that this kind of data
involves but also because of the increasing demand
of multimedia contents among mobile users
nowadays. As can be seen in Figure 2, the process
starts from a raw file (.yuv), and it is encoded
(H264) and packaged afterwards (MP4). Finally, the
trace file containing information about size and
timestamp of video packets is obtained. This process
is performed by means of FFmpeg (FFmpeg.org
2016) and Evalvid (Klaue et al. 2003). This
descriptor file, as well as the parameters specified in
the Table 2, are used to set up the simulation in the
NS3 environment. Furthermore, Figure 3 presents
the scenario of evaluation. As can be seen, the node
0 is the source of the traffic and node 1 is the
receiver. This scenario was designed in order to
compare the pattern of energy consumption for the
mechanism ER-OLSR and the standard (RFC3626)
versus the proposed scheme (S-OLSR).
Table 2: Simulation Parameters.
Parameter Value
Mac Protocol 802.11g
Rate 54 Mbps
Rx Sensitivity -76 dBm
Tx Power Level 0 dBm
Interference Range 30m
Intensity Consumption (mA)
(Intel7260 802.11a/b/g/n)
Tx:606; Rx:485;
Idle:75
Traffic Video 300s; 100 repetitions
Video Bitrate (Average) 300 kbps
Initial Node Energy 10000 J
Figure 3: Scenario designed for the evaluation of S-OLSR.
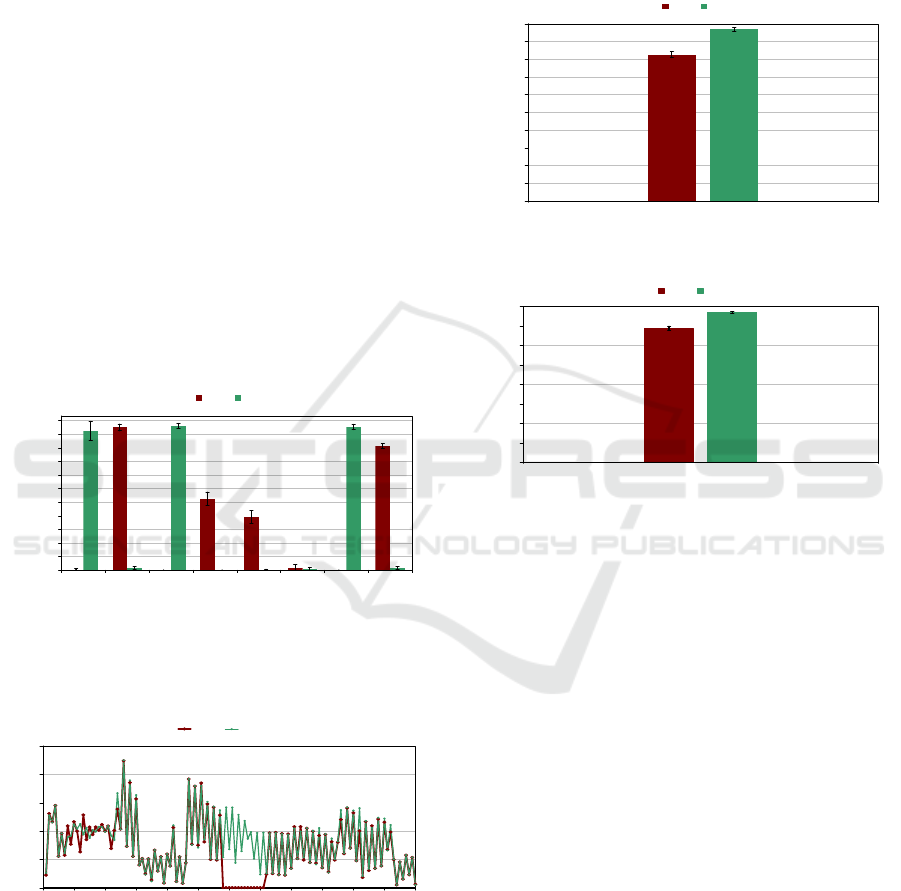
4.2 Results
Results are shown in Figure 4. Energy expenditure
works as a clear indicator of which nodes belong to
the routes used for data transmission. As can be
seen, the standard OLSR protocol causes higher
energy consumption on node 5, which is the node
with the highest strategic value in the scenario.
22
3
4
2
5
4
33
4
30
35
40
45
50
55
60
65
70
75
80
0123456789
Node
Energy Consumption (%)
0
1
2
3
4
5
6
Strategic Value
SV OLSR-RFC 3626 ER-OLSR S-OLSR
Figure 4: Comparison of energy consumption pattern and
the strategic value of the nodes.
This high strategic value entails that a greater
number of nodes are affected by the overhearing
effect, specifically, nodes 2, 3, 6, 8 and 9, which are
located inside the interference area of node 5. This
behavior is due to the use of the number of hops as
the single metric for the routing computation.
Consequently, the probability of selecting nodes
with a greater number of links is higher. Regarding
ER-OLSR, results show a reduction of the energy
expenditure on each node. However, the pattern of
consumption is similar to the original protocol. Such
behavior is mainly due to the lack of analysis about
the distribution of the nodes in the scenario. In
WINSYS 2016 - International Conference on Wireless Networks and Mobile Systems
132
regard to S-OLSR, the routing computation analyzes
the residual energy and, additionally, the number of
nodes inside the interference area by means of the
SV metric. Consequently, this mechanism assigns
priority to routes with less overhearing effect.
Therefore, results describe a significant
modification in the pattern of energy consumption.
Specifically, Figure 4 shows an increase in the
energy expenditure on the nodes 2 and 4 (with less
strategic value), compared with the competitors,
nodes 3 and 5. Regarding node 5, the difference
achieved is not remarkable due to the critical
location of this node in the scenario, i.e. it is inside
the interference area of all potential routes toward
the destination node. Nevertheless, the priority in the
selection of nodes with less strategic value has lead
to a significant decrease of the energy consumption
in nodes 3, 6, 7 and 9. Furthermore, Figure 5 shows
an analysis of the distribution of the energy
consumption on the scenario. As can be seen, S-
OLSR reduces the energy expenditure for all zones
defined on the scenario (Figure 3). In particular,
zone 2, which is characterized by the highest density
of nodes, presents the most significant difference,
53% (S-OLSR) compared with 59% (ER-OLSR)
and 64% (standard OLSR). The advantage achieved
is observed even globally, (including src and dst
nodes). In this case, results are 54% (S-OLSR), 58%
(ER-OLSR) y 62% (standard OLSR).
0
10
20
30
40
50
60
70
80
Zone1 Zone2 Zone3 Network
Energy Consumption (%)
OLSR-RFC 3626 ER-OLSR S-OLSR
Figure 5: Comparison of average energy consumption for
defined zones and for the whole network.
5 TESTBED EVALUATION
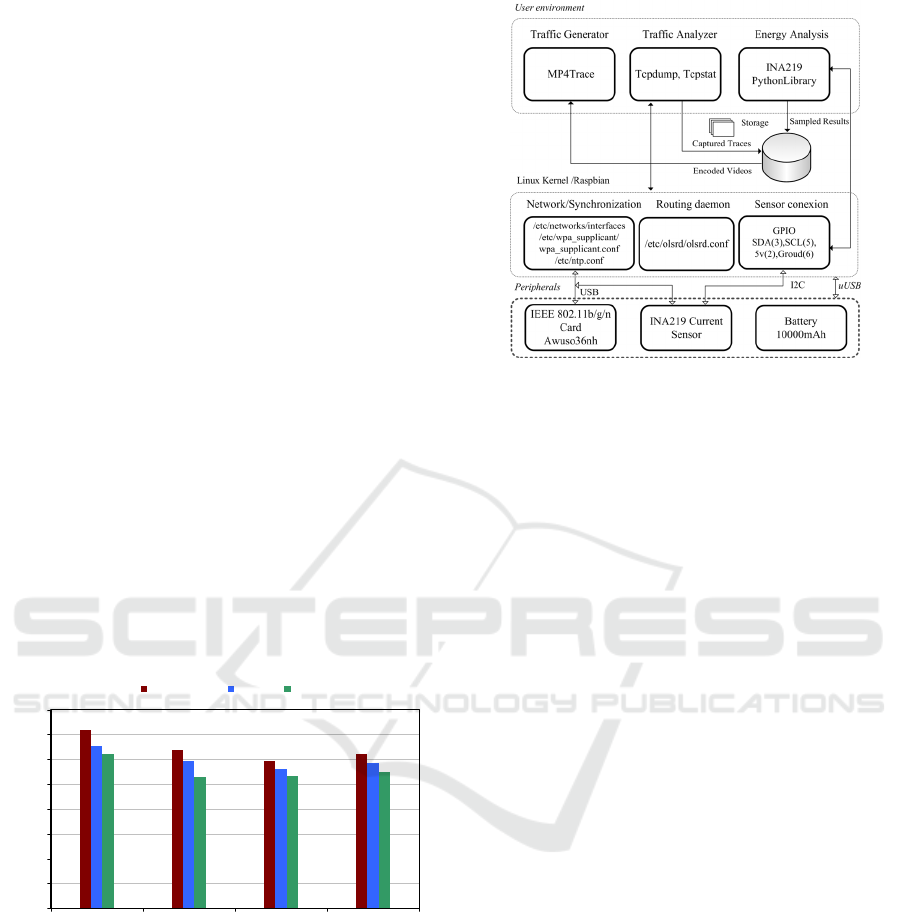
5.1 Ad Hoc Node Implementation
For the testbed evaluation, we implemented a set of
10 ad hoc nodes over embedded devices with Linux
(Raspberry Pi B+) (Ada 2015). The functional
diagram of a node is presented in Figure 6.
Figure 6: Functional diagram of an ad hoc node
implemented over a Raspberry Pi B+.
Ad hoc network configuration is performed in
the block Network/Synchronization. Additionally,
we installed the OLSR protocol (olsrd daemon) as
well as a NTP client to synchronize the nodes during
startup. The selection of the wireless card was
carried out taking into account the prior
experimentation with several models. The main
constraints were the compatibility of drivers with the
development platform and the operation of the card
in a real ad hoc communication mode. Taking into
account the results of the tests, Awuso36nh card
(linux driver rt2800 /chipset RT3070) (AlfaNetwork
2015) was selected. Finally, the nodes are powered
using a power bank of 10000mAh. At user level
several free distribution tools have been installed,
such as the mp4trace tool for video transmission,
available in the Evalvid package, tcpdump
(Tcpdum.org 2016) and tcpstat for capture and
analysis of traffic. The transmitter node stores the set
of videos which will be used in the test.
Additionally, the current sensor INA219
(Adafruit 2015) has been incorporated in each node,
in order to assess the level of average power
consumption demanded by the wireless card. The
sensor is handled by a set of Python libraries
developed by Adafruit. The communication is
carried out is via the I2C bus (Inter - Integrated
Circuit) in the GPIO pins (General Purpose Input /
Output). Figure 7 shows the physical ad hoc node
implemented and the components. The main goal of
the testbed is to help configure the scenario from the
Figure 3 for the evaluation of S-OLSR.
Simulation and Testbed Evaluation for Optimizing Energy Consumption in Ad Hoc Networks based on OLSR Protocol
133

Figure 7: Description of Ad hoc node components.
5.2 S-OLSR Implementation
Beyond the simulations, S-OLSR was implemented
on real ad hoc nodes. Figure 8 shows the functional
diagram for the performed development.
Figure 8: Functional diagram for S-OLSR implementation.
As can be seen, the first step is to measure the
energy consumption (EC) demanded by the wireless
card. For this purpose, the current sensor is
controlled by a Python script, which captures current
samples from the wireless card during a time
interval and later processes the samples in order to
compute the percentage of energy consumption.
Finally, this energy value is stored and updated
at the same rate as the hello interval does (2s) within
the OLSR protocol. In regard to modifications on the
routing protocol, we used the routing daemon olsrd-
0.9.0.2 (Olsr.org 2016) as starting point. In order to
include new metrics (SV and EC), the reserved
fields in the header of the hello message was used so
that modifications to the original protocol have kept
to a minimum. As aforementioned, the value of
energy consumption is introduced from the
information provided by the current sensor. The SV
metric is deducted from the number of nodes at one
hop observed in the neighbor table and also included
inside the hello message. Therefore, this slight
modification of the hello message allows the
exchange of the new metrics without altering the
original fields and thus, maintaining backward
compatibility. Moreover, routing computation has
been modified in order to take into account these
new metrics. The routes, previously determined by
the SPF process (Short Path First), give now higher
priority to the nodes with less strategic value and
less energy consumption to be selected as next hop
and included in the routing tables. Also, it is worth
clarifying that the energy metric used was the energy
consumption, instead of the residual energy, due to
the fact that obtaining the samples of current from
the wireless card using the sensor was simpler than
inferring the remaining battery.
5.3 Results
Figure 9 presents the set up for the experiment in the
laboratory environment. The scenario depicted in
Figure 3 was implemented. In order to replicate node
connectivity, layer-2 filters in each node have been
configured, providing connectivity only among
nodes according the scheme in Figure 3. The main
parameters used for the testbed are described in
Table 3.
Figure 9: Testbed evaluation in the laboratory
environment.
Table 3: Testbed parameters.
Parameter Value
Mac Protocol 802.11g
Rate 54 Mbps
Rx Sensitivity -76 dBm
Anntena Gain 5dBi
Tx Power Level 0 dBm
Hello and TC Interval 2s ; 5s
Intensity Consumption
(mA)
Tx:409;
Rx:204;offline:100mA
Video Traffic 60s -10 repetitions
Video Bitrate (Average) 300kbps
Node Energy (mA) 4.17mAh
An initial energy capacity has been defined
(4.17mAh) for every node in the network, excluding
N5, which is the node with the highest strategic
value. Intentionally, the initial energy capacity of
WINSYS 2016 - International Conference on Wireless Networks and Mobile Systems
134
node 5 was set to 50% (2.08mAh) in order to
evaluate the case when node 5 consumes all the
remaining energy before the experiment ends.
Additionally, the Python script will disable the
wireless card (switch to offline state) when the
energy consumption increases to 90% of the
capacity, which equates to 10% of residual energy,
and emulates the power-saving state. The traffic
used corresponds to 1min of the “Big Buck Bunny”
video sequence. The evaluation consists in the
comparison of S-OLSR with the standard protocol.
First, an analysis about the routes selected by
each mechanism was performed. Figure 10 shows
results about the throughput in each node. As can be
seen, the OLSR protocol (standard) leads the traffic
through routes defined by node 3, either nodes 5 or
6, and finally node 9. On the other hand, S-OLSR
estimates the better route through nodes 2, 4 and 8.
This is the operation expected for the proposal,
due to the less strategic value of such nodes.
Therefore, in this case the traffic flow avoids
node 5 (N5) because it is the node with the highest
energy restriction in the configured scenario.
0
30
60
90
120
150
180
210
240
270
300
330
23456789
Intermediate Node
Average Throughput (Kbps)
OLSR S-OLSR
Figure 10: Throughput at each intermediate node.
Additionally, Figure 11 shows the throughput
measured on the receiver node (N1).
0
0,2
0,4
0,6
0,8
1
0 5 10 15 20 25 30 35 40 45 50 55 60
Time (s)
Th
roug
h
put
(Mb
ps
)
OLSR S-OLSR
Figure 11: Throughput at the receiver node (N1).
As can be observed, the behavior of the standard
protocol causes the interruption of the traffic (from
28s to 35s), due to the full depletion of energy in
node 5, while the new route is recovered through
node 6, as can be inferred from Figure 10. In regard
to S-OLSR, the traffic flow is continuous during the
whole experiment. As can be seen in Figure 12,
S-OLSR presents higher reception rate (97%)
compared with the standard OLSR (82%). In this
sense, Figure 13 shows higher average PSNR
(38dB) versus the original OLSR (34dB).
0
10
20
30
40
50
60
70
80
90
100
Average Received Packets (%)
OLSR S-OLSR
Figure 12: Comparison of average packet reception rate:
Standard OLSR and S-OLSR.
0
5
10
15
20
25
30
35
40
PSNR (dB)
OLSR S-OLSR
Figure 13: Comparison of average PSNR: Standard OLSR
and S-OLSR.
Finally, another experiment was carried out in
order to characterize the energy depletion profile on
node 5. In this case, in addition to the video traffic
from N0 toward N1, a background flow (400Kbps)
from N3 to N9 was configured. This background
traffic tries to emulate ongoing connections from
other nodes in the network that, while not being
routed through node 5, interfere severely on energy
consumption due to the overhearing effect. The
initial energy capacity for node 5 was set up to 80%.
Again, the critical threshold of residual energy is
set up to 10% in order to disable the wireless card
and emulate a power-saving state. Results are shown
in Figure 14. As can be observed, the energy
depletion is most remarkable with the standard
protocol. In particular, the critical energy level takes
place approximately at 43s. The change in the slope
next to the critical value is due to lower consumption
demanded by the wireless card when is disabled
(100mA, Table 3). On the other hand, S-OLSR
presents a slower decrease of the residual energy on
node 5. Thus, the time of operation is extended to 55
seconds, corresponding to an increase of 20% in the
interval defined for evaluation (60 seconds).
Simulation and Testbed Evaluation for Optimizing Energy Consumption in Ad Hoc Networks based on OLSR Protocol
135

Figure 14: Comparison of energy depletion on the node
with highest strategic value in the scenario (N5).
6 CONCLUSIONS
In this paper we performed a thorough analysis
regarding energy optimization in ad hoc networks
and propose a new routing approach based on the
OLSR protocol. Specifically, our proposal (S-
OLSR), in addition to the energy metric, includes
the analysis of node distribution in order to set up
routes characterized by a less level of congestion.
Also, this approach aims at decreasing the power
consumption on nodes with higher amount of
neighbors, since they are likely to be the most
strategic nodes to maintain the whole network
connectivity. The evaluation performed on the
simulation environment shows clear changes in the
pattern of energy expenditure using S-OLSR. The
most significant difference is achieved on the zone
with higher node density. Specifically, results show
a reduction in the energy consumption of 6% and
11% in comparison with the ER-OLSR mechanism
and the standard OLSR protocol, respectively.
Moreover, results from the real testbed show the
expected behavior of the proposal. The routes are set
up through nodes with less strategic value, which
contribute to extend the lifetime of the node with the
highest number of links (N5), even when the traffic
load is increased in the network.
ACKNOWLEDGEMENTS
This paper was performed with the support of the
National Secretary of Higher Education, Science,
Technology and Innovation–Ecuador Government
(scholarship 195-2012) and the Thematic Network:
RiegoNets (514RT0486)-CYTED.
REFERENCES
Ada, Lady, 2015. Introducing the Raspberry Pi2-Model B.
Adafruit, 2015. INA219CurrentSensor. Datasheet.
Adoni, K.A. and Joshi, R.D., 2012. Optimization of
Energy Consumption for OLSR Routing Protocol in
MANET. IJWMN, 4(1), pp.251–262.
AlfaNetwork, 2015. AWUS036NH 802.11n/b/g USB
Adapter Technical Specifications.
Bellavista, P. et al., 2013. Convergence of MANET and
WSN in IoT urban scenarios. IEEE Sensors Journal,
13(10), pp.3558–3567.
Clausen, T. and P. Jacquet, 2003. Optimized Link State
Routing Protocol (OLSR). RFC:3626.
Do, N.M., Hsu, C.H. and Venkatasubramanian, N., 2012.
HybCAST: Rich content dissemination in hybrid
cellular and 802.11 ad hoc networks. In SRDS,
pp.352–361.
Fatima Lakrami and Najib Elkamoun, 2012. Mobility and
QOS Management in OLSR Routing Protocol.
IJCNWMC, 2(4), pp.17–26.
FFmpeg.org, 2016. FFmpeg. Documentation. Available at:
https://www.ffmpeg.org/ffmpeg.html.
Giordano, M.C. and S., 2014. Mobile ad hoc networking:
milestones, challenges, and new research directions.
IEEE Communications Magazine, 52(1), pp.85–96.
Intel7260 802.11a/b/g/n, 2013. Technical Specifications.
Klaue, J., Rathke, B. and Wolisz, A., 2003. EvalVid - A
Framework for Video Transmission and Quality
Evaluation. In TOOLS, pp.255–272.
Kunz, T., 2008. Energy-Efficient Variations of OLSR. In
IWCMC.
Machado, D.L.P., Carrano, R.C. and Saade, D.C.M., 2013.
Analysis of Energy Efficient OLSR Extensions and
OLSR- ETX Energetic Optimization Proposal. In PE-
WASUN.
Mahfoudh, S. and Minet, P., 2008. An Energy Efficient
Routing Based on OLSR in Wireless Ad Hoc and
Sensor Networks. In AINAW. pp.1253–1259.
Ns3-project, 2014. ns-3 Model Library. Available at:
https://www.nsnam.org/documentation/.
Olsr.org, 2016. Olsr project. Available at:
http://www.olsr.org/mediawiki/index.php/Releases.
De Rango, F. and Fotino, M., 2009. Energy efficient
OLSR performance evaluation under energy aware
metrics.In SPECTS, pp.193–198.
Rango, F. De, Fotino, M. and Marano, S., 2008. EE-
OLSR: Energy Efficient OLSR routing protocol for
Mobile ad-hoc Networks. MILCOM IEEE.
Tcpdum.org, 2016. TCPDUMP and LIBCAP. Available
at: http://www.tcpdump.org/.
Tehrani, M.N., Uysal, M. and Yanikomeroglu, H., 2014.
Device-to-Device Communication in 5G Cellular
Networks Challenges, Solutions, and Future
Directions . IEEE Communications Magazine, 52(5).
Toh, C.-K., 2001. Maximum battery life routing to support
ubiquitous mobile computing in wireless ad hoc
networks. IEEE Communications Magazine, 39(6).
Wardi et al., 2011. Residual energy-based OLSR in mobile
ad hoc networks. 2011, ICMT , pp.3214–3217.
WINSYS 2016 - International Conference on Wireless Networks and Mobile Systems
136
