
Wearable Monitoring for the Detection of Nocturnal Agitation in
Dementia
Ana Cristina Marc´en
1
, Jes´us Carro
1,2,3
and Violeta Monasterio
1
1
Universidad San Jorge, Campus Universitario, Autov A23 km 299, 50830, Villanueva de G´allego, Zaragoza, Spain
2
Aragon Institute for Engineering Research (I3A), University of Zaragoza, Zaragoza, Spain
3
CIBER in Bioengineering, Biomaterials and Nanomedicine (CIBER-BBN), Madrid, Spain
Keywords:
Wearable Computers, Pervasive Health, Support Vector Machines, Nocturnal Agitation, Accelerometry.
Abstract:
Nocturnal agitation is one of the symptoms exhibited by dementia patients. Diagnosing and monitoring the
evolution of agitation is difficult because patient monitoring requires a doctor, nurse or caregiver observing
patients for extended periods of time. In this work, we propose to use an automatic monitoring system based
on wearable technology that complements the caregiver’s work. The proposed system uses a wrist wearable
device to record agitation data, which are subsequently classified through machine learning techniques as
quantifiable indexes of nocturnal agitation. Preliminary tests performed with volunteers showed that the clas-
sification of recorded movements between nocturnal agitation or quiet periods was successful in 78.86% of the
cases. This proof of concept demonstrates the feasibility of using wearable technology to monitor nocturnal
agitation.
1 INTRODUCTION
According to recent studies, 35.6 million people lived
with dementia worldwide in 2010, and estimations
predict that these numbers will almost be doubled
every 20 years, 65.7 million living with dementia in
2030 and 115.4 million living with dementia in 2050
(Prince et al., 2013). Approximately one-quarter of
adults with Alzheimer’s disease (AD) and with other
dementias suffer from sleep disturbances (Rose et al.,
2010).
Patients with dementia usually present sleep dis-
turbances such as insomnia, sleep disruption, or
movements that can escalate to become agitation. The
treatment of these disturbances is complex because
they involve multiple factors, such as neurodegen-
erative changes in the brain, the patient’s environ-
ment, medical or psychiatric morbidity, and medi-
cations used to treat chronic illnesses and dementia-
related behavioral symptoms (Deschenes and Mc-
Curry, 2009).
In particular, changes in nocturnal agitation be-
haviors may provide information about the evolution
of dementia. However, it is difficult to get objective
and quantifiable information about the nocturnal be-
havior of dementia patients because they are not usu-
ally aware of their behavior and their caregivers can-
not monitor them 24 hours a day (Cooke and Ancoli-
Israel, 2006).
Nocturnal agitation is generally assessed using ob-
servational scales, such as the Cohen-Mansfield Ag-
itation Inventory (CMAI) (Cohen-mansfield et al.,
1989), which is particularly difficult to apply in out-
of-hospital settings. This work presents the first
steps towards a pervasive health tool for automati-
cally monitoring nocturnal agitation. In order to de-
tect the nocturnal activity, we propose a system based
on wearable wristband computers similar to watches
because most patients feel comfortable using them.
Then, the collected data is analyzed using machine
learning techniques. In particular, Support Vector
Machines (SVMs), which are widely used for min-
ing physiological data in medical applications (Ba-
naee et al., 2013), are used to identify nocturnal ab-
normal behaviors by classifying movements as nor-
mal or agitated. The aim of this work is to provide an
objective and quantifiable characterization of noctur-
nal movements to help medical staff in their diagno-
sis.
The remainder of this article is organized as fol-
lows. Section 2 summarizes related work. Section
3 describes the development of the proposed system:
selection of the wearable device, creation of the refer-
ence dataset, and classification algorithm. Finally, in
Marcén, A., Carro, J. and Monasterio, V.
Wearable Monitoring for the Detection of Nocturnal Agitation in Dementia.
DOI: 10.5220/0005938500630069
In Proceedings of the 6th International Joint Conference on Pervasive and Embedded Computing and Communication Systems (PECCS 2016), pages 63-69
ISBN: 978-989-758-195-3
Copyright
c
2016 by SCITEPRESS – Science and Technology Publications, Lda. All rights reserved
63

Section 4 and Section 5, we present and discuss the
results respectively.
2 RELATED WORK
Our approach is based on two main aspects: the
use of wearable technology to characterize movement
through collected accelerometer data, and the use of
machine learning techniques to detect nocturnal agi-
tation as a complementary diagnostic tool.
Several works focus on studying the feasibility of
replacing traditional monitoring and diagnostic sys-
tems by less intrusive and more reliable ones in the
case of dementia patients. In (Ancoli-Israel et al.,
1997) and (Van Someren, 1997), actigraphy is a
medium to collect objective sleep data. However, nei-
ther one focuses on nocturnal agitation which is a spe-
cific symptom of dementia sleep activity (Sink et al.,
2005).
Other works focus on detecting nocturnal agita-
tion of patients with dementia, but they tend to present
complex multi-sensor systems. In (Sakr et al., 2010),
the agitation is detected using a heart rate sensor, a
galvanic skin response sensor and a skin temperature
sensor. In (Fook et al., 2007), the authors propose
a video camera for detecting agitated behavior. In
(Biswas et al., 2006), the system used to detect agi-
tation is composed by acoustic sensors, pressure sen-
sors and ultrasound sensors.
In contrast to previous studies, in this work we
propose a simple system using only accelerometer to
quantify nocturnal agitation in dementia. Accelerom-
eter measures have been found to correlate well with
the CMAI scale (Nagels et al., 2006), so our hypoth-
esis is that accelerometry can be a simple and low-
cost solution for detecting agitation in patients with
dementia.
3 METHODS
To assess the viability of using wearable accelerome-
ter device for nocturnal agitation monitoring, we de-
signed a three-phase proof of concept. During the first
phase we studied the wearable accelerometer devices
available in market and their features taking into ac-
count the needs of our research. The second phase
consisted on the creation of the reference dataset,
which involved the definition of the experimental pro-
tocols, the recruitment of participants, and the record-
ing of data. Finally, the third phase consisted on the
selection and application of a classification algorithm
in order to extract useful information about nocturnal
agitation.
3.1 Technological Survey
Nowadays, there is a great diversity of wearable de-
vices in the market, and they will continue to grow
(Intelligence, 2015). Their functionality opens a wide
range of possibilities; phone calls, activity monitor-
ing and geolocation are some of the most common
features of these devices. Unfortunately, most com-
mercial devices do not allow access to raw data. Pop-
ular devices such as Jawbone, Misfit, Fitbit or Garmin
trackers use proprietary algorithms to translate the
raw data into generic activity statistics, and their ac-
curacy against gold standard methods remains under-
studied (Kolla et al., 2016). Even if they were accu-
rate enough, generic activity measures such as num-
ber of steps or hours of sleep may not necessarily be
the best surrogate for nocturnal agitation.
Thus, in order to find the most appropriate wear-
able device for our research we considered only those
devices that allowed access to raw data. In addition
to that, we considered additional features. Since the
agitation is characterized for a restlessness state and
movements with different intensity degree, a 3-axis
accelerometer was considered to be the most appro-
priate sensor to measure the periods and the intensity
of the movements.
Another feature required in the device is a sam-
pling rate greater or equal than 20 Hz, since the fastest
body movements, such as spasms and tremor, are in
the order of 10 Hz (Bendersky et al., 2014). Other de-
sirable characteristics are offline data storage capabil-
ities, exportable data in standard format, and low cost.
The memory has to be able to store the activity of a
complete night, so the device logging period needs to
be at least 8 hours at 20 Hz. The possibility of export-
ing data in a standard format is an advantage because
it can be used easily as input data for statistical tools,
signal processing tools or simulation tools. Finally,
in 2010, the total estimated worldwide costs of de-
mentia were US$604 billion (Wimo et al., 2013), so
cost-effective monitoring systems would help reduce
that cost.
Taking into account all of those requirements,
we selected Original GENEActiv by Activeinsights
whose sampling frequency range is 10-100Hz, its
maximum logging period is 22 days @ 20Hz, its
exporting formats are BIN (Binary file) and CSV
(Comma-separated values), and its cost includes GE-
NEActiv software.
PEC 2016 - International Conference on Pervasive and Embedded Computing
64
3.2 Creation of the Reference Dataset
In order to develop and validate the classification al-
gorithm, a reference dataset was created by record-
ing controlled movements imitating nocturnal agita-
tion and quiet periods in a realistic way.
3.2.1 Protocols
In order to understand the real behavior of dementia
patients, we had the cooperation of a medical advi-
sor, the responsible of the Geriatrics Department of
the Hospital San Juan de Dios, Zaragoza, Spain. She
described for us the usual movements of dementia pa-
tients when the night is quiet, agitated or with insom-
nia.
Taking into account these descriptions, we defined
the movements to be performed by our test subjects
(see Tables 1 and 2). The result was reviewed and
approved by the medical advisor, who confirmed that
the movements closely resembled the nocturnal agita-
tion movements found in dementia patients. Two pro-
tocols were defined for subjects to follow during the
tests. The first protocol contained movements of the
extremities, and the second protocol contained move-
ments with the whole body.
Table 1: Protocol P1. Movements of the extremities and
their duration.
Duration Movement
15 s. Remain laying down
10 s. Move right arm from bottom to top
15 s. Remain laying down
10 s. Move left arm from bottom to top
15 s. Remain laying down
10 s. Try to sit up
15 s. Remain laying down
10 s. Move right leg from bottom to top
15 s. Remain laying down
10 s. Move left leg from bottom to top
15 s. Remain laying down
15 s. Stand up and walk
5 s. Move the wearable device on your
wrist
Table 2: Protocol P2. Movements of the whole body and
their duration.
Duration Movement
15 s. Remain laying down
10 s. Sit up on the bed
15 s. Remain laying down
10 s. Laying put in bed
15 s. Remain laying down
10 s. Try to sit up
15 s. Remain laying down
10 s. Stand up
15 s. Remain laying down
10 s. Walk
3.2.2 Recruitment of Volunteers and Data
Recording
Eleven healthy volunteers participated in the experi-
ments, 4 females (mean age 35.5 years, SD 5.17) and
7 males (mean age 30.6 years, SD 9.29). All volun-
teers signed informed consent.
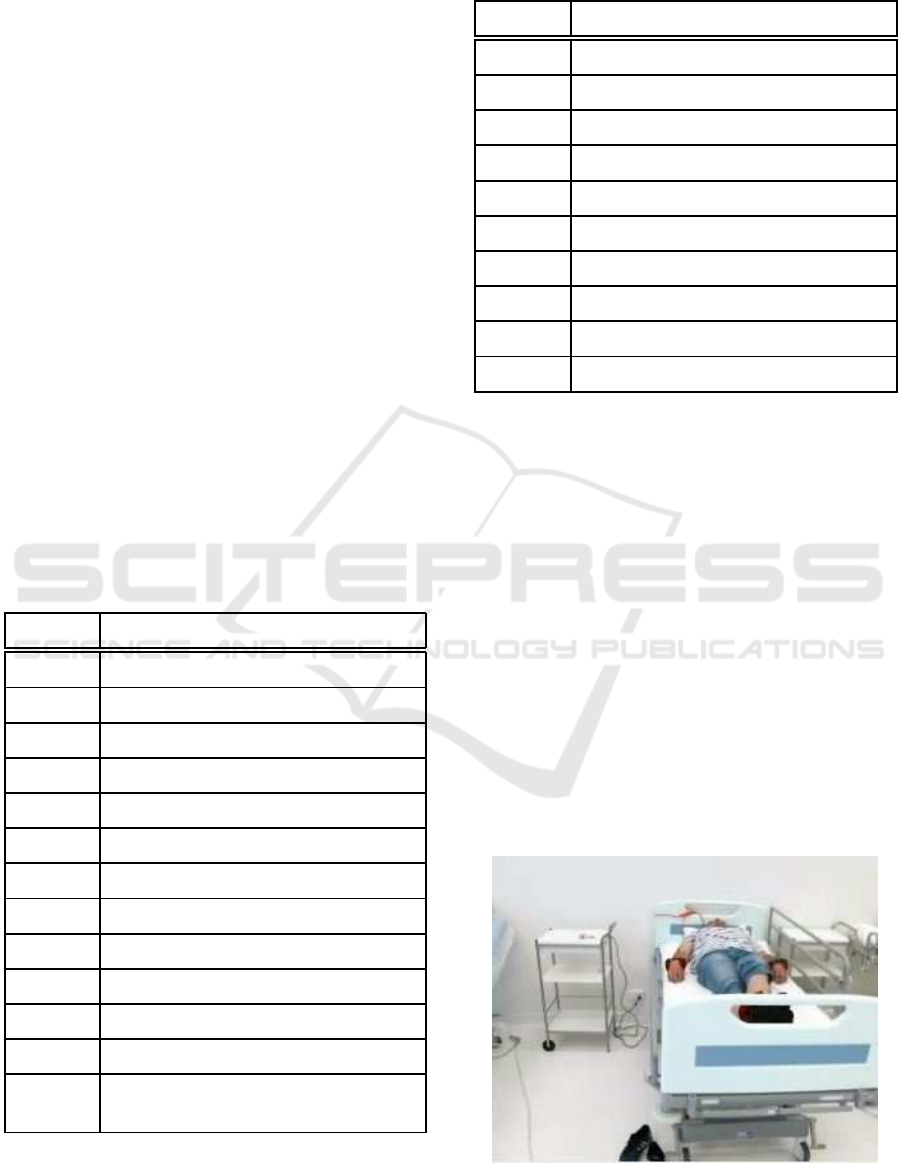
Tests were conducted in a sleep lab that is spe-
cially equipped for medical and nursing students (Fig-
ure 1). Therefore, volunteers posed as patients in the
hospital beds available in this room. Most patients
with dementia are elderly, whose movements are lim-
ited not only by the illness, but also by age. For this
reason, participants wore 1.5 kg weights on their an-
kles and wrists to limit their movements, in order to
simulate a real scenario as far as possible. Figure 1
shows a volunteer on the hospital bed waiting to start
the tests.
Figure 1: Volunteer with weights in his extremities on a
hospital bed.
Wearable Monitoring for the Detection of Nocturnal Agitation in Dementia
65

Figure 2: Segment of accelerometry traces recorded during
protocol P1. Vertical lines indicate the division between
movements and quiet periods.
Participants performed the movements in proto-
cols P1 and P2. Accelerometry data was recorded
by the wearable accelerometer device. Both proto-
cols could be correctly executed, recorded and stored
in 8 out of the 11 cases. Figure 2 shows a segment of
recorded data.
3.2.3 Signal Processing
To classify the movements of the recorded dataset
into agitated periods and normal/quiet periods, we
used Support Vector Machines (SVMs) following the
guidelines provided in (Hsu et al., 2008). The first
step was to define the features to be fed to the SVM
classifier. These features have to be representative
of the quiet and agitation periods based on available
measurements (Guyon et al., 2006). Classical signal
processing techniques were applied to compute the
features as follows.
Acceleration on x, y and z axes was recorded at
a sampling frequency of 100 Hz. Recordings were
processed in segments from 5 to 15 s., depending on
the duration of the movement as specified in the pro-
tocol. In order to eliminate the effect of gravity, the
mean acceleration on each axis was subtracted from
its corresponding trace. Then, traces were low-pass
filtered with a cut-off frequency of 10 Hz. The result-
ing traces, denoted as a
x
, a
y
, a
z
, where used to com-
pute the classification features as follows. For axis
i = x, y, z the following features were computed:
• Peak acceleration
A
i
= max(a
i
) (1)
• Energy
E
i
=
N
∑
n=1
|a
i
(n)|
2
(2)
where n indicates the sample within the trace.
• Peak amplitude of the frequency spectrum
S
i
= max(FFT(a
i
)) (3)
where FFT stands for Fast Fourier Transform.
• Peak frequency, F
i
, computed as the frequency
corresponding to S
i
.
• Relative peak amplitude, R
i
, computed as the dif-
ference between S
i
and the mean amplitude of the
spectrum between 9 and 10 Hz.
Furthermore, the modulus of the acceleration vec-
tor was computed as m=
q
a
2
x
+ a
2
y
+ a
2
z
, and the same
features as in S
i
, F
i
and R
i
were computed from m,
thus obtaining features S
m
, F
m
and R
m
.
As a result, we obtained a set of 18 features that
contained information about the amplitude and tem-
poral variations of the wrist acceleration.
3.2.4 Feature Selection
In order to perform a selection of the most relevant
features for agitation detection, the 18 extracted fea-
tures were divided in 3 sets:
• Temporal Axis Features (TAF): A
i
and E
i
where
i = x, y, z.
• Frequency Axis Features (FAF): S
i
, F
i
and R
i
where i = x, y, z.
• Frequency Modulus Features (FMF): S
m
, F
m
and
R
m
.
The possible combinations (see Table 3) of these
sets were evaluated using cross-validation in order to
find which ones contain relevant, irrelevant or redun-
dant information for agitation detection.
Table 3: Sets of features resulting of the extracted features
combination. The combination depends on the processing
signal: temporal or frequency axis, and, single axis signal
or modulus signal.
Feature Set Combinations
B
1
TAF
B
2
FAF
B
3
FMF
B
4
TAF & FAF
B
5
TAF & FMF
B
6
FAF & FMF
B
7
TAF & FAF &FMF
PEC 2016 - International Conference on Pervasive and Embedded Computing
66

3.2.5 Classification of Movements
Following the guidelines in (Burges, 1998; Hsu et al.,
2008), movements were classified following the next
steps: division of the data in training and testing
subsets, transformation of movement data into SVM
package format, scaling data, selection of a kernel
function, search of the optimum parameters using
cross-validation, and training and testing the data.
The reference dataset was divided in two subsets,
one for training and one for testing. Knowing that
the imbalanced datasets where the number of nega-
tive instances far outnumbers the positive instances
declines the performance of SVM significantly (Wu
and Chang, 2003), the division was made at 50%, that
is, the recordings of four volunteers (50%) were used
for training and the rest were used for testing. On
each subset, the number of agitated movements (pos-
itive instances) was similar to the number of normal
movements/quiet periods (negative instances) (Table
4).
Table 4: Number of agitated and normal/quiet movements
that compose the dataset of protocol P1 and protocol P2.
Protocol P1 Protocol P2
Training
Agitation 48 37
Normal 50 24
Testing
Agitation 48 40
Normal 50 32
For each instance, a instance-label pair is defined
as (x
i
, y
i
) i = 1, ..., n where x
i
∈ R
n
is the instance with
feature values for a movement, and y
i
∈ {+1, −1} is a
label that determines the class of x
i
, negative or posi-
tive instance. Given the instance-label pairs for a sub-
set, the Support Vector Machine (SVM) (Cortes and
Vapnik, 1995) can be expressed as the following opti-
mization problem:
min
w,b,ξ
1
2
w
T
w+ C
n
∑
i=1
ξ
i
, (4)
subject to y
i
(w
T
φ(x
i
) + b) ≥ 1− ξ
i
, (5)
ξ
i
≥ 0, (6)
where w and b define the separating hyper plane,
ξ
i
are ’slack’ variables which allow for misclassified
vectors and φ is a function that maps the training vec-
tors x
i
into a higher dimensional space.
Scaling avoids that greater numeric ranges take
precedence over smaller ones. At the same time,
numerical difficulties during the calculation are de-
creased (Sarle et al., 1997). For these reasons, in-
stances were scaled to [-1,1]. On the other hand, a
kernel function K(x
i
, x
j
) = φ(x
i
)·φ(x
j
) can be used to
avoid the explicit definition of a mapping function φ.
The Radial Basis Function (RBF) is the kernel used
in this work, defined as:
K(x
i
, x
j
) = exp(−γ||x
i
− x
j
||
2
), γ > 0. (7)
A RBF kernel improves classification results over
a linear kernel in most cases (Chang and Lin, 2011),
but it’s necessary to select suitable values for γ and
C parameters. In order to find the optimum values, a
grid-search was carried out by creating a grid space of
(C, γ) pairs with log
2
C ∈ −5, −4, ..., 15 and log
2
γ ∈
−15, −14, ..., 3. For each pair (C, γ) in the space, we
performed a five-fold cross validation (CV) on each
training subset B
i
. The pair (C, γ) for each set B
i
is
chosen taking into account the maximum mean CV
accuracy.
Each selected pair (C
i
, γ
i
) together with the train-
ing subset B
i
, where i = 1, .., 7, are used to create a
SVM classifier. Then, testing subsets B
i
were classi-
fied using the corresponding classifier i.
4 RESULTS
The optimum RBF parameters found during the grid
search are presented in Table 5. Taking into account
the results of Table 5, the feature set B
2
is the most
relevant when all movements are evaluated together.
The classification results were evaluated by com-
paring the accuracy (Acc), which is the percentage
of instances correctly classified, the sensitivity (Se),
which is the percentage of positive instances correctly
classified, and the specificity (Sp), which is the per-
centage of negative instances correctly classified. Ta-
ble 6 presents the classification results in testing sets.
The maximum accuracy for movements in proto-
col P1 is 69.90% for feature set B
2
. In contrast, the
feature sets B
1
, B
6
and B
7
returned the best accuracy,
94.44% for movements in protocol P2. And the union
of both protocols returns 78.86% of accuracy in fea-
ture sets B
2
and B
6
.
5 DISCUSSION AND
CONCLUSIONS
In this study, we analyzed nocturnal agitation using
a wearable device and machine learning techniques.
Results showed that nocturnal agitation movements
Wearable Monitoring for the Detection of Nocturnal Agitation in Dementia
67

Table 5: Optimization parameters for RBF-SVM obtained with the whole training set (protocols P1 and P2). The accuracy
(%) resulting from cross-validation is reported as mean ± standard deviation.
Feature Set Accuracy (%) log
2
C log
2
γ
B
1
78.67 ± 7.98 4 -2
B
2
79.23 ± 7.88 12 3
B
3
74.84 ± 4.43 2 -5
B
4
74.84 ± 6.26 12 3
B
5
78.45 ± 8.11 4 1
B
6
77.42 ± 10.07 14 4
B
7
76.09 ± 5.73 15 5
Table 6: RBF-SVM classification results for the testing set. For each B
i
, C and γ were set as in Table 5 for the SVM. Se:
Sensitivity, Sp: Specificity, Acc: Accuracy.
Feature Set
P1 P2 P1&P2
Se (%) Sp (%) Acc (%) Se (%) Sp (%) Acc (%) Se (%) Sp (%) Acc (%)
B
1
45.83 67.27 57.28 100.0 87.50 94.44 70.45 77.01 73.71
B
2
52.08 85.45 69.90 90.00 78.13 84.72 62.50 95.00 78.86
B
3
68.58 34.55 48.54 100.0 28.13 68.06 82.95 40.23 61.71
B
4
35.42 90.91 65.05 97.50 59.38 80.56 54.55 93.10 73.71
B
5
27.08 81.82 56.31 82.50 90.63 86.11 59.09 87.36 73.14
B
6
50.00 81.82 66.99 95.00 93.75 94.44 69.32 88.51 78.86
B
7
58.33 77.55 66.99 97.56 90.63 94.44 56.82 90.80 73.71
can be successfully detected with an accuracy of
78.86%. Classification results were better for proto-
col P2 than for protocol P1 or for the whole dataset.
Protocol P1 involves some movements that are diffi-
cult to detect using the wearable device on a wrist,
such as move the legs, or movements that can be eas-
ily confused with agitation although they are normal,
such as move the clock. On the other hand, proto-
col P2 contains more energetic movements, which are
easier to classify. The applicability of these results to
real settings will depend on the realism of the sim-
ulated movements. The protocols described here in-
cluded clearly defined movements, with obvious dif-
ferences between agitation and normal/quiet periods.
An evolution of the system should be trained with
more realistic protocols, which could include move-
ments such as roll over the bed or cover with bed
sheets. These movements are more complex than re-
main laying down and they introduce a greater con-
fusing factor, but at the same time they may better
reflect actual nocturnal behavior.
Although preliminary results are promising, sev-
eral limitations of the work need to be acknowledged.
First, the use of different kernel functions could be ex-
plored, in order to find a classifier with better results,
or to confirm that the radial basis function is the best
for this particular classification problem. Also, by
comparing the results of table 6, the relevance of fre-
quency features over temporal features is clear, since
the best results for the whole dataset correspond to
B2 and B6 feature sets. These feature sets only con-
tain frequency features, and the main difference be-
tween both is the modulus features. B6 contains all
the features of B2 more the frequency features of the
modulus signal. While the B2 feature set increases
the accuracy of protocol P1 up to 69.90%, the accu-
racy of protocol P2 is increased by the B6 feature set
up to 94.44%. Thus, modulus features include rel-
evant information to classify movements in protocol
P2, but some of the modulus features may include
redundant information for the classification of move-
ments in protocol P1. The inclusion of more sophis-
PEC 2016 - International Conference on Pervasive and Embedded Computing
68

ticated feature selection methods may result in a net
improvement of the solution.
The presented proof of concept was designed in
coordination with medical staff in order to study the
feasibility to improving dementia diagnostics by us-
ing wearable devices. Since the preliminary results
demonstrated that it is possible to detect agitation us-
ing a wearable accelerometer, the next step towards
clinical translation of our research will be to perform
a pilot study with hospitalized patients, after includ-
ing the above mentioned classification improvements.
ACKNOWLEDGEMENTS
The authors would like to thank the cooperation of Dr.
Mercedes Gim´enez, Responsible for the Geriatrics
Department of Hospital San Juan de Dios (Zaragoza,
Spain). This work is supported by project AEI-
010500-2015-200(MINETUR, Spain) and by Grupos
BSICoS (T96) and SVIT (T92) from DGA (Arag´on)
and European Social Fund (EU). Partially supported
by the Aragonian Government and the European So-
cial Fund ”Building Europe from Aragon”. This work
has been supported by research fellowship from the
Universidad San Jorge.
REFERENCES
Ancoli-Israel, S., Clopton, P., Klauber, M. R., Fell, R., and
Mason, W. (1997). Use of wrist activity for moni-
toring sleep/wake in demented nursing-home patients.
Sleep, 20(1):24–27.
Banaee, H., Ahmed, M. U., and Loutfi, A. (2013). Data
mining for wearable sensors in health monitoring sys-
tems: a review of recent trends and challenges. Sen-
sors, 13(12):17472–17500.
Bendersky, D., Ajler, P., and Yampolsky, C. (2014). The
use of neuromodulation for the treatment of tremor.
Surgical Neurology International, 5(6):232.
Biswas, J., Jayachandran, M., Thang, P. V., Fook, V. F. S.,
Choo, T. S., Qiang, Q., Takahashi, S., Jianzhong,
E. H., Feng, C. J., and Kiat, P. (2006). Agitation moni-
toring of persons with dementia based on acoustic sen-
sors, pressure sensors and ultrasound sensors: a feasi-
bility study. In International Conference on Ageing,
Disability, and Independence, pages 3–15.
Burges, C. J. C. (1998). A tutorial on support vector
machines for pattern recognition. Data Mining and
Knowledge Discovery, 2(2):121–167.
Chang, C.-C. and Lin, C.-J. (2011). Libsvm: A library for
support vector machines. ACM Transactions on Intel-
ligent Systems and Technology (TIST), 2(3):27.
Cohen-mansfield, J., Marx, M. S., and Rosenthal, A. S.
(1989). A description of agitation in a nursing home.
Journal of Gerontology, 44(3):M77–M84.
Cooke, J. R. and Ancoli-Israel, S. (2006). Sleep and its
disorders in older adults. Psychiatric Clinics of North
America, 29(4):1077–1093.
Cortes, C. and Vapnik, V. (1995). Support-vector networks.
Machine Learning, 20(3):273–297.
Deschenes, C. L. and McCurry, S. M. (2009). Current treat-
ments for sleep disturbances in individuals with de-
mentia. Current Psychiatry Reports, 11(1):20–26.
Fook, V. F. S., Thang, P. V., Htwe, T. M., Qiang, Q., Wai,
A. A. P., Jayachandran, M., Biswas, J., and Yap, P.
(2007). Automated recognition of complex agitation
behavior of dementia patients using video camera. In
2007 9th International Conference on e-Health Net-
working, Application and Services, pages 68–73.
Guyon, I., Gunn, S., Nikravesh, M., and Zadeh, L. A.
(2006). Feature Extraction, Foundations and Appli-
cations. Springer, Berlin, 1st edition.
Hsu, C.-W., Chang, C.-C., and Lin, C.-J. (2008). A practi-
cal guide to support vector classification. BJU inter-
national, 101(1):1396–400.
Intelligence, B. I. (2015). The wearables report: Growth
trends, consumer attitudes, and why smartwatches
will dominate. Website. http://goo.gl/ZF3ZiN.
Kolla, B. P., Mansukhani, S., and Mansukhani, M. P. (2016).
Consumer sleep tracking devices: a review of mecha-
nisms, validity and utility. Expert Review of Medical
Devices, 12:497–506.
Nagels, G., Engelborghs, S., Vloeberghs, E., Van Dam, D.,
Pickut, B. A., and De Deyn, P. P. (2006). Actigraphic
measurement of agitated behaviour in dementia. Inter-
national Journal of Geriatric Psychiatry, 21(4):388–
393.
Prince, M., Bryce, R., Albanese, E., Wimo, A., Ribeiro,
W., and Ferri, C. P. (2013). The global prevalence
of dementia: A systematic review and metaanalysis.
Alzheimer’s & Dementia, 9(1):63–75.e2.
Rose, K. M., Fagin, C. M., and Lorenz, R. (2010). Sleep
disturbances in dementia: What they are and what to
do. Journal of gerontological nursing, 36(5):9–14.
Sakr, G., Elhajj, I., and Huijer, H.-S. (2010). Support vec-
tor machines to define and detect agitation transition.
IEEE Transactions on Affective Computing, 1(2):98–
108.
Sarle, W. S. et al. (1997). Neural network faq. Periodic post-
ing to the Usenet newsgroup comp. ai. neural-nets.
Sink, K. M., Holden, K. F., and Yaffe, K. (2005). Pharma-
cological treatment of neuropsychiatric symptoms of
dementia: a review of the evidence. JAMA : The Jour-
nal of the American Medical Association, 293(5):596–
608.
Van Someren, E. (1997). Actigraphic monitoring of move-
ment and rest-activity rhythms in aging, alzheimer’s
disease, and parkinson’s disease. IEEE Transactions
on Rehabilitation Engineering, 5(4):394–398.
Wimo, A., Jnsson, L., Bond, J., Prince, M., and Winblad, B.
(2013). The worldwide economic impact of dementia
2010. Alzheimer’s & Dementia, 9(1):1–11.e3.
Wu, G. and Chang, E. Y. (2003). Class-boundary alignment
for imbalanced dataset learning. In ICML 2003 work-
shop on learning from imbalanced data sets II, pages
49–56.
Wearable Monitoring for the Detection of Nocturnal Agitation in Dementia
69
