
Automated Waterline Extraction for Optimal Land Use
A Case Study in Crete
Lemonia Ragia
1
,
Vassilis Paravolidakis
2
,
Konstantia Moirogiorgou
2
and
Michalis Zervakis
2
1
School of Environmental Engineering, Technical University of Crete, Chania, Greece
2
School of Electronic and Computer Engineering, Technical University of Crete, Chania, Greece
Keywords: Image Processing, Waterline Extraction, Web Application, Land Use.
Abstract: Coastal areas in Greece play an important role to the economic growth of the country. Especially in the islands
as a major tourist destination, new tourist infrastructure is continuously being built. To optimize land use and
protect current infrastructure, we need to properly define the waterline. In addition, the waterline is changing
dynamically due to climate change and weather conditions, so it has to be monitored. The proposed framework
is focused on the automatic extraction of waterline from aerial images using advanced image processing
techniques. We plan to integrate the Greek cadastral data in the framework and along with spatial data analysis
to be able to proceed with both coastal and cadastral data. Additional functionalities are provided to the
planners, through metrics for distance and surface area calculations, in order to extract useful information for
sustainable region planning of the coastal area. The results can be visualized in the images with the metrics
of interest.
1 INTRODUCTION
Coastal zones are among the most productive areas in
the world, offering a wide variety of valuable habitats
and ecosystems that have always attracted humans
and human activities. Currently, more than 200
million European citizens live near coastlines,
stretching from the North-East Atlantic and the Baltic
to the Mediterranean and Black Sea.
As an example, the island of Crete produces about
one fifth of the GDP of Greece only in the summer
(Synolakis et al., 2008). The economy of the Chania
region in North Western Crete is predominately based
on tourist and agriculture and it is a very famous
tourist destination. This intensive concentration of
population and excessive exploitation of natural
resources puts enormous pressure on our coastal
ecosystems leading to biodiversity loss, habitat
destruction, pollution, as well as conflicts between
potential uses, and space congestion problems. The
rapid economic growth of the coastal areas has driven
the public and private sector to make investments in
infrastructure. The urbanization and development of
these areas has led to the construction of new roads,
small villages, entertainment facilities and
infrastructure for sport activities. The intense touristic
development has led to the environmental
downgrading of the areas near the waterline. The
coastal areas are quite fragile landscapes as they are
also among the most vulnerable to climate change and
natural hazards. Risks include flooding, erosion, sea
level rise, as well as extreme weather events. As
negative factors we have human interventions and
natural phenomena due to the climate change. Around
30% of the Greek coastline is affected by erosion
(Valavanidis and Vlachogianni, 2011). In Greece, the
way spatial planning confronts these phenomena is
inadequate.
In our approach the main value of the research is
to extract automatically the waterline and metric
measurements helping the development planners to
consider the risks for the coastal areas and to plan
further actions.
Waterline extraction is mainly obtained through
satellite images (Liu et al., 2013), (Zhao et al., 2008).
The identification of shoreline from historical and
aerial images using topographic data and digital
image-processing techniques has been addressed in
Boak and Turner, 2005. Aerial photogrammetry has
already been used to provide shoreline information
and shoreline dynamics (Dolan et. al., 1978).
In our approach we use aerial images from HMGS
Greece (HMGS, 2015) and Google Earth (Google
Earth, 2014) to extract automatically the waterline.
Ragia, L., Paravolidakis, V., Moirogiorgou, K. and Zervakis, M.
Automated Waterline Extraction for Optimal Land Use - A Case Study in Crete.
In Proceedings of the 2nd International Conference on Geographical Information Systems Theory, Applications and Management (GISTAM 2016), pages 99-104
ISBN: 978-989-758-188-5
Copyright
c
2016 by SCITEPRESS – Science and Technology Publications, Lda. All rights reserved
99
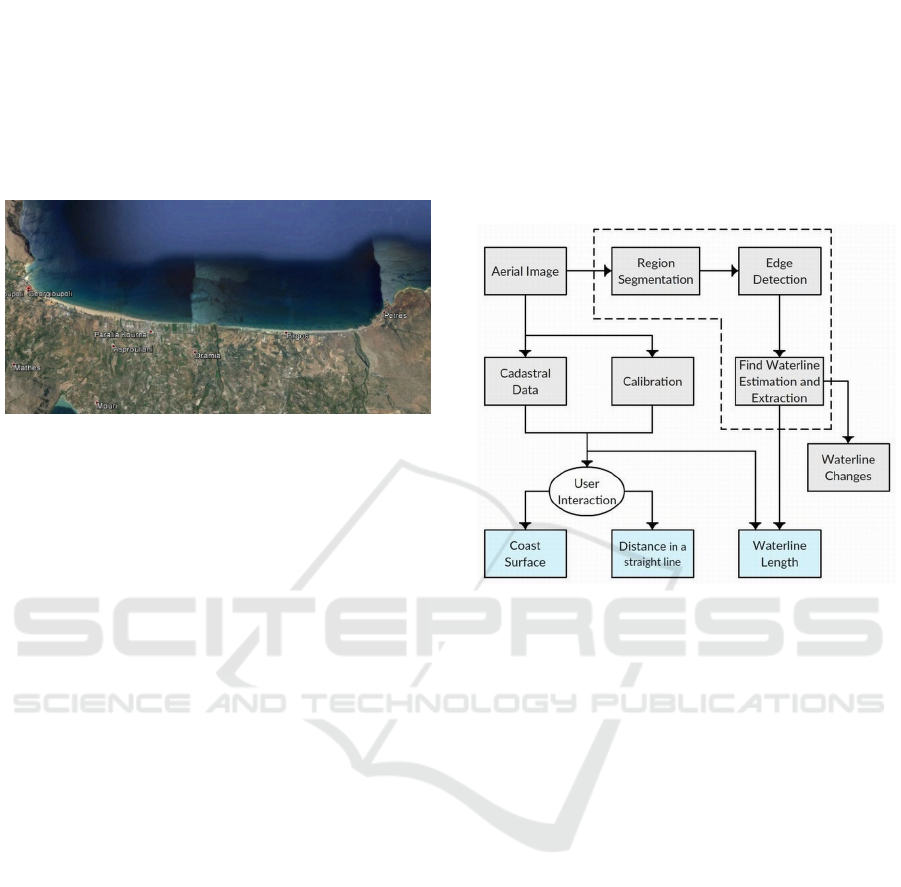
We demonstrate our approach for the town of
Georgioupoli in North Western Crete (Fig. 1). The
proposed framework includes algorithms to extract
the waterline and provides a graphical user interface
to allow the user to extract spatial information about
the coastal area. The user can measure distances and
areas of interest and the results can be visualized
directly on the images.
Figure 1: The chosen area for the demonstration of our
framework.
In addition, we are working on the extension of
the framework to the connection with the Greek
cadaster in order the user to be able to access and
process cadastral data. The overall task is to
effectively manage and associate spatial information
from aerial images and information extracted from
cadaster. This information can be visualized in the
images with the objects of interest together. The goal
of the framework is to: a) Automatically extract the
waterline from aerial images b) to extract metric
information about area, size for objects of interest and
c) to provide spatial information for coastal
management to people for a sustainable development
of the whole region.
2 PROPOSED METHODOLOGY
The waterline estimation method is based on
advanced image processing techniques and consists
of two main steps. The first step provides an
estimation of the coastline based on region
segmentation using a local thresholding method,
while the second step optimizes the results of the first
step based on edge detection using active contours.
Figure 2 presents the block diagram of the proposed
methodology. Blocks inside the dashed lines refer to
methods of waterline extraction, while blue and gray
boxes refer to the functionalities of the framework.
Initially, a preprocessing step is performed on the
input images to remove noise and enhance strong
edges. Aerial photos usually provide a good spatial
coverage of the coast, but they also are inevitably
distorted by noise. A Gaussian filter is applied to
reduce noise without blurring the edges. Another
issue that usually arises is the presence of clouds and
shadows that can deform the data and make it hard to
process the image correctly. We manage this problem
by using an anisotropic diffusion technique (Perona
and Malik, 1987) that emphasizes strong edges, like
coast area buildings, and enhances them or suppresses
weak edges.
Figure 2: Proposed methodology for waterline extraction
with the extension to connect to cadastral data.
The first step aims to segment the image into two
regions; land and sea. The pixels which are located on
the borders of these two regions will constitute the
waterline. To accomplish this task, we developed a
region segmentation algorithm using local
thresholding. It is preferable to use a local threshold
because a global threshold gives false estimations as
a result of intensity heterogeneity of the image.
More specifically, we divide the image into square
overlapping blocks with B width and check the
bimodality of intensity in each of them (Liu and
Jezek, 2004). For every block, we assume that there
is a mixture of two Gaussian distributions (land and
sea), and we test against the null hypothesis of having
just one overall class. We formulate the likelihood
test based on the corresponding probability destiny
functions.
In practice, if the block passes the test, we expect
that there are two clearly separated areas, i.e. land and
sea, so that we can compute the threshold using
Otsu’s method (Otsu, 1979). This method
automatically performs clustering-based image
thresholding of a grayscale image by maximizing the
weighted between-class variance. In this way,
subareas of land are assigned the value 1, while pixels
within sea areas are assigned the value 0. As a post-
GISTAM 2016 - 2nd International Conference on Geographical Information Systems Theory, Applications and Management
100
processing step of this method, a concatenation of
overlapping blocks is performed in order to recreate
the whole image in a binary form and morphological
operations are applied in order to remove small
objects and fill the black holes. Subsequently, we use
the canny edge detector, an edge detection operator,
for the detection of edges in the images. The final
binary image is in the form of a white area that
belongs to land and a black area that belongs to sea.
The result of the canny edge detector refers to
coastline.
Most of the times, the extracted coastline needs
improvement, because of unexpected effects in the
image, such as waves, people and intensity distortion
across the coastline. To be able to handle these issues
we used an open active contour method based on the
classical active contour model (snakes) (Kass et al.,
1998) with free boundary conditions. A snake is an
energy-minimizing spline guided by image forces and
external constrain forces. It consists of an initial
contour C
0
near to a contour in the image and searches
for deformations of C
0
which let it move towards the
actual image contour. We implemented an automatic
process using active contours with free boundary
conditions (Shemesh and Ben-Shahar, 2011). We
initialize the curve using the extracted coastline from
the first step and we compute iteratively the next
possible position of the curve following the gradient
of the image defining its edges. After a certain
number of iterations defined by user, the procedure
stops and outputs the estimated waterline.
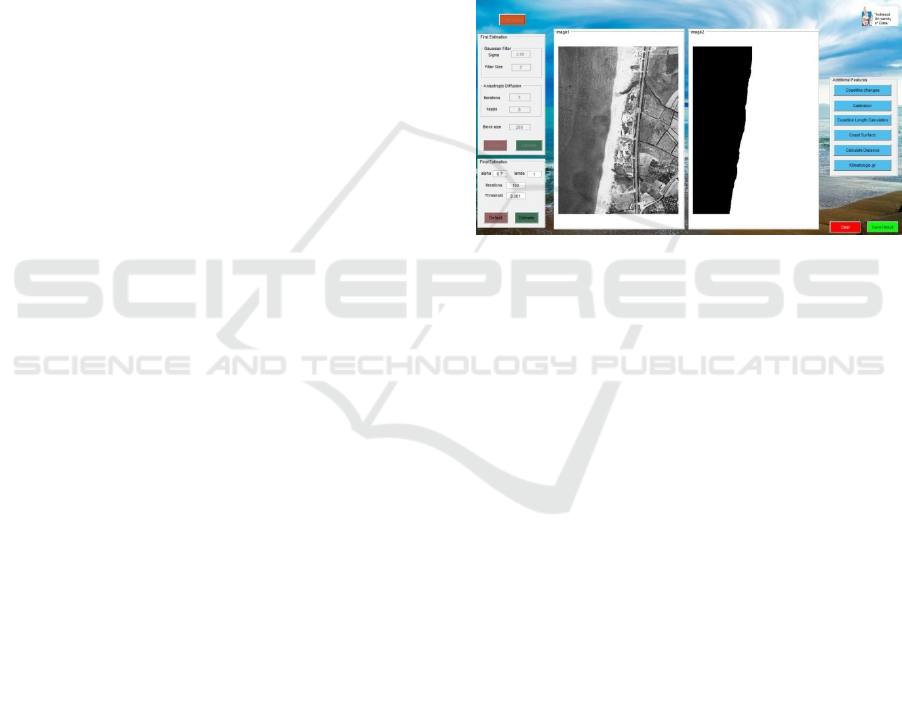
As far for the framework we developed, its
implementation layout and functionality follow.
Figure 3 presents the screen of the application where
two central windows are devoted to the visualization
of the original (left) and processed (right) image,
respectively. The left section of the application
depicts the parameters of the waterline extraction
algorithm and provides the space for adjusting the
algorithmic process. The right section presents the
functionality of the software in association with the
coastline analysis.
The top left box of the framework refers to the
first method’s parameters. Sigma and filter’s size
affect the Gaussian filter.
Sigma refers to standard deviation of Gaussian
distribution. Increasing the standard deviation the
intensity of the noise is reduced, but also appears high
frequency detail attenuation. We have set the number
of 2 as a default value. A larger size filter,
corresponds to a larger convolution mask, but also
affects the details quality of the image. We have set 7
as a default value. It is optimized for the filter size to
be about 3*sigma+1, because, in this way, almost the
whole Gaussian bell is taken into account. Then, the
user chooses the number of iterations and kappa
value, which refers to anisotropic diffusion. Kappa
controls the sensitivity to edges and it is usually
chosen experimentally (the default value is 8), while
the number of iterations must be 5-15, since a higher
number may result in blurring the true edges (the
default value is 5). Next the block size B is defined.
This size depends on the initial image size, because
every block needs to contain necessary information
for our method. We choose 5-8% of total image size,
with default value 300. Next to the setting of the
parameters, the user can proceed with the first
waterline estimation using region segmentation.
Figure 3: On the left is the original image. On the right, the
estimated waterline can be extracted by finding the borders
between the water (black) and land (white).
When the first step is completed, the user chooses
the parameters for the second step. Alpha parameter
controls the internal energy function’s sensitivity to
the amount of stretch in the snake (elasticity). A large
value for alpha decreases the possibility the snake to
change and so the method’s efficiency, so normally
alpha value should be less than 1. In our case, we have
set it to 0.7. Iterations must be defined properly,
because there will be a point that no significant
energy differences are detected. A proper number of
iteration is 100-300. We also provide an optional
threshold to control the energy differences. If the
deference between two consecutive energy values is
below the threshold, the process stops and the final
result is shown at the images section.
As far for the cadastral data association with the
extracted waterline results, in our application there is
a link, called ‘ktimatologio.gr’ (which means
cadaster), that opens the map of Greece in the internet
browser and the user can measure real world
distances, such as buildings. Then by pressing the
‘calibration’ button the user can choose two points
from the initial image which contain the same
building or any other chosen area. A textbox then
opens to enter the known distance and the
Automated Waterline Extraction for Optimal Land Use - A Case Study in Crete
101
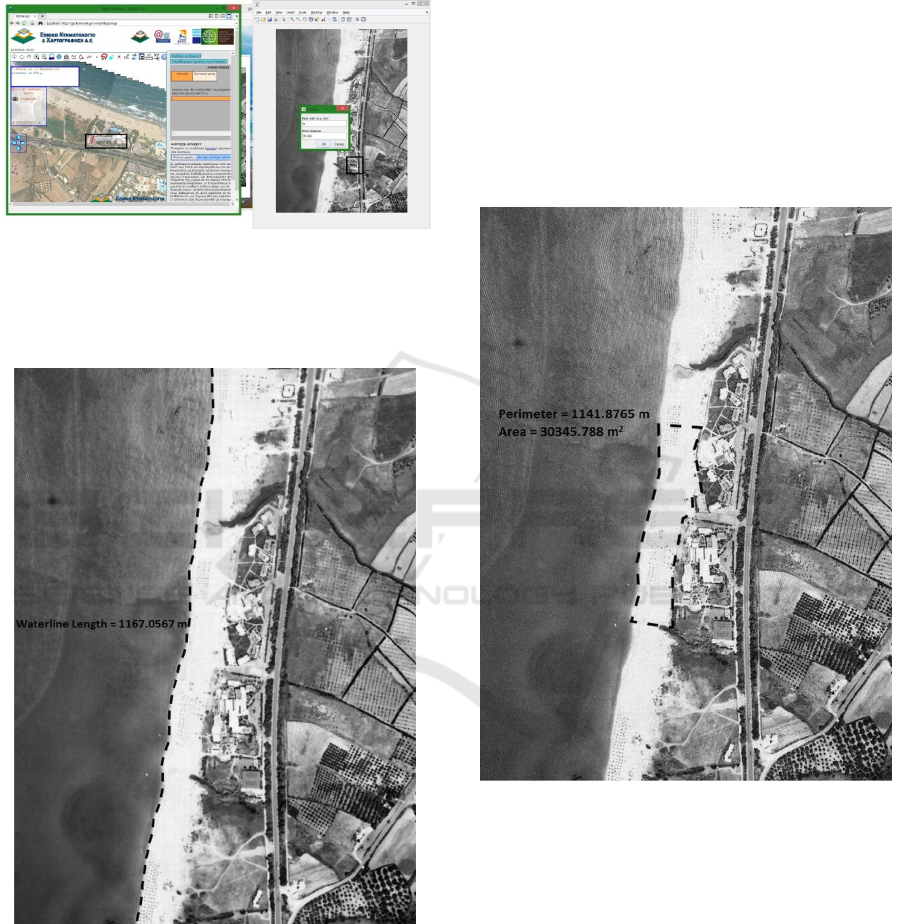
measurement unit (Fig. 4). Now, we are able to
compute the distance per pixel (pixel factor) by
dividing the inserted distance by total number of
pixels contained between two chosen points.
Figure 4: (ktimatologio.gr-calibration). The green box
shows the selected area (tennis court) from ktimatologio.gr,
the Blue box shows the same area from aerial image. We
can also see the text box where we import the real units and
the distance.
Figure 5: The computed length of the estimated waterline.
Moreover, the user is able to perform waterline
length calculation by multiplying the total number of
pixels that belong to the waterline by the pixel factor
computed above. The measurement units are the same
as the user has inserted at the previous step (Fig. 5).
In addition, the option to compute the area and
perimeter of a surface of interest, like area of
buildings, distance from waterline or beach surface
area, is provided by pressing the coast surface button.
A new window opens where the user can select a
polygonal area at the image. The task performed is the
computation of the total number of the pixels which
belong to the perimeter, then the multiplication by the
pixel factor in order to show the perimeter in real
world units.
Finally, the computation of the total number of the
pixels which belong inside this polygonal area is
multiplied by the square of pixel factor in order to
show the surface. Figure 6 displays an example of this
operation.
Figure 6: Computed perimeter and surface of an area
selected by the user.
Another similar function provided is the
calculation of the distance between two points. By
pressing calculate distance, a new window opens
where the user can choose two points of the image.
Αs in the previous case, we compute the total number
of the pixels that belong to the chosen line, multiply
by pixel factor and show the results (Fig. 7). This can
be useful, if we have images of the same area but from
different time periods and want to track the erosion of
the coastline.
GISTAM 2016 - 2nd International Conference on Geographical Information Systems Theory, Applications and Management
102
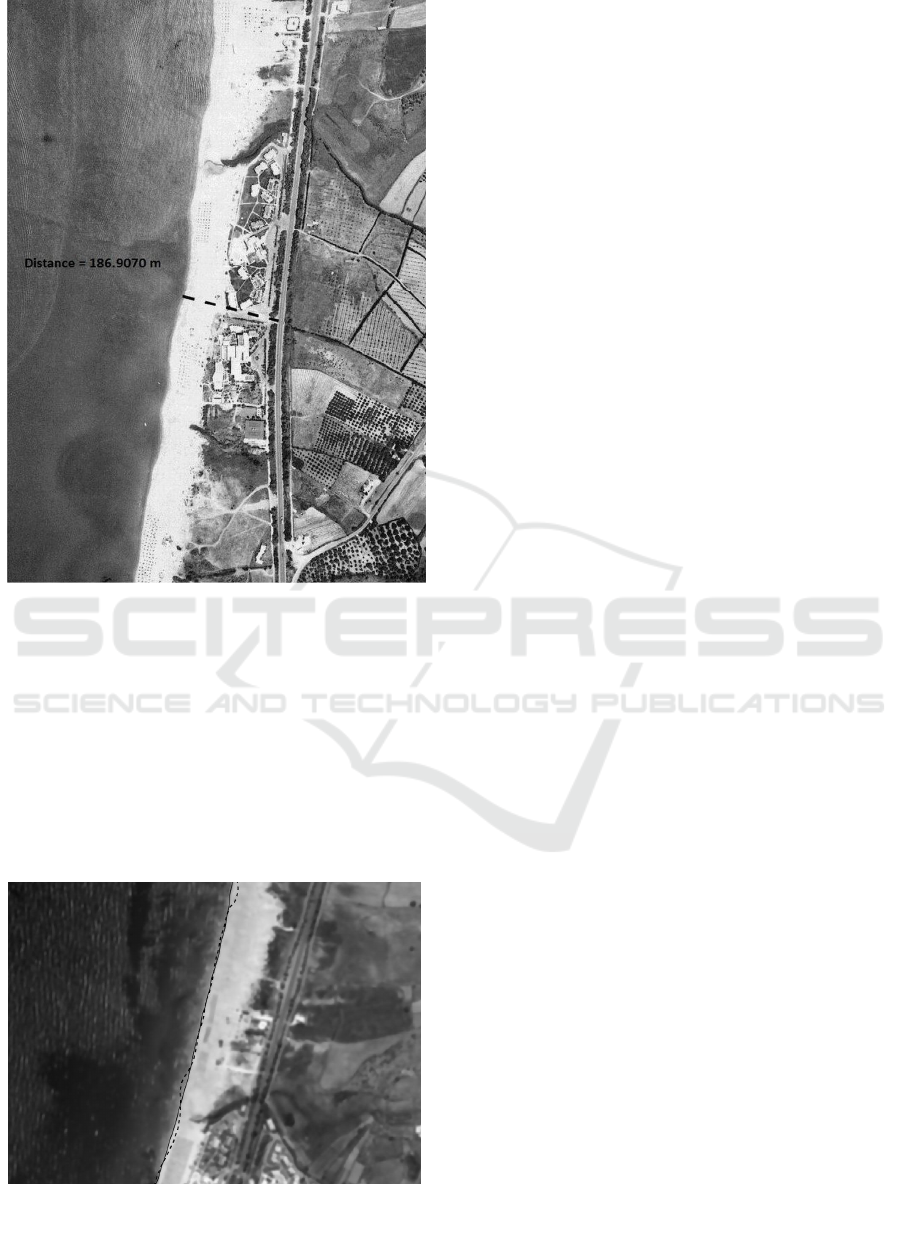
Figure 7: Computed distance of a straight line selected by
the user.
As a final feature of the application, the user can
load two images from different time periods of the
same area by pressing the ‘Waterline changes’ button.
When the images load finishes, the two estimated
waterlines are shown in the same figure, thus the user
is able to identify any possible changes (Fig. 8).
Without georeferenced images, it is difficult to work
with aerial images. This feature works better with
google earth images.
Figure 8: The waterline differences between 2003 and
2010. The dashed line refers to 2003 image, while the solid
line refers to 2010 image from Google Earth.
3 CONCLUSIONS
Our work focuses on the waterline extraction and the
connection of the results with cadastral data. The
waterline extraction is performed through advanced
image processing techniques and the results are
compared to the available cadastral data. A user can
load the images of interest, perform coastline
extraction, view the results and, finally, calculate
useful parameters with distance or area metrics. Since
the framework back-end structure is ready, as a next
step we need to focus on the matching of the aerial
images with the cadastral data in order to finalize the
accuracy estimation of our methodology
As future work, our framework needs to be tested
in more than one administrative region in order to
explore the sensitivity and the performance of the
proposed methods and how these two factors are
affected by image parameters, like image resolution
or image data complexity. We should also further
explore the application’s functionality regarding the
cadastral data.
ACKNOWLEDGEMENTS
This work is partially supported by the project
ASTARTE (Assessment, STrategy And Risk
Reduction for Tsunamis in Europe) FP7-ENV2013
6.4-3, Grant 603839 to the Technical University of
Crete, Greece.
REFERENCES
Boak E. H. and Turner I. L. (2005) Shoreline Definition
and Detection: A Review. Journal of Coastal Research:
Volume 21, Issue 4: pp. 688 – 703.
Dolan, R., Hayden, B., & Heywood, J. (1978). A new
photogrammetric method for determining shoreline
erosion. Coastal Engineering, 2, 21-39.
Google Earth, 2014. Google Earth virtual globe.
http://earth.google.com.
Hellenic Military Geographical Service, HMGS (2015)
http://web.gys.gr/portal/page?_pageid=33,46034&_da
d=portal&_schema=PORTAL
Kass, M., Witkin, A., Terzopoulos, D. (1998). Snakes: active
contour models. Int. J. Comput. Vis. 1 (14), 321–331.
Liu, H. and K. C. Jezek. (2004). Automated extraction of
coastline from satellite imagery by integrating Canny
edge detection and locally adaptive thresholding
methods. International Journal of Remote Sensing 25
5:937–958.
Liu, Y., Li, M., Zhou, M., Yang, K., & Mao, L. (2013).
Quantitative Analysis of the Waterline Method for
Automated Waterline Extraction for Optimal Land Use - A Case Study in Crete
103

Topographical Mapping of Tidal Flats: A Case Study in
the Dongsha Sandbank, China. Remote Sensing, 5(11),
6138-6158.
Otsu, N. (1979) A threshold selection method for grey level
histograms, IEEE Trans. Syst. Man Cybern. SMC-9 (1)
62–66.
Perona, P., Malik, J. (1987). Scale space and edge detection
using anisotropic diffusion, Proc. IEEE Comp. Soc.
Workshop on Computer Vision (Miami Beach, Nov.
30– Dec. 2, 1987), IEEE Computer Society Press,
Washington, 16–22.
Shemesh, M., and Ben-Shahar, O. (2011). Free boundary
conditions active contours with applications for vision,
Advances in Visual Computing, vol. 6938, pp. 180-191.
Synolakis, C. E., Kalligeris, N., Foteinis, S., &
Voukouvalas, E. (2008, April). The plight of the
beaches of Crete. In Proceedings of the Solutions to
Coastal Disasters Congress (pp. 495-506).
Valavanidis, A., and Vlachogianni, T. (2011). The most
important and urgent environmental problems in
Greece in the last decade (2000-2010). Web-site, Dept
of Chemistry University of Athens (www.chem.
uoa.gr/scinews/env01/Env_problems2000-2010. htm).
Zhao, B., Guo, H., Yan, Y., Wang, Q., & Li, B. (2008). A
simple waterline approach for tidelands using multi-
temporal satellite images: a case study in the Yangtze
Delta. Estuarine, Coastal and Shelf Science, 77(1),
134-142.
GISTAM 2016 - 2nd International Conference on Geographical Information Systems Theory, Applications and Management
104
