
Traffic Estimation for Dynamic Capacity Adaptation in Load Adaptive
Network Operation Regimes
Andreas Ahrens
1
, Christoph Lange
2
and César Benavente-Peces
3
1
Hochschule Wismar, University of Technology, Business and Design, Philipp-Müller-Straße 14, 23966 Wismar, Germany
2
Deutsche Telekom AG, Telekom Innovation Laboratories, Winterfeldtstraße 21, 10781 Berlin, Germany
3
Universidad Politécnica de Madrid, Ctra. Valencia. km. 7, 28031 Madrid, Spain
Keywords:
Traffic Prediction, Network Energy Efficiency, Wiener Filtering, Demand-aware Network Operation, Dy-
namic Network Dimensioning, Green Communications.
Abstract:
The energy demand of telecommunication equipment and networks has been identified to be significant. In the
information society such networks are vital for societal and economic welfare as well as for the people’s private
lives. Therefore an improved energy efficiency of telecommunication networks is essential in the context of
sustainability and climate change. Load-adaptive regimes are a promising option for energy-efficient and
sustainable network operation. As the capacity is adapted to temporally fluctuating traffic demands, they
require a robust traffic demand estimation. As a potential solution to mitigate this problem, a method for
reliable traffic demand forecasting on relevant time scales using Wiener filtering is presented. The results
show that the capacity dimensioning based on the proposed Wiener filtering traffic estimation method leads to
reliable outcomes enabling sustainable and efficient network operation.
1 INTRODUCTION
Large-scale telecommunication networks comprising
a nation-wide network infrastructure often are con-
siderable electricity consumers (Roy, 2008; Hed-
deghem et al., 2014). Besides their undisputed abil-
ity to support the information society in getting more
environmental-friendly, for example by providing the
basis for telepresence meetings – replacing in parts
business trips – and remote office work – reducing
commuting – they are for their selves causing en-
vironmental impact and, furthermore, the electricity
consumed by the network operation affects the op-
erators’ energy bills. Therefore, improvement op-
tions have been identified throughout the recent past
(e.g. (Lange et al., 2014)). Among them a promi-
nent opportunity for improving the energy efficiency
of networks is load-adaptive operation where network
capacity follows traffic demands to a certain extent
using different technical approaches (e.g. (Anton-
akopoulos et al., 2010; Francini and Stiliadis, 2010;
Puype et al., 2011; Lange and Gladisch, 2011)).
This is in contrast to the prevalent network design
and building practice – where network capacity is
above all provided based on the expected peak traffic
plus a capacity reserve. Therefore load-adaptive net-
work operation regimes constitute a significant step
towards network energy efficiency improvements and
telecommunication sector sustainability at large. Ex-
amples for such a kind of dynamic load-adaptive net-
work operation can be found on Ethernet links (Re-
viriego et al., 2011), they are standardized as low
power mode regimes for ADSL connections (ITU-
T, 2009a; ITU-T, 2009b) and furthermore they are
discussed as radio access network management ap-
proaches (Ambrosy et al., 2011).
To leverage this energy efficiency improvement
potential, it is essential to adapt the provided network
capacity to the fluctuating traffic demands and thus, in
turn, to estimate the traffic demand reliably for these
capacity dimensioning purposes: The capacity of net-
work links and sections has to be set based on sound
and robust estimations of the expected traffic in par-
ticular network parts in order that network services
can be provided in consistently high quality – but at
improved energy efficiency.
In this contribution a method for traffic predic-
tion is presented that makes use of Wiener filtering
(Wiener, 1949; Vega and Rey, 2013; Vaseghi, 2009)
as it is known from statistical signal processing: The
knowledge regarding traffic behaviour from the past,
e. g. from previous hours or days, is used to estimate
Ahrens, A., Lange, C. and Benavente-Peces, C.
Traffic Estimation for Dynamic Capacity Adaptation in Load Adaptive Network Operation Regimes.
DOI: 10.5220/0005932800990104
In Proceedings of the 6th International Joint Conference on Pervasive and Embedded Computing and Communication Systems (PECCS 2016), pages 99-104
ISBN: 978-989-758-195-3
Copyright
c
2016 by SCITEPRESS – Science and Technology Publications, Lda. All rights reserved
99
the future traffic.
For this purpose, a traffic-related system model is
constructed in section 2. The related Wiener filtering
estimation procedure is derived in section 3. Based on
this, in section 4 a method is presented to show how
the capacity of a certain network link or section can
be dimensioned by using the estimated trafficfunction
– while also taking into account a capacity reserve in
a load-adaptive operation regime. The obtained re-
sults are introduced and analyzed in section 5. For
verification purposes, the originally observed traffic is
compared with the estimated traffic. Also, the energy
consumption associated with the newly proposed ca-
pacity dimensioning strategy is calculated and com-
pared to conventional procedures as a reference and
upper boundary and to the practically unachievable
case when the network capacity would follow the traf-
fic ideally – as a second, lower, limit. The previously
explained concept is verified by means of a statisti-
cal analysis where the stochastic traffic characteris-
tics are varied and the resulting capacity dimension-
ing and energy efficiency is analyzed. Concluding re-
marks are provided in section 6.
2 TRAFFIC-RELATED SYSTEM
MODEL
As a basis for establishing traffic prediction algo-
rithms real measured traffic data or a modeled traffic
time function with suitable characteristics and statis-
tics is necessary. To show the conceptual principle
concept, throughout this paper a traffic model is used
that is referring to an exemplary link in a network
whose capacity is subject to load-adaptive switching
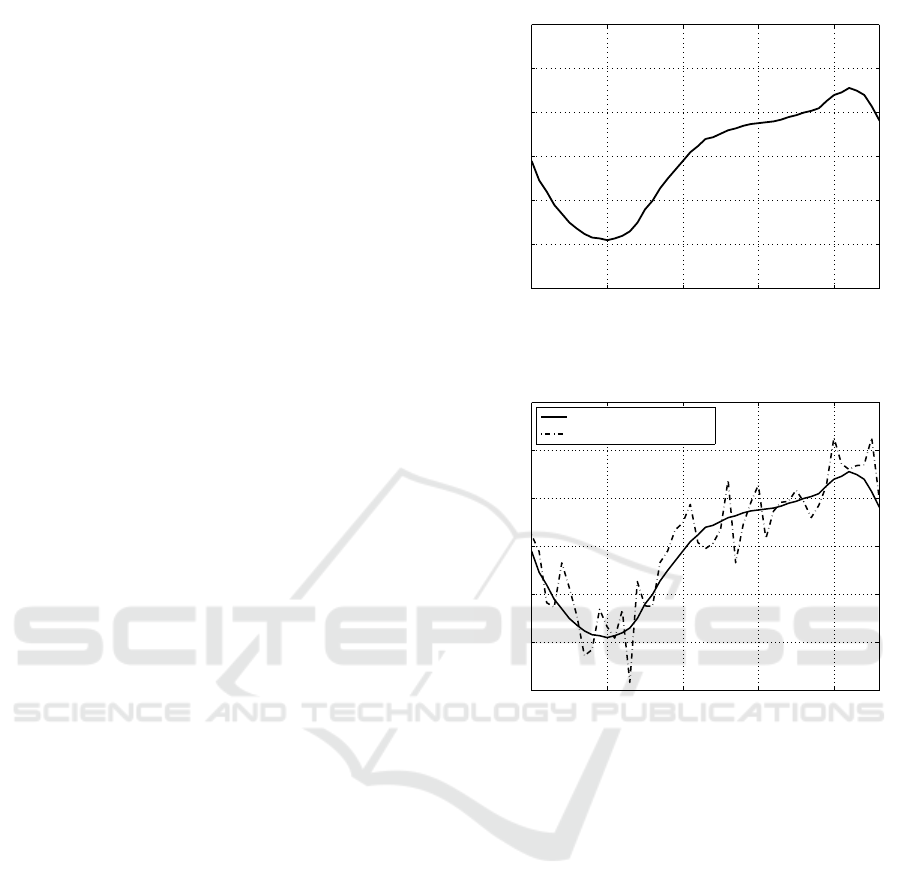
regimes. The traffic function is constructed as fol-
lows: An underlying time function s(k), with vari-
ations on a longer time scale, is used for modelling
the average traffic fluctuation observed for an exem-
plary link as published in (DE-CIX, 2016) as shown
in Fig. 1. To model the stochastic variations in the
traffic on a shorter time scale, an additive white Gaus-
sian noise n(k) with zero mean and the variance P
R
is added. In consequence, a fictitious but realistic
traffic function v(k) is obtained that is referred to an
observed traffic throughout the paper. The observed
(measured) traffic v(k) results analytically in:
v(k) = s(k) + n(k) . (1)
Fig. 2 shows exemplary curves of the observed (mea-
sured) traffic v(k) and the underlying averaged traffic
function s(k). The resulting system model is high-
lighted in Fig. 3. This modelled traffic contains the
long-term traffic fluctuations over a day as well as
0 5 10 15 20 23
0
0.5
1
1.5
2
2.5
3
time (in h) →
average traffic (inGbit/s) →
Figure 1: Average diurnal traffic time function taken from
(DE-CIX, 2016).
0 5 10 15 20 23
0
0.5
1
1.5
2
2.5
3
time (in h) →
traffic (inGbit/s) →
average (mean) traffic
observed traffic
Figure 2: Characteristics of exemplarily averaged (solid
line) and observed traffic (dashed line).
the inherent stochastic nature of typical broadband
data traffic. The complementary cumulative distribu-
tion function (CCDF) of the modelled traffic at noon
is shown in Fig. 4. Assuming a throughput of 1,72
Gbit/s (averaged traffic observed s(k)) at noon traffic
fluctuations become obvious. In conclusion, in this
way an appropriate traffic model has been obtained
that can be described and adjusted by analytic param-
eters.
3 TRAFFIC PREDICTION USING
WIENER FILTERING
Traffic prediction plays an important role when opti-
mizing a network as the traffic demand applied to a
network is a key input parameter for network design
and dimensioning. The future traffic can be estimated
by taking the last traffic values into account. A lin-
ear predictor can be used to estimate the traffic at the
SPCS 2016 - International Conference on Signal Processing and Communication Systems
100
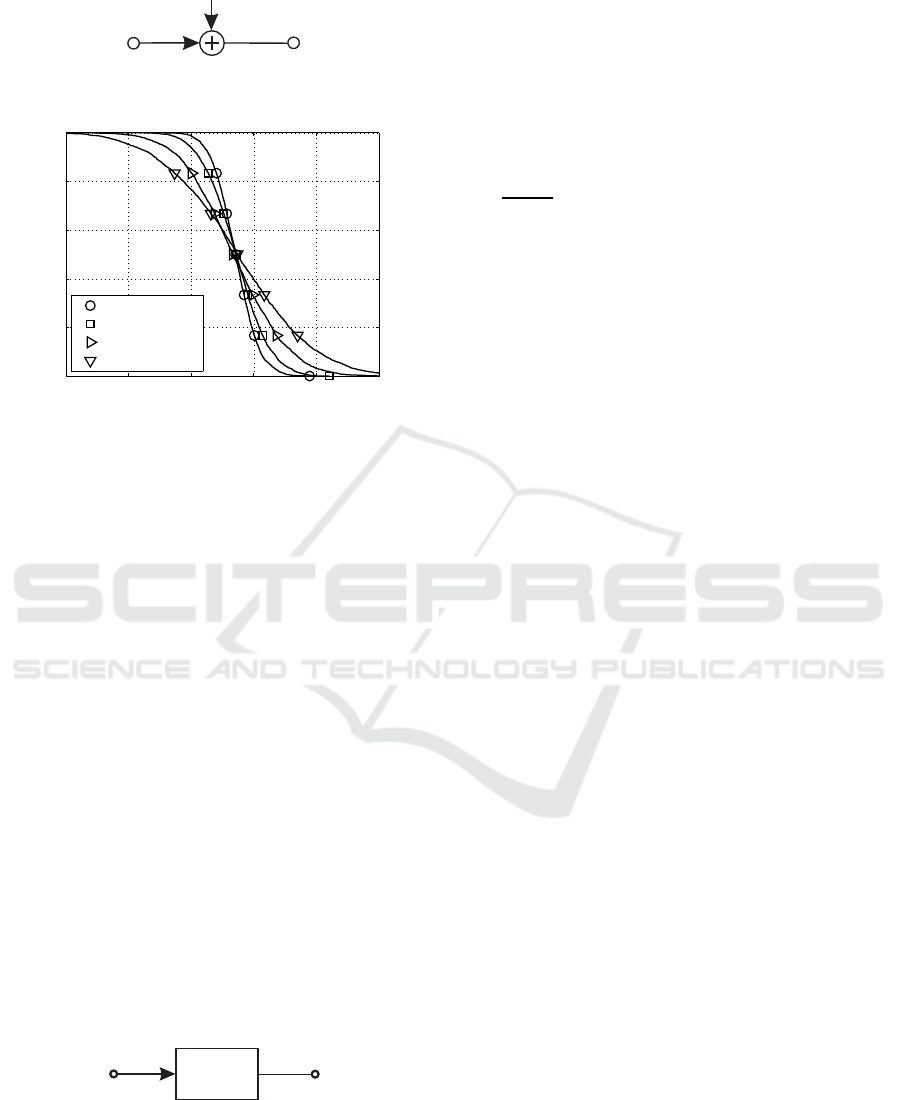
s(k)
n(k)
v(k)
Figure 3: Resulting system model for modelling traffic fluc-
tuations.
−1 0 1 2 3 4
0
0.2
0.4
0.6
0.8
1
P
R
= 0,1 V
2
P
R
= 0,2 V
2
P
R
= 0,5 V
2
P
R
= 1,0 V
2
Prob{modelled throughput ≥ U} →
U →
Figure 4: CCDF of the throughput at noon taking different
values of the noise power P
R
into account.
time k by taking the last q traffic values v[k − q] into
account and results in
ˆv[k] =
q
∑
µ=1
p
µ
v[k− µ] (2)
with the parameter q describing the order of the pre-
dictor. The coefficients of the predictor p
µ
(for µ =
1,2, · ·· , q) have to be defined by minimizing the en-
ergy of the error signal e[k] = v[k] − ˆv[k], i. e.
E
h
(v[k] − ˆv[k])
2
i
→ Min . (3)
Taking (2) into account, the error signal e[k] results in
e[k] = v[k] − ˆv[k] =
q
∑
µ=0
b
µ
v[k− µ] . (4)
with the parameter b[µ] defined as
b[µ] =
1 µ = 0
−p[µ] 1 ≤ µ ≤ q
0 otherwise
(5)
The error signal e(k) appears after linear filtering of
the signal v(k) with the so far unknown filter coeffi-
cients b(k) (see Fig. 5).
v(k)
e(k)
b(k)
Figure 5: Error signal e(k) as a function of traffic function
v(k).
Differentiating the error signal e[k] with respect to
the b[µ] (for µ = 1,2, . ..,q; since b[0] is assumed to be
b[0] = 1) and setting it to zero, leads to the optimal set
of filter coefficients b[µ] (for µ = 1,2, ..., q). Thereby,
taking into consideration the squared error expression
e
2
[k] =
q
∑
µ=0
b
µ
v[k− µ]
!
2
(6)
and its partial derivatives leads to (for µ = 1,2,..., q)
∂e
2
[k]
∂b
µ
= 2
q
∑
µ=0
b
µ
v[k− µ]
!
v[k− µ] = 0 . (7)
Taking the expectation of e
2
[k] into account, (7) can
be rewritten in a matrix arrangement as
Rp = r , (8)
which are also known as Yule-Walker equations. With
the definition of the autocorrelation function of the
real-valued signal v(k) in the following form
φ
vv
[µ] = E{v[k]v[k + µ]} (9)
the matrix R defined in (8) results in
R =
φ
vv
[0] φ
vv
[−1] ·· · φ
vv
[−(q−1)]
φ
vv
[1] φ
vv
[0] ·· · φ
vv
[−(q−2)]
.
.
.
.
.
.
.
.
.
.
.
.
φ
vv
[(q−1)] · ·· φ
vv
[1] φ
vv
[0]
(10)
Finally, the vector p with the unknown predictor filter
coefficients as well as the vector r can be obtained as
p =
p[1]
p[2]
.
.
.
p[q]
and r =
φ
vv
[1]
φ
vv
[2]
.
.
.
φ
vv
[q]
. (11)
After inverting the matrix R, the predictor coefficients
p(k) can be obtained.
Taking the stationary mean (averaged) traffic s(k)
and the added noise n(k) into account, the observed
noisy process v(k) forms the basis for the proposed
traffic prediction. Using the Wiener filter the mean
square error between the estimated traffic ˆv(k) and the
mean (averaged) traffic s(k) can be minimized.
In Fig. 6 the curves of the exemplary observed
traffic v(k) and the predicted traffic ˆv(k) are shown:
It becomes obvious that the estimated or predicted
time function follows the observed traffic in tendency
but is not directly useful for capacity dimensioning –
as there are time periods where the traffic is under-
estimated. Therefore, some modification or adaption
of the Wiener filtering is necessary for capacity di-
mensioning purposes in order to take those deviations
into account. The target is always a reliable network
operation – meaning here sufficient capacity – and
then somewhat downstream – the improved energy ef-
ficiency.
Traffic Estimation for Dynamic Capacity Adaptation in Load Adaptive Network Operation Regimes
101
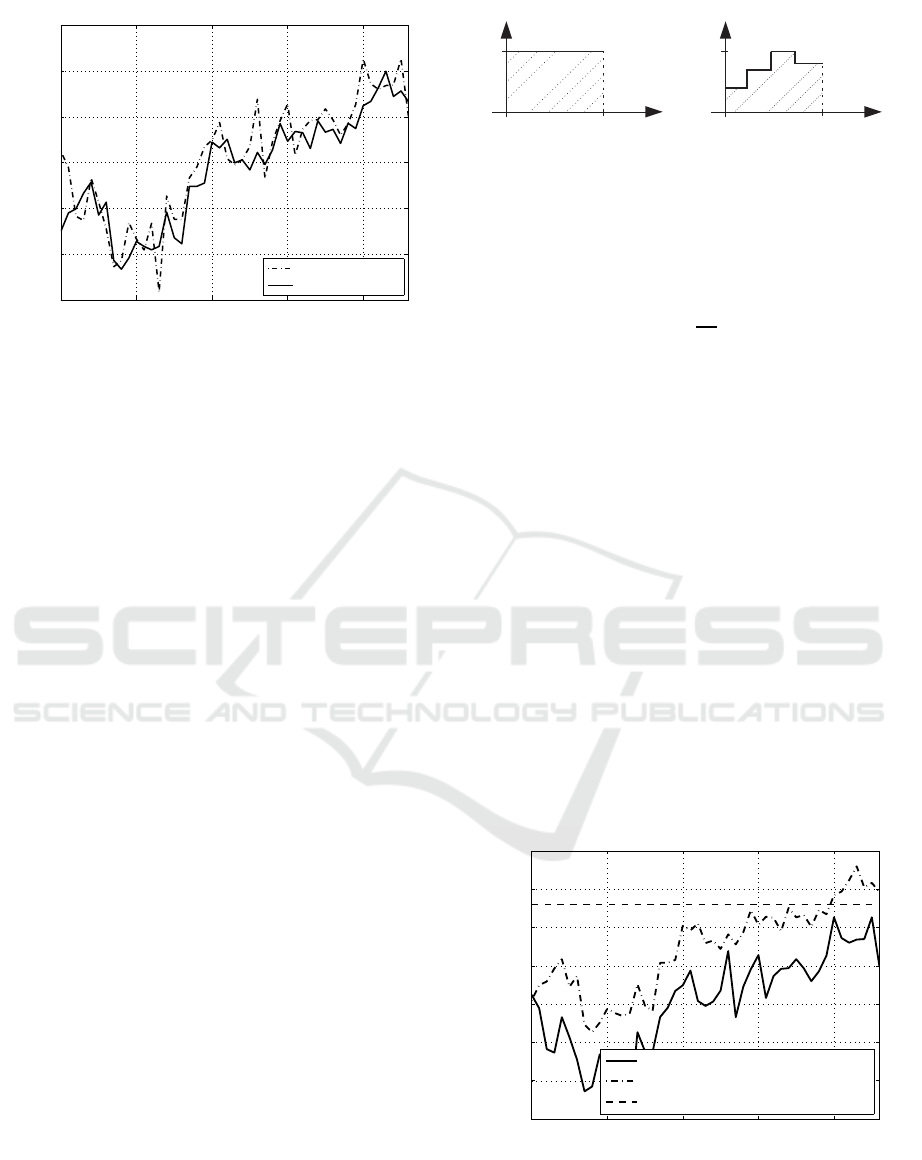
0 5 10 15 20 23
0
0.5
1
1.5
2
2.5
3
time (in h) →
traffic (inGbit/s) →
observed traffic
predicted traffic
Figure 6: Observed (dashed line) and predicted (solid line)
traffic time functions.
4 CAPACITY DIMENSIONING
AND ENERGY EFFICIENCY
Provided that there is a linear dependency between
capacity and power ensured by the network elements,
from the capacity time function c(t) a power time
function P(t) is obtained by
P(t) = Kc(t) (12)
where the factor K exhibits the dimension of an en-
ergy per bit (in J/bit or Ws/bit). The actual value and
magnitude of K depends strongly on the system tech-
nologies and their generations. In this work the pa-
rameter K is assumed to be K = 10
−6
Ws/bit. From
the temporal power consumption curves the energy
consumption during a certain period of time T is ob-
tained by
E
1
=
Z
T
0
P(t) dt . (13)
Having a capacity function which is independentfrom
current traffic, i. e. c(t) = c
0
= const., the power con-
sumption function P(t) is assumed to be constant, i. e.
P(t) = P
0
. In this case the energy consumption of a
considered time period T is given by
E
0
=
T
Z
0
P
0
dt = P
0
T . (14)
Taking into account that the power consumption func-
tion P(t) follows the traffic function v(t), P(t) has to
be adapted according to the traffic (Fig. 7). As high-
lighted by Fig. 7 load adaptiveness leads to energy
efficiency improvement. Now, the temporal power
consumption P(t) is no longer constant and the en-
ergy consumption of a considered time period T is
T
T
t
t
P(t)
P(t)
P
0
P
0
E
0
E
1
Figure 7: Energy efficiency improvement by taking
power traffic-dependent time function for load-adaptiveness
(right) and non load-adaptiveness (left) into account.
obtained by (13). To measure the energy efficiency
improvement of particular load-adaptive case n, the
energy efficiency parameter
ε
n
=
E
n
E
0
(15)
is used, as defined in (Lange and Gladisch, 2011).
Here, E
0
describes the reference case with no load-
adaptiveness at all.
5 ENERGY EFFICIENCY
RESULTS
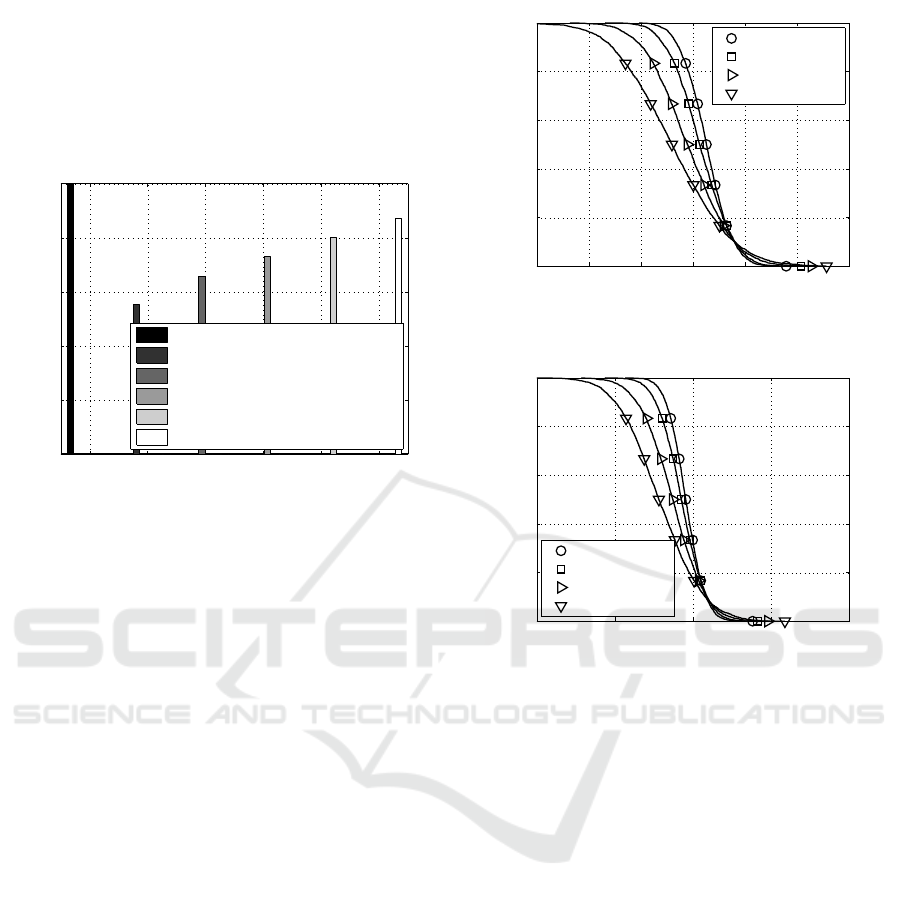
Based on the capacity dimensioning use cases in
Fig. 8 it is assumed that the capacity follows directly
the estimated traffic. As an example a noise power
P
R
= 0,1 V
2
is assumed. This equals 1 W at a lin-
ear and constant resistance of 1Ω. In order to avoid a
capacity bottleneck a traffic reserve ∆ is added to the
estimated traffic ˆv(t), i.e.
c(t) = ˆv(t) + ∆ (16)
to ensure a sufficient capacity. This traffic reserve ∆ is
especially needed for situations where the real traffic
is under-estimated by the predictor.
0 5 10 15 20 23
0
0.5
1
1.5
2
2.5
3
3.5
time (in h) →
traffic (inGbit/s) →
observed traffic
c(t) = ˆv(t) + ∆;∆ = 0,8 Gbit/s
c
0
= 2,8 Gbit/s = const
Figure 8: Capacity as a function of the estimated traffic for
different parameters of the traffic reserve.
The energy efficiency of different cases of load-
adaptive operation regimes is shown in Fig. 9.
SPCS 2016 - International Conference on Signal Processing and Communication Systems
102
Hereby, scenario 0 describes the reference case em-
ploying no load-adaptivenessat all and scenario 1 rep-
resents the best-case limit, where the capacity follows
the observed traffic ideally. Realistic load-adaptive
regimes will exhibit energy efficiencies ε
n
between
those boundaries. It becomes obvious, that the energy
0 1 2 3 4 5
0
0.2
0.4
0.6
0.8
1
scenario →
ε
n
→
no load-adaptiveness
perfect load-adaptiveness
c(t) = ˆv(t) + ∆;∆ = 0,4 Gbit/s
c(t) = ˆv(t) + ∆;∆ = 0,6 Gbit/s
c(t) = ˆv(t) + ∆;∆ = 0,8 Gbit/s
c(t) = ˆv(t) + ∆;∆ = 1,0 Gbit/s
Figure 9: Energy efficiency for different parameters of the
traffic reserve based on c
0
= 2,8 Gbit/s.
efficiency is increased when approximating the traffic
curve more exactly. However, in scenarios where the
traffic is under-estimated a capacity bottleneck could
appear. The probability will doubtlessly increase for
lower ∆. That’s why the parameter ∆. has to be se-
lected carefully.
In Fig. 10 the complementary cumulative distri-
bution function (CCDF) is shown for the estimated
traffic curve by the Wiener filtering algorithm at noon
taking different levels of uncertainty (modeled by a
noise power P
R
) into account. Here the probability
is shown for the case that the estimated throughput is
larger than a given threshold U. Assuming a through-
put of 1,72 Gbit/s (averaged traffic observed s(t)) at
noon it becomes obvious that the estimated traffic
leads to a capacity bottleneck in situation where the
predicted traffic is under-estimated compared to the
real traffic. Only in 15 percent of all realizations the
estimated traffic throughput is larger than averaged
traffic observed at noon, i.e., 1,72 Gbit/s. The un-
der estimation of the real traffic will be compensated
by the introduced traffic reserve ∆. It becomes obvi-
ous that the larger the uncertainty (modeled by a noise
power P
R
), the higher the fluctuations in the estimated
throughput.
Fig. 11 shows the estimated throughput error at
noon when comparing the predicted traffic ˆv(k) with
the averaged (mean) traffic s(k), i. e.
ˆv(k) − s(k) . (17)
Taking different levels of uncertainty (modeled by the
0 0.5 1 1.5 2 2.5 3
0
0.2
0.4
0.6
0.8
1
P
R
= 0,1 V
2
P
R
= 0,2 V
2
P
R
= 0,5 V
2
P
R
= 1,0 V
2
Prob{estim. through put ≥ U} →
U →
Figure 10: CCDF of the estimated throughput at noon tak-
ing different values of the noise power P
R
into account.
−2 −1 0 1 2
0
0.2
0.4
0.6
0.8
1
P
R
= 0,1 V
2
P
R
= 0,2 V
2
P
R
= 0,5 V
2
P
R
= 1,0 V
2
Prob{throughput error ≥ U} →
U →
Figure 11: CCDF of the estimated throughput error at noon
taking different values of the noise power P
R
into account.
power P
R
) into account the importance of the intro-
duced traffic reserve ∆ is visible in situations where
the traffic is underestimated.
Using the Wiener filter the mean square error be-
tween the estimated traffic ˆv(k) and the mean (aver-
aged) traffic s(k) is minimized. Therefore, not only
the noise n(k) is affected by the proposed prediction
algorithm but also the mean (averaged) traffic s(k).
Thus different slopes of the CCDF curves, depending
on the levels of uncertainty, can be obtained as given
in Fig. 10 and 11.
6 CONCLUSIONS
In the context that the energy consumption of large
operator’s telecommunication networks is significant,
load-adaptive network operation regimes are widely
accepted as a means to improve communication net-
works’ energy efficiency. For their application to real
networks, they require a reliable estimation of the ex-
pected future traffic demands on certain links and net-
work sections in order to provide capacity accord-
Traffic Estimation for Dynamic Capacity Adaptation in Load Adaptive Network Operation Regimes
103

ing to the demands. A method is presented that uti-
lizes Wiener filtering techniques to predict future traf-
fic demands based on traffic observations from the
past. The results show that this method is suitable for
this kind of application in real-world network scenar-
ios.. With the predicted traffic values and resulting ca-
pacity dimensioning significant energy efficiency im-
provements can be obtained under realistic precon-
ditions. However, the results show that a sufficient
reserve capacity has to be added in order to enable
reliable traffic flows. As this capacity reserve itself
impacts the targeted energy efficiency improvement,
it has to be chosen carefully.
For application in large-scale networks such traf-
fic prediction algorithms – as discussed and investi-
gated throughout this article – have to be translated
into robust and practically manageable software pro-
grams that converge to reliable solutions in suitable
time frames. Also, a comparison to possible alterna-
tive approaches with their convergence behavior and
prediction results is a task for further work.
REFERENCES
Ambrosy, A., Blume, O., Klessig, H., and Wajda, W.
(2011). Energy saving Potential of Integrated Hard-
ware and Resource Management Solutions for Wire-
less Base Stations. In 22nd International Symposium
on Personal Indoor and Mobile Radio Communica-
tions (PIMRC), Toronto (Canada).
Antonakopoulos, S., Fortune, S., and Zhang, L. (2010).
Power-aware Routing with Rate-adaptive Network El-
ements. In IEEE GLOBECOM, Workshop on Green
Communications (GreenCom), pages 1428–1432, Mi-
ami, Florida (USA).
DE-CIX (2016). DE-CIX Traffic Statistics, http://www.de-
cix.net/about/statistics/.
Francini, A. and Stiliadis, D. (2010). Performance Bounds
of Rate-Adaptation Schemes for Energy-Efficient
Routers. In International Conference on High Per-
formance Switching and Routing (HPSR), pages 175–
182, Dallas, Texas (USA).
Heddeghem, W. v., Lambert, S., Lannoo, B., Colle, D.,
Pickavet, M., and Demeester, P. (2014). Trends in
Worldwide ICT Electricity Consumption from 2007
to 2012. Computer Communications, 50:64
˝
U–76.
ITU-T (2009a). Recommendation ITU-T G.992.3,
Asymmetric Digital Subscriber Line 2 Transceivers
(ADSL2).
ITU-T (2009b). Recommendation ITU-T G.992.5,
Asymmetric Digital Subscriber Line 2 Transceivers
(ADSL2) .
Lange, C. and Gladisch, A. (2011). Limits of Energy Ef-
ficiency Improvements by Load-Adaptive Telecom-
munication Network Operation. In 10th Conference
of Telecommunication, Media and Internet Techno-
Economics (CTTE), pages S5–1, Berlin (Germany).
Lange, C., Kosiankowski, D., Betker, A., Simon, H., Bayer,
N., v. Hugo, D., Lehmann, H., and Gladisch, A.
(2014). Energy Efficiency of Load-Adaptively Oper-
ated Telecommunication Networks. IEEE/OSA Jour-
nal of Lightwave Technology, 32(4):571 – 590.
Puype, B., Vereecken, W., Colle, D., Pickavet, M., and De-
meester, P. (2011). Multilayer Traffic Engineering for
Energy Efficiency. Photonic Network Communica-
tions, 21(2):127–140.
Reviriego, P., Christensen, K., Rabanillo, J., and Maestro,
J. A. (2011). An Initial Evaluation of Energy Efficient
Ethernet. IEEE Comm. Letters, 15(5):578
˝
U–580.
Roy, S. N. (2008). Energy Logic: A Road Map to Reduc-
ing Energy Consumption in Telecommunications Net-
works. In International Telecommunications Energy
Conference (INTELEC), pages paper 4–2, San Diego,
California (USA).
Vaseghi, S. V. (2009). Advanced Digital Signal Processing
and Noise Reduction. John Wiley & Sons, Chichester.
Vega, L. R. and Rey, H. (2013). A Rapid Introduction to
Adaptive Filtering. Springer, Heidelberg, New York.
Wiener, N. (1949). Extrapolation, Interpolation, and
Smoothing of Stationary Time Series. Wiley, New
York.
SPCS 2016 - International Conference on Signal Processing and Communication Systems
104
