
Towards a Mobile Application for an Engineering Geology Course
A Contribution to Improved Student Learning
Jo
˜
ao Paulo Barros
1,2
, Pedro Caixinha
1
and Sofia Soares
1,3
1
ESTIG, Instituto Polit
´
ecnico de Beja, Beja, Portugal
2
UNINOVA-CTS, Monte de Caparica, Portugal
3
Geobiotec, Universidade de Aveiro, Aveiro, Portugal
Keywords:
Engineering Geology, Ubiquitous Learning, Education, Rock Mass Description, Mobile, Computer Support,
Software.
Abstract:
One of the subjects studied on engineering geology courses is the description of rock masses and the applica-
tion of geotechnical classifications. Field information is collected and organised in order to make possible to
apply rock mass classification systems and analyse stereographic projection data. The present work proposes
the use of computer supported ubiquitous learning to collect and treat field data. It presents work in progress
towards the creation of a mobile application suitable for Engineering Geology courses. A first prototype for
the Apple iOS system is presented.
1 INTRODUCTION
Engineering geology, where students deal with lab-
oratory and field information in order to understand
and learn how to classify rocks and rock masses, is a
core subject in several higher education study cycles,
most notably civil engineering. In fact, ”During the
feasibility and preliminary design stages of a project,
when very little detailed information is available on
the rock mass and its stress and hydrologic character-
istics, the use of a rock mass classification scheme can
be of considerable benefit” (Hoek, 2006).
One of the used learning strategies is to give stu-
dents a selected rock mass site and ask them to char-
acterise and classify it. Students should be able to
collect field data, analyse those data, and make a fi-
nal report summarising all the information, as well as
applying Bieniawski classification system to that rock
mass (Bieniawski, 1989).
Based on theoretical lectures and literature, stu-
dents are exposed to the initial approach, to the clas-
sification system, and to needed parameters. Yet, it
is during the first field observation that the real prob-
lem is presented and effective learning occurs. Each
group, composed by three students, has to character-
ize a section of a rock mass. To that end, they use a
template to classify a list of field observations. Study
methodology starts with the geographic and geologi-
cal location of the rock mass, the identification of rock
type, texture, colour, weathering degree, discontinu-
ities (faults, folds, schistosity, factures), presence of
water, and other relevant factors to the stability of the
rock mass.
Recording these data from the rock mass, forces
students to use several devices like compass, maps,
camera, as well as pencil and paper. Yet, nowa-
days, with the available technology, it should be pos-
sible to collect and record all data in a simpler and
more integrated way. Inspired by some related liter-
ature (Ho et al., 2012), this paper presents work in
progress towards the creation of a computer applica-
tion for mobile devices, namely tablet computers. The
app will allow a simpler and structured way to col-
lect and assemble field information, allowing a more
flexible data collection and treatment. Hence, this ar-
ticle presents the motivation for the development of
an application to collect field information in order to
understand and learn how to classify rocks and rock
masses.
The paper is structured as follows: after this intro-
duction, Section 2 presents some background infor-
mation that contextualises the app functionalities and
Section 3 presents the results of a student survey re-
garding the perceived importance of the tool. After,
Section 4 presents the developed prototype and Sec-
tion 5 concludes.
Barros, J., Caixinha, P. and Soares, S.
Towards a Mobile Application for an Engineering Geology Course - A Contribution to Improved Student Learning.
In Proceedings of the 8th International Conference on Computer Supported Education (CSEDU 2016) - Volume 2, pages 421-426
ISBN: 978-989-758-179-3
Copyright
c
2016 by SCITEPRESS – Science and Technology Publications, Lda. All rights reserved
421
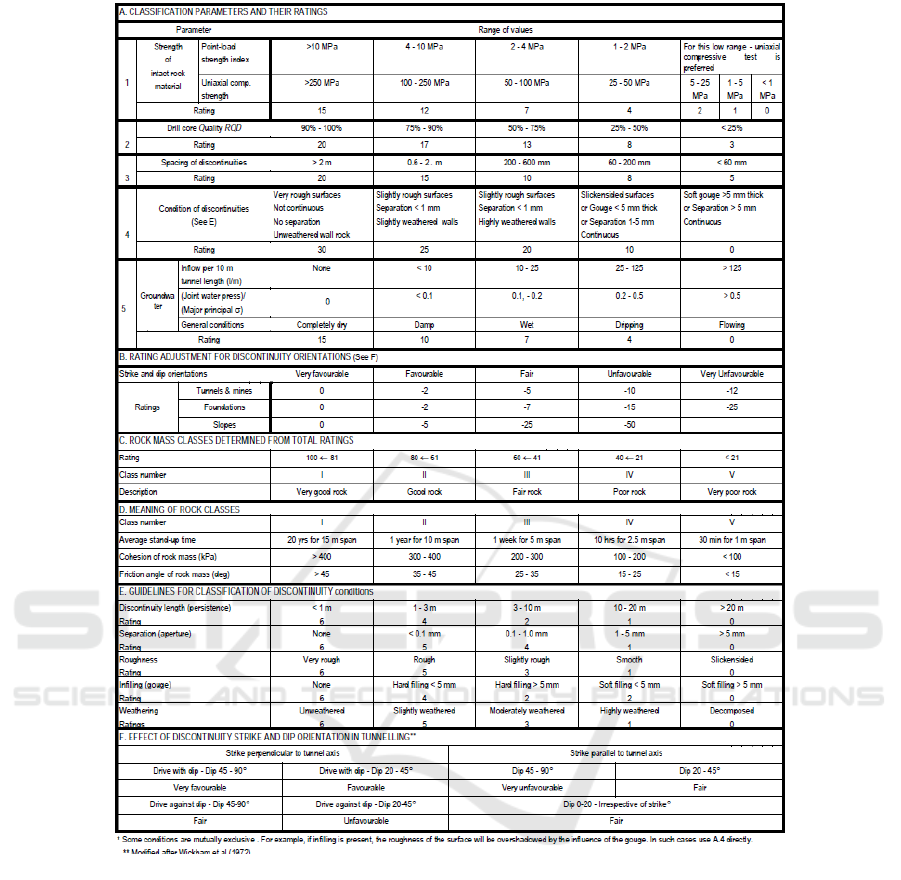
Figure 1: Rock Mass Rating System (after (Bieniawski, 1989)).
2 BACKGROUND
Rock mass characterisation is an important part of en-
gineering geology practice. It is relevant that engi-
neers learn how to obtain and read data related to rock
mass characterisation.
Even with several limitations, rock mass classifi-
cations can be very useful during feasibility and pre-
liminary design stages of a project. Although quite
a few classification systems are available, one of the
most widespread is the Rock Mass Rating System
(RMR), proposed by Bieniawski, originally in 1973
(Bieniawski, 1973).
RMR is obtained through the sum of the different
weighing of six parameters (see Figure 1): (1) Uni-
axial compressive strength; (2) Rock quality desig-
nation; (3) Spacing discontinuities; (4) Condition of
discontinuities; (5) Groundwater conditions; (6) Ori-
entation of discontinuities.
The final value obtained will classify the rock
mass through five classes, from a very good rock mass
(class I) to a very weak rock mass (class V).
Parameters describe the quality of intact rock
and the conditions of the discontinuities. Uniax-
ial compressive strength describes rock resistance.
Rock Quality Designation Index (RQD) estimates
rock mass quality from drill core logs. RQD is defined
as the percentage of intact core pieces longer than 10
CSEDU 2016 - 8th International Conference on Computer Supported Education
422
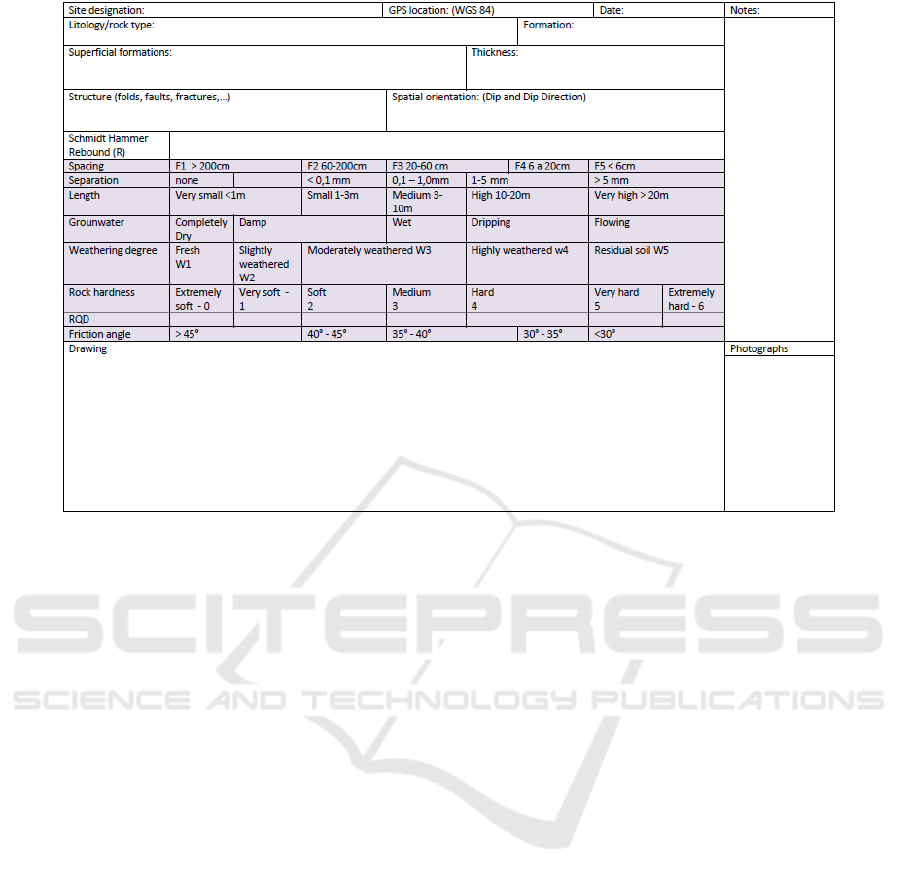
Figure 2: Table to record field data.
cm in the total length of core drilled. When no core
is available, RQD may be estimate, for instance, from
the number of discontinuities per unit volume of rock
mass (Palmstrøm, 1982). Spacing discontinuities de-
scribe the partitioning of the rock mass. Condition
of discontinuities defines the importance of weak sur-
faces. Groundwater conditions show if there can be
any water pressure on discontinuities. Orientation of
discontinuities can control slope stability.
2.1 Geological Data Collection and
Treatment
Different classification systems place different em-
phasis on the various parameters. Hence, at least two
classifications should be applied to obtain reasonable
results. As our focus is the learning strategies adopted
to familiarize students with data recording from the
field, from the teacher point of view it is adequate to
use only the RMR System.
The first approach is the observation of the rock
mass. This is divided into several structural regions
so that each group of students works on estimating
parameters for a defined region.
Based on RMR system parameters, a table was
built to record data from the field (Fig. 2). Students
have to identify the site, take its GPS location and cat-
egorize it on its geological environment. The use of
geological maps, a GPS equipment, or a suitable app
in a mobile device is required for determining loca-
tion. A draw from the rock mass and its environment
is convenient and photographs of all relevant aspects
should be taken. Hardness of intact rock can be cal-
culated either in situ, using a Schmidt Hammer, or by
bringing rock samples to the laboratory and testing
them with a uniaxial compression or point load com-
pression equipment. Discontinuities spacing, aper-
ture, and length are measured with a tape measure and
values written on the table. Discontinuities spatial ori-
entation (dip and dip direction) are read using a com-
pass with clinometer (Fig. 3). Groundwater, weath-
ering degree, and quick friction angle are determined
in the field by local observation and inscribed in the
table. Treated data will allow to archive RMR value
and classify the rock mass. Values from dip and dip
direction of fractures will be placed in stereographic
projection (Wulff net) allowing the identification of
the main planes of fracturing. The final report will use
all field information to recognise eventual geological
variability and conclude about rock mass quality.
When preparing future engineers to succeed in
solving problems in their professional life, the learn-
ing process should also include the use of adequate
technologies. Drawing, photographing, GPS locat-
ing, accessing digital maps, recording data and using
a compass can perfectly be done with a single com-
puter application accessible in a tablet. This solution
will help saving time, permit that difficulties emerged
on values management to be overcome (bad values or
Towards a Mobile Application for an Engineering Geology Course - A Contribution to Improved Student Learning
423
!
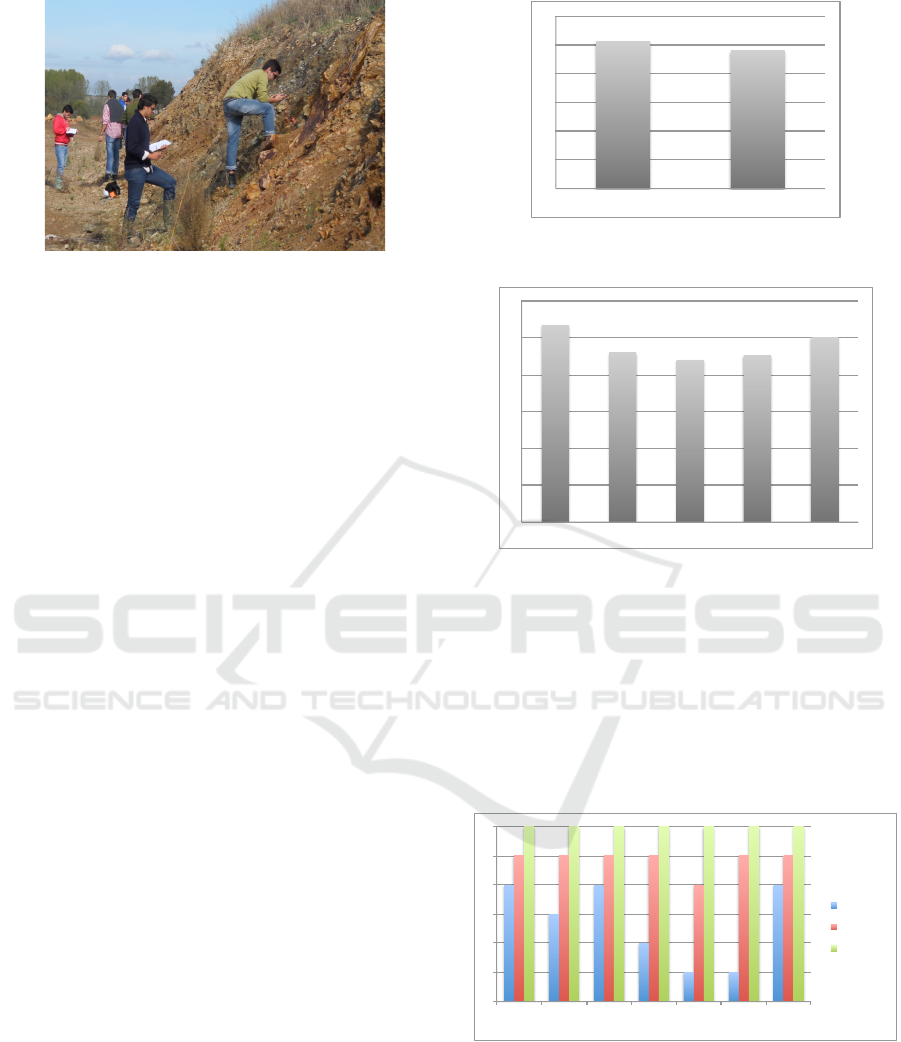
Figure 3: Students collecting field data.
errors due to poor handwriting for instance), and al-
low an easier data treatment. In the next section, we
present the results of a survey applied to a set of geo-
logical engineering students.
3 SURVEY
To access to students feedback about the use of a com-
puter application for rock mass assignment a ques-
tionnaire was applied. Within an universe of 21 stu-
dents, a total of 15 answers where received, 6 females
and 9 males, most with ages between 20 and 25 years.
The questionnaire included the following questions:
1. Rate the importance of the following between 1
(not important) and 6 (extremely important):
(a) Importance of a tablet based application for
data collection;
(b) Importance of another application for data
treatment;
(c) Store all data in digital format;
(d) Use the tablet to take photos, replacing the
photo camera;
(e) Use the tablet compass instead of the geological
compass;
(f) Use the tablet to draw instead of the paper note-
book;
(g) Use the tablet supported maps instead of the pa-
per topographic maps.
2. Specify other relevant data to be included in the
application.
The answers to the first two questions show that
students find the use of a mobile application for data
collection slightly more important than the use of a
new application for data treatment (Fig. 4). Usually
students use excel spreadsheet to treat data and after
a specific software to do stereographic projection.
Regarding specific functionalities, all the five
identified functionalities were considered very impor-
!"#$
%"&$
'$
#$
($
)$
%$
!$
*$
+,-,$./001.2/3$ +,-,$-41,-513-$
Figure 4: Average importance given to support data collec-
tion and data treatment.
5.3$
4.6$
4.4$
4.5$
5.0$
0$
1$
2$
3$
4$
5$
6$
Data$ Photos$ Compass$ Drawing$ Maps$
Figure 5: Average importance given to support for several
functionalities in the mobile application.
tant, with average values between 4.4 and 5.3 (Fig.
5).
Figure 6 illustrates the minimum, median, and
maximum values for the answers to each question. It
is interesting to notice that the use of the tablet as a
compass and for drawing are the only ones where a
respondent gave the lowest score (1 – not important).
!"
#"
$"
%"
&"
'"
("
)*+*"
,-../,0-1"
)*+*"
+2/*+3/1+"
)*+*" 45-+-6" 7-38*66" )2*9:1;" <*86"
<:1:3=3"
</>:*1"
<*?:3=3"
Figure 6: Minimum, median, and maximum values for each
question.
Regarding the open question about additional
data, the suggestions were the following:
• Support for Excel spreadsheet to register the data
related to the taken measures (directions, slopes,
and others) allowing they export to other applica-
tions (Dips, stereonet or other).
CSEDU 2016 - 8th International Conference on Computer Supported Education
424
• The application should automatically generate
data to be inserted in an Excel spreadsheet to be
latter treated in the laboratory and make a geo-
graphical projection with no need for manual edit-
ing.
• Insert data in digital format, allowing a faster and
more reliable data register
• It would be wonderful to be able to export the re-
trieved data to pdf, or other, for printing; these
data should include meteorological conditions and
access to the local.
• Possibility to draw in a vector based format.
• The application could have a table with all the cri-
teria to be assessed on the field for the classifica-
tion and characterisation of the rock . Besides the
field data, it could contain the formulas for data
treatment.
It is interesting to see that students find important
not only to have an application allowing them to insert
all data collected in the field, but also that the appli-
cations allow data treatment in other kinds of support.
Nevertheless, formulas and data treatment should be
done by the users/students as one of the courses learn-
ing strategies.
4 THE APP PROTOTYPE
Presently, an app for the Apple iOS system is be-
ing developed. For this project only field informa-
tion was considered; the strength of intact rock, one
of RMR parameters, was not taken into account be-
cause it results from laboratory determination. Based
on the data collected in the survey and the teaching
experience, the prototype includes support for the fol-
lowing:
• Store all field data in digital format;
• Take photos and record videos;
• Use the tablet compass;
• Use the tablet supported maps;
• Create several ”projects” each one with several
”sites”;
• Creation of a text file (comma separated val-
ues) readable in any spreadsheet program or other
more specific programs, thus allowing simple and
versatile data treatment.
All the data is collected for each site, which be-
longs to a single project. Hence, the user starts by
creating a new project with one site. The data is then
collected for this site, including photos. After, the
user can add more sites to the project to collect the
respective data or a new project with the respective
sites.
The app still lacks the possibility to draw and has
no formulas for data treatment, which was a student
suggestion.
Compared to other existing tools, e.g. (Ho et al.,
2012; Terrasolum, 2013; Midland Valley Exploration
Ltd, 2013), the tool being developed has two main
advantages:
1. It allows for the specification of a specific set of
geological data;
2. It offers an integrated support for the registration
of all types of data, namely, classifications, mea-
sures, photos, and geographic information.
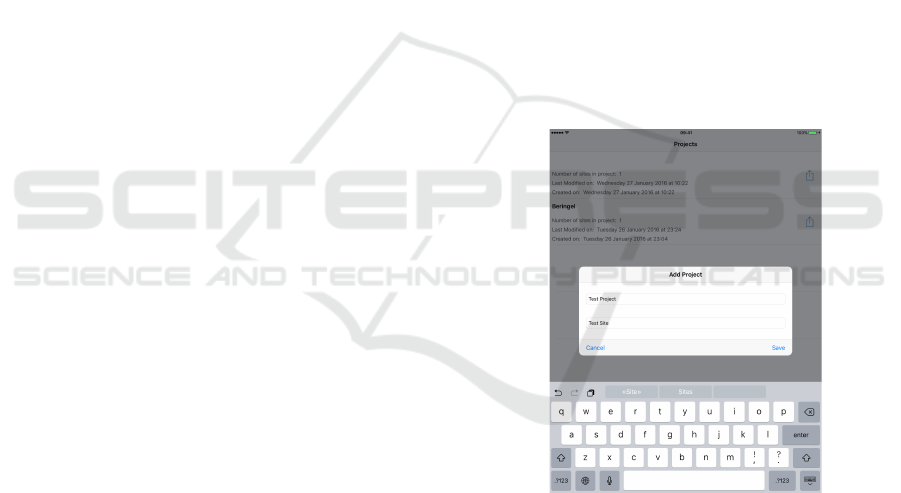
The first functional prototype already developed
will allow a preliminary evaluation of its user in-
terface and functionality. Figures 7, 8, 9, and 10
show the more important screens, respectively (1) the
project and site screens, (2) the data insertion screen,
(3) the clinometer and compass screen, and (4) the
photo and video screen.
Figure 7: Project screen.
The present tool assumes that the data can be col-
lected for each site in each project. This means that
each project can have one or more sites each one with
its own data, photos, and videos. Using a tablet com-
pass in a scientific context may be questionable due
to its usually bad accuracy. During the project de-
velopment process various readings were performed
with geologist’s compass to adjust the application’s
compass. Preliminary measures seem quite good but
future readings should be carried critically in order to
ascertain the accuracy.
Towards a Mobile Application for an Engineering Geology Course - A Contribution to Improved Student Learning
425
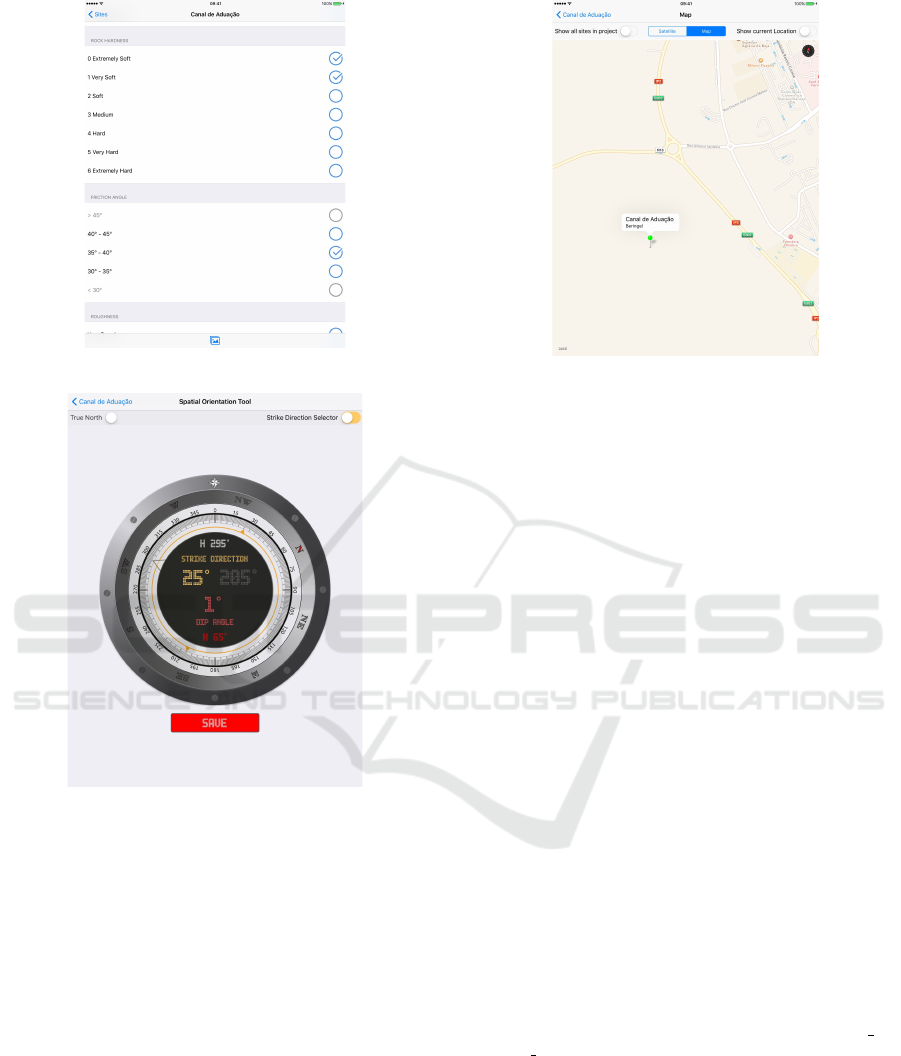
Figure 8: Data insertion screen.
Figure 9: The clinometer and compass screen.
5 CONCLUSIONS
It is a natural consequence of the increased sophisti-
cation of mobile devices that an increased number of
activities will be more efficiently performed ubiqui-
tously based on those devices. Hence, the learning
strategies must adapt while taking significant advan-
tage in terms of student efficiency, motivation, and
preparation for latter professional activities.
The related existing tools, e.g. (Ho et al., 2012;
Terrasolum, 2013; Midland Valley Exploration Ltd,
2013), the survey results, the anecdotal evidence col-
lected along several editions of engineering geology
courses taught by the third author, and preliminary
testing with a non-functional prototype, have clearly
demonstrated that mobile devices and applications
will have a pervasive and important role as tools for
Figure 10: The photo and video screen.
engineering geology students. Although the mobile
application is still in a prototype stage the authors are
already enthusiastic with the perspective of its use in
a very near future.
ACKNOWLEDGEMENTS
This work is partially supported by National
Funds through Portuguese Agency FCT – Fundac¸
˜
ao
para a Ci
ˆ
encia e a Tecnologia in the frame-
work of projects PEst-OE/EEI/UI0066/2011 and
UID/GEO/04035/2013.
REFERENCES
Bieniawski, Z. (1973). Engineering classification of jointed
rock masses. Transactions of the South African Insti-
tution of Civil Engineers, 15(12):335–344.
Bieniawski, Z. (1989). Engineering rock mass classifica-
tions. Wiley, New York.
Ho, A., Bekele, K., Malinconico, L., Sunderlin, D., wai
Liew, C., Rimal, P., Tillquist, C., and Hoang, K.
(2012). GeoFieldBook. The tool is available at the
iTunes Store. Accessed on 2014/01/12.
Hoek, E. (2006). Practical Rock Engineering. Available at
http://www.rocscience.com/hoek/corner/Practical Ro
ck Engineering.pdf, accessed on 2014/01/11.
Midland Valley Exploration Ltd (2013). FieldMove
Clino. Available at Google Play store. Accessed on
2014/01/12.
Palmstrøm, A. (1982). The volumetric joint count - a useful
and simple measure of the degree of rock mass joint-
ing. In Proceedings of the IV Congress International
Association of Engineering Geology, New Delhi.
Terrasolum (2013). RMR Calc. Available at Google Play
store. Accessed on 2014/01/12.
CSEDU 2016 - 8th International Conference on Computer Supported Education
426
