
A Wavelet-inspired Anomaly Detection Framework for Cloud Platforms
David O’Shea
1
, Vincent C. Emeakaroha
1
, John Pendlebury
1
, Neil Cafferkey
1
, John P. Morrison
1
and Theo Lynn
2
1
Irish Centre for Cloud Computing and Commerce, University College Cork, Cork, Ireland
2
Irish Centre for Cloud Computing and Commerce, Dublin City University, Dublin, Ireland
Keywords:
Anomaly Detection, Wavelet Transformation, Cloud Monitoring, Data Analysis, Cloud Computing.
Abstract:
Anomaly detection in Cloud service provisioning platforms is of significant importance, as the presence of
anomalies indicates a deviation from normal behaviour, and in turn places the reliability of the distributed
Cloud network into question. Existing solutions lack a multi-level approach to anomaly detection in Clouds.
This paper presents a wavelet-inspired anomaly detection framework for detecting anomalous behaviours
across Cloud layers. It records the evolution of multiple metrics and extracts a two-dimensional spectro-
gram representing a monitored system’s behaviour. Over two weeks of historical monitoring data were used
to train the system to identify healthy behaviour. Anomalies are then characterised as deviations from this
expected behaviour. The training technique as well as the pre-processing techniques are highly configurable.
Based on a Cloud service deployment use case scenario, the effectiveness of the framework was evaluated by
randomly injecting anomalies into the recorded metric data and performing comparison using the resulting
spectrograms.
1 INTRODUCTION
The increased abstraction of Cloud-based virtual ma-
chines when compared with on-site servers introduces
the danger of obscuring the expected performance of
these systems. It is therefore imperative that exten-
sive mechanisms be in place in the Cloud environ-
ment to detect anomalous events, as there is a need
for both administrators and users of Cloud resources
to be made aware of extraordinary conditions that
may indicate problems such as unauthorised access,
denial of service attacks, or hardware failure. How-
ever, detecting such anomalies requires overcoming
a number of challenges such as (i) The definition of
a normal region that contains all possible normal be-
haviours is difficult, as the boundaries between nor-
mal and anomalous behaviours are blurred; (ii) The
exact concept of an anomaly varies for different ap-
plication areas. For example, in the medical area,
a small deviation from normal might be an anomaly
(e.g. variation in heart measurements), while a similar
deviation in the stock market area can be considered
normal. Hence, applying a technique developed for
one area to another may not be appropriate; and (iii)
In many areas, including Clouds, normal behaviour is
continuously unfolding, and a current model of nor-
mal behaviour might not be fully representative of fu-
ture normal behaviour.
These challenges make the anomaly detection
problem, in general, difficult to address. Most of the
existing anomaly detection solutions tend to address
a particular fixed formulation of the problem (Chan-
dola et al., 2009; Hodge and Austin, 2004). A recent
review on anomaly detection in Clouds (Ibidunmoye
et al., 2015) has shown the lack of multi-level de-
tection techniques that can adequately address Cloud
challenges.
In this paper, we propose a novel anomaly de-
tection framework for detecting anomalies in the be-
haviour of services hosted on Cloud platforms. The
framework consists of a monitoring tool to super-
vise service execution on Cloud infrastructures, and
a wavelet-inspired anomaly detection technique for
analysing the monitoring data across Cloud layers
and reporting anomalous behaviours. Based on a
service-deployment use case scenario, the detection
technique is evaluated to demonstrate its efficiency.
The achieved results are compared against existing al-
gorithms to show the technique’s significance.
The rest of the paper is organised as follows:
Section 2 presents some background knowledge
on anomaly detection and discusses categories of
anomaly. In section 3, we analyse the related work
and differentiate our contributions to it. Section 4
106
O’Shea, D., Emeakaroha, V., Pendlebury, J., Cafferkey, N., Morrison, J. and Lynn, T.
A Wavelet-inspired Anomaly Detection Framework for Cloud Platforms.
In Proceedings of the 6th International Conference on Cloud Computing and Services Science (CLOSER 2016) - Volume 1, pages 106-117
ISBN: 978-989-758-182-3
Copyright
c
2016 by SCITEPRESS – Science and Technology Publications, Lda. All rights reserved

presents the proposed framework, focusing on the
monitoring and anomaly detection components, while
Section 5 describes its implementation details. In
Section 6, we present the evaluation of the framework
and Section 7 concludes the paper.
2 BACKGROUND
Anomaly detection (or outlier detection) is the iden-
tification of items, events or observations that do not
conform to an expected pattern or to other items in
a data set. In a regular and repeatable time series, a
profile of expected behaviour should be easily obtain-
able. In medicine, one such example is an electro-
cardiogram (ECG). This is used to classify a patient’s
heart activity. A medical doctor has been trained to
quickly identify anomalous ECGs, or indeed anoma-
lies in an ECG, by studying a large number of healthy
ECGs. An analogous health monitor would therefore
be desirable in other areas of science, including the
health of shared network resources and Cloud-based
(Gander et al., 2013; Doelitzscher et al., 2013) ser-
vices that are subject to demands that vary greatly and
experience periodic growth, seasonal behaviour and
random variations. Anomalous behaviour can be the
result of unprecedented user requirements, malicious
(hacking) activities, or can be symptomatic of issues
with the system itself. Before identifying the cause of
anomalous behaviour, one must first identify anoma-
lous behaviour by detecting a measurable deviation
from the expected behaviour.
2.1 Anomaly Categories
Based on existing research (Chandola et al., 2009),
anomalies can be grouped into the following cate-
gories:
1. Point Anomaly: This is a situation where an indi-
vidual data instance can be considered as anomalous
with respect to the rest of the data. It is seen as the
simplest form of anomaly and most of the existing
research on anomaly detection is focused on this cat-
egory (Chandola et al., 2009).
2. Contextual Anomaly: This represents a data in-
stance that is anomalous in a particular context. It
is also known as a conditional anomaly (Song et al.,
2007). The context is mostly derived from the struc-
ture in the data set and should be included in the prob-
lem formulation. Mostly, the choice to use a con-
textual anomaly detection technique depends on its
meaningfulness in the target application domain. For
example, where an ambient temperature measurement
would be at the lowest during the winter (e.g., −16
◦
C)
and peak during the summer (e.g., 38
◦
C), a tempera-
ture of 80
◦
C would be anomalous. However, 80
◦
C is
an acceptable value in a temperature profile of boiling
water. In this category, the availability of contextual
attributes is a key factor. In some cases, it is easy
to define context and therefore the use of a contextual
anomaly detection technique would be appropriate. In
some other cases, context definition and the applica-
tion of such techniques are challenging.
3. Collective Anomaly: This represents a situation
where a collection of related data instances is anoma-
lous with respect to the entire data set. The single data
instances in this collection may not be anomalous in-
dividually but when they occur together, they are con-
sidered anomalous. The following sequence of events
in a computer network provides an example:
. . . http-web, buffer-overflow, http-web, smtp-
mail, ssh, smtp-mail, http-web, ftp, smtp-mail, http-
web . . .
The occurrence of the above highlighted events to-
gether could signify an attack where the attacker
caused a buffer-overflow to corrupt the network, and
then remotely accessed the machines using SSH and
copied data through FTP. In this example, note that
each of these events could be normal but their cluster-
ing is anomalous.
3 RELATED WORK
Previously, extensive research has been done for
anomaly detection in large-scale distributed systems
such as Clouds (Ibidunmoye et al., 2015; Mi et al.,
2011a; Guan and Fu, 2013a; Guan and Fu, 2013b;
Reynolds et al., 2006). (Ibidunmoye et al., 2015)
present a review of the work done in performance
anomaly detection and bottleneck identification. They
describe the challenges in this area and the extent of
the contributed solutions. In addition, they pointed
out the lack of multi-level anomaly detection in
Clouds. (Mi et al., 2011b) present a hierarchical
software orientated approach to anomaly detection in
Cloud systems, tracing user requests through VMs,
components, modules and finally functions. The au-
thors attempt to identify those software modules that
are responsible for system degradation by identifying
those that are active during abnormal and normal be-
haviour of the system. For example, this approach
considers a module to be responsible for abnormal
system behaviour if its response latency exceeds the
required threshold. However, it does not consider a
module that finished quickly because of a software
A Wavelet-inspired Anomaly Detection Framework for Cloud Platforms
107

crash as contributing to system degradation.
Some current research in anomaly detection relies
on fixed-thresholds (Wang et al., 2011; Buzen and
Shum, 1995). In (Wang et al., 2011), particular men-
tion is made to the assumption of Gaussian distributed
data with defined thresholds. Unfortunately, this
places assumptions (and therefore limitations) on the
data being analysed if it must fit (or is assumed to fit)
a particular distribution. Typically, these thresholds
must be calculated completely a priori and therefore
require anomaly-free time-series data of the system.
MASF (Buzen and Shum, 1995) is one of the more
popular threshold-based techniques of use in indus-
try, where thresholds are defined over precise time-
intervals (hour-by-hour, day-by-day, etc.). (Lin et al.,
2015) firstly use a global locality-preserving projec-
tion algorithm for feature extraction, which combines
the advantages of PCA (Principal Component Analy-
sis) with LPP (Locality Preserving Projection). They
then use a LOF (Local Outlier Factor) based anomaly
detection algorithm on the feature data. LOF assigns
a factor to each data point that measures how anoma-
lous it is, and considers points whose factor exceeds
a certain threshold to be anomalies. As with (Wang
et al., 2010), the framework is evaluated using RU-
BiS with 50 injected anomalies, but achieves higher
accuracy when compared with an anomaly detection
known as EbAT. This increased accuracy is attributed
to the use of feature extraction pre-processing.
Statistical approaches have also been developed
in prior academic work (Bahl et al., 2007; Agar-
wala et al., 2007; Agarwal et al., 2013) to ex-
tend to multi-dimensional data as well as reducing
false positives. However, these methods often re-
quire knowledge of the time-series distribution or may
not adapt well to an evolving distribution. On the
other hand, probabilistic approaches, such as Markov
chains (Bakhtazad et al., 2000; Sha et al., 2015), can
produce excellent predictions of a system’s behaviour,
particularly if the system is periodic with random,
memory-less transition between states. The size of
the probability matrix will grow with the number of
defined Markov states, and this may present an is-
sue when extending to multi-metric analysis. How-
ever, all of these methods only rely on time-domain
information while more information exists in the fre-
quency domain. Considering the distributed nature of
Clouds, it is a prime target for sophisticated intrusion
attacks (Gul and Hussain, 2011) and therefore merits
the consideration of all information available.
Recent works (Wang et al., 2010; Liu et al., 2015;
Guan et al., 2013; Mi et al., 2011b) have begun to use
wavelet transforms (which utilise time and frequency
domain information) as part of their pre-processing
techniques to identify and characterise anomalies in
Cloud-based network systems. (Wang et al., 2010)
describe EbAT - an anomaly detection framework that
performs real-time wavelet-based analysis to detect
and predict anomalies in the behaviour of a utility
Cloud. Their system does not require prior knowledge
of normal behaviour characteristics, and is scalable to
exoscale infrastructure. Using the RUBiS benchmark
to simulate a typical website, it achieves 57.4% better
accuracy than threshold-based methods in detecting
uniformly distributed injected anomalies. It aggre-
gates metric data before analysis in order to achieve
better scalability. However, it does not consider multi-
level anomaly detection. (Guan et al., 2013) present
a wavelet-based anomaly detection mechanism that
exhibits 93.3% detection sensitivity and a 6.1% false
positive rate. The algorithm requires normal runtime
Cloud performance training data. However, it is not
indicated how transient anomalies in the training data
are identified to prevent False Negatives (FN). A sub-
set of metrics that optimally characterizes anomalies
is chosen. Metric space combination is then applied
to further reduce the metric space. It is unclear from
this approach what would occur if a metric that was
initially stable – and therefore excluded from the met-
rics under consideration – began to exhibit anomalous
behaviour. Once an anomaly is detected using this
method the metric responsible cannot be identified.
To the best of our knowledge, none of the exist-
ing solutions present a wavelet-inspired multi-level
anomaly detection technique that can detect and diag-
nose root causes of anomalies across Cloud resource
and application layers.
4 ANOMALY DETECTION
FRAMEWORK
This section describes the architecture of our pro-
posed anomaly detection framework, designed to
demonstrate a means of addressing the previously
identified challenges. The architecture is capable of
handling the service provisioning lifecycle in a Cloud
environment, which includes service scheduling, ap-
plication monitoring, anomaly detection and user no-
tification.
Figure 1 presents an abstract view of our archi-
tecture and its operations. Customers place their
service requests through a defined interface (Service
Deployment Interface), which acts as the front-end
in the Cloud environment. The received requests
are validated for format correctness before being for-
warded to the Provisioning Manager for further pro-
cessing. The provisioning manager includes a Load
CLOSER 2016 - 6th International Conference on Cloud Computing and Services Science
108
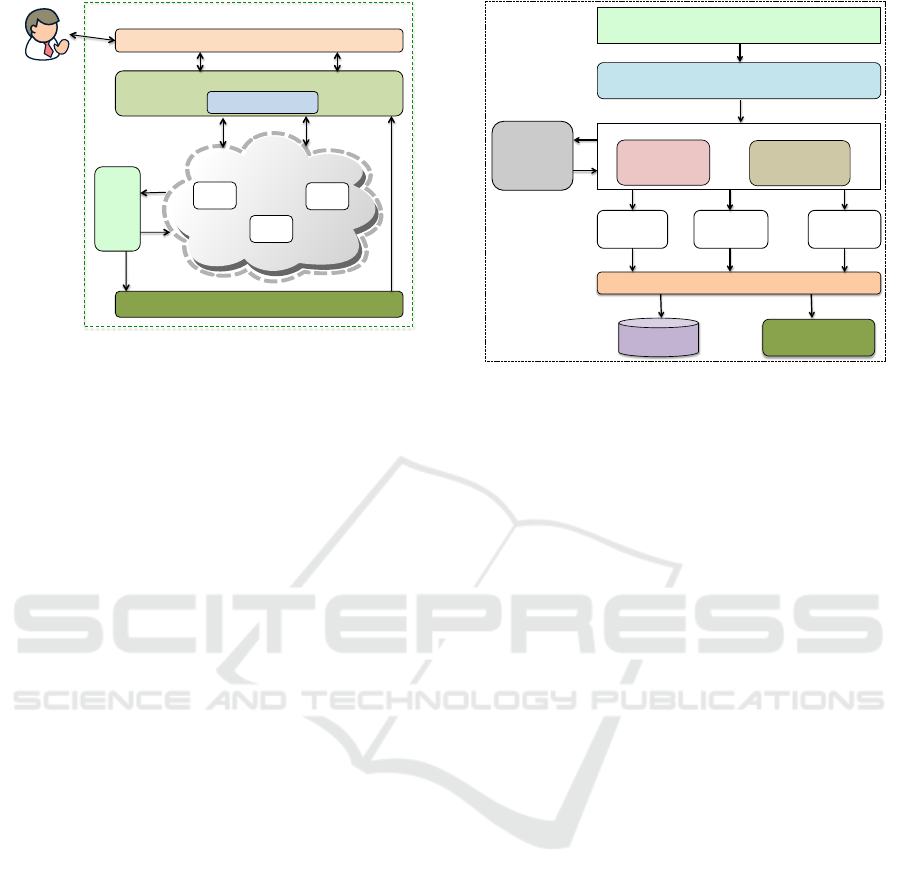
Provisioning Manager
Service
Monitor
Service Deployment Interface
Anomaly Detection / Analytic
Cloud Platform
Service
Customer
VM
App1
Load%Balancer%
VM
App1
VM
App1
Compute Resources
Figure 1: System Architecture.
Balancer that is responsible for equally distributing
the service/application deployment for optimal per-
formance. The applications are deployed on the Com-
pute Resources for execution. The Service Monitor
supervises the execution of the applications on the
compute resources. The resulting monitoring data are
forwarded to the Detection/Analytic component for
analysis. Any anomaly detection from the analysis
is communicated to the provisioning manager to take
appropriate action.
The proposed architecture is generic to support a
wide range of applications, varying from traditional
web services to parameter sweep and bag-of-task ap-
plications. In this paper, we detail the monitoring and
anomaly detection components.
4.1 Service Monitor Design
The service monitor comprises individual config-
urable monitoring tools in a decentralised fashion.
It is capable of monitoring Cloud resources and ap-
plications, which gives it an advantage over only
resource-monitoring tools such as LoM2HiS frame-
work (Emeakaroha et al., 2010; Emeakaroha et al.,
2012). At the application level, the service monitor
supports event-based monitoring of activities. Figure
2 presents an overview of the service monitor.
As shown in Figure 2, the service monitor has a
modular design. The configuration of the tools is done
through the Monitor Configuration Interface. It al-
lows the parameterisation of the individual monitor-
ing tools, for example to specify different monitoring
intervals.
The Input Processing API is responsible for gath-
ering the configurations from the previous component
and parsing them into a suitable format for the back-
end service monitor core engine to understand. The
Service Monitor Core instantiates the necessary mon-
Communica)on*Protocol*/*RESTful*API*
Input*Processing*API*
Monitor Configuration
Interface
Start Monitoring
Processes
Setup Execution
Engine
Service Monitor Core
App*1*
Monitoring*
App*2*
Monitoring*
App*3*
Monitoring*
Cloud*
Resources/*
Deployed*
Applica)ons*
DB*
Anomaly*Detec)on*
Figure 2: Service Monitor.
itoring tools with the proper configuration parameters
and supervises them while monitoring the deployed
Cloud services. The monitoring tools are executed in
parallel and each sends its monitored data using the
Communication Protocol into a database as well as to
the anomaly detection module.
In designing the service monitor, we strived to
make it non-intrusive, scalable, interoperable and ex-
tensible. These qualities have been associated with
efficient monitoring tools as described in a recent
monitoring survey (Fatema et al., 2014). The sepa-
ration of the service monitor components into mod-
ules makes it easily extensible with new functionali-
ties. To achieve non-intrusiveness, we host the mon-
itoring software on separate Cloud nodes to the ones
used to execute the customer services. However, we
deploy light-weight monitoring agents on the com-
pute node for gathering the monitoring data and send-
ing it back to the server. This helps to avoid re-
source contention between the monitoring server and
the deployed Cloud services that might degrade cus-
tomer service performance. In addition, this separa-
tion increases the scalability of the monitoring tool
since it facilitates the creation of clusters of moni-
toring agents with decentralised control servers. The
communication protocol uses a platform-neutral data
interchange format for formatting and serialising data
to achieve interoperability.
4.2 Anomaly Detection Algorithm
The anomaly detection algorithm is described in three
configurable stages. First, we consider the a-priori
training highlighted in Figure 3. The recorded multi-
metric data is read into memory. Optional pre-
processing techniques such as noise filtering, win-
dowing and regression algorithms (PCA or Linear
A Wavelet-inspired Anomaly Detection Framework for Cloud Platforms
109
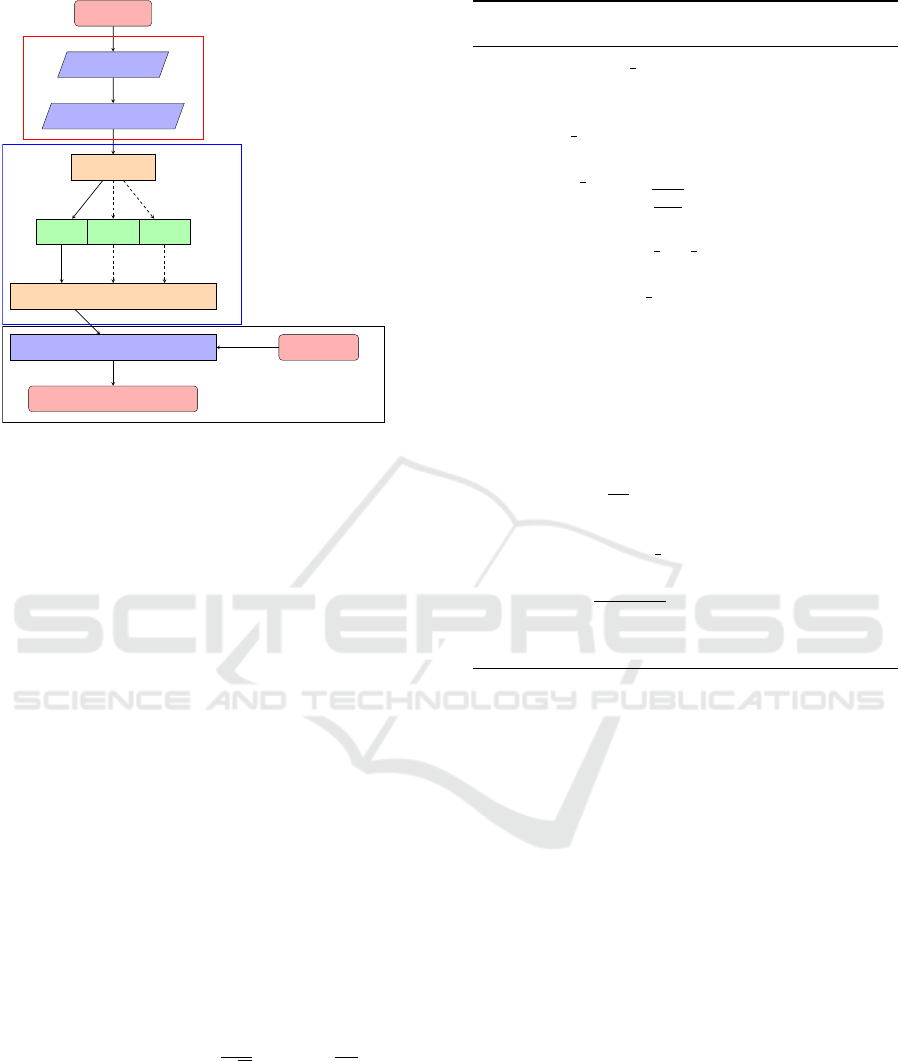
Read in data
Noise Filtering
and Window data
PCA or LDA
Wavelet Trans-
form (1D)
Welford
RPROP SOMS
Trained Wavelet
Transform
Compare with
Experimental Data
Experimental data
Output Data with Anomolies highlighted
Preprocess Data
Train Algotrithm
Results
Figure 3: Flow chart of Anomaly Detection Technique.
Discrepancy Analysis) can be added at this stage.
The second stage details the training by taking
the pre-processed data and performing the wavelet-
transform on each metric. The returned spectrogram
is then passed to a machine learning technique that
has a knowledge of the history of the Cloud system.
The newest spectrogram is used to update the run-
ning estimate of the mean and standard deviation of
an ideal performance. In this way, a profile of be-
haviour can be extracted, and a deviation from this
profile can be identified as an anomaly.
Thirdly, the trained spectrogram is then compared
to the spectrogram of the time trace that may contain
an anomaly. The anomaly comparison is outlined in
the pseudo code included in Algorithm 1. One ben-
efit of this multi-layer approach is that after having
inspected a given data sample for anomalies, the new
data can be easily used to extend the usefulness of
the trained model and tolerances for normal behaviour
can be updated.
The threshold scaling parameter m allows for a
specific tolerance to be set for each metric. The
wavelet transform is computed using Equation 1.
CW T
ψ
x
(τ, s) = Ψ
ψ
x
(τ, s) =
1
√
|s|
R
x(t)ψ
∗
(
t−τ
s
)dt (1)
The mother wavelet (ψ) is a windowing function
that scales (s is the scaling parameter) and translates
(τ is the translation parameter) the time trace (x(t)).
A two-dimensional spectrogram (of the complex co-
efficients) is generated from varying s and τ. As s
is increased, the time window becomes smaller. This
in turn effects the resolution of frequencies detected
Algorithm 1: Pseudo code for Wavelet Transform and
Welford training.
1: function Train data(timetraces,metric)
2: for day in timetraces do
3: SPEC =
wavelet trans f orm(metric, ∆t, ∆ω, . . . )
4: M
T
, S
T
=
Wel f ord 2D(M
T
, S
T
, SPEC, day)
return M
T
,
q
S
T
days
1: function Check f or anomaly(metric
A
,M
T
,
S
T
,m)
2: M
A
= wavelet trans f orm(metric
A
, ∆t, ∆ω, . . . )
3: if M
A
> (M
T
+ m ·|S
T
|) then
4: anomaly found
5: Record location to locs
6: else if M
A
< (M
T
−m ·|S
T
|) then
7: anomaly found
8: Record location to locs
9: else
10: no anomalies found
Ratio =
M
A
M
T
return Ratio, locs
1: function Wel f ord 2d(M,S,SPEC,day))
2: M
Temp
=M
3: M +=
(SPEC−M)
day
4: S += (SPEC −M
Temp
)(SPEC −M)
return M, S
in the time traces. The wavelet transform offers supe-
rior temporal resolution of the high frequency compo-
nents and scale (frequency) resolution of the low fre-
quency components. The values of s and τ range from
0 to the length of the time trace undergoing trans-
formation. The exact configuration of the anomaly
detection algorithm is introduced in a broad-minded
senses to that it can be further optimised without ma-
jor restructuring.
5 IMPLEMENTATION DETAILS
This section describes the implementation of the pro-
posed anomaly detection framework. Our focus is on
the monitoring and anomaly detection components.
5.1 Service Monitor Implementation
The monitor configuration interface was realised us-
ing Ruby on Rails technology, which enabled rapid
development and facilitates its compatibility with
other components. A key feature of Ruby on Rails
is its support for modularity. We used this feature
CLOSER 2016 - 6th International Conference on Cloud Computing and Services Science
110

to make it easily extendible with new functionality.
Ruby on Rails also has a rich collection of open
source libraries. Based on this, we used the JSON li-
brary to aggregate the input configuration data before
transferring them down to the next component.
The input processing API component is imple-
mented as a RESTful service in Java. Since Ruby
on Rails supports RESTful design, it integrates seam-
lessly with this component in passing down the input
data. The input processing API extracts these data
and makes them available to the service monitor core
component.
The service monitor core component sets up and
manages the execution of user selected and config-
ured monitoring tools. We use multi-threading to
achieve parallel execution of the monitoring tools
since they developed as individual applications.
Each monitoring tool incorporates communica-
tion protocols for transferring the monitored data
to other components. The communication proto-
cols comprise a messaging bus based on RabbitMQ
(Videla and Williams, 2012), HTTP and RESTful ser-
vices. This combination achieves interoperability be-
tween platforms. We use a MySQL database to store
the monitoring data. Hibernate is used to realise the
interaction between the Java classes and the database.
With Hibernate, it is easy to exchange database tech-
nologies. Thus, the MySQL database could be easily
exchanged for another database platform.
5.2 Anomaly Detection Algorithm
Implementation
The wavelet transform is implemented using the con-
tinuous wavelet transform from the mlpy library (Al-
banese et al., 2012). It allowed rapid calculation of
spectrograms with a plethora of mother wavelets to
choose from. The mother wavelet form utilised in this
section is the Morlet waveform, but other waveforms
can be easily substituted.
The wavelet transform is usually implemented
as part of a larger routine that includes some pre-
processing (Bakhtazad et al., 2000; Penn, 2005) and
is often trained using an advanced neural network
(ANN) such as RPROP (Resilient BackPRoPagation)
or SOMS (Zhang et al., 2013). The routine employed
here for the machine learning based on the wavelet
transform is outlined in Figure 3.
In Figure 3, the solid black arrow indicates the
elements of the routine currently available. The
dashed black arrows indicate features still in develop-
ment. In its present form, the Wavelet Transform ap-
proach permits a 1-dimensional, serial anomaly iden-
tifier using the Welford Algorithm (Welford, 1962)
for training. The use of additional ANNs after
the Welford Algorithm would allow for the exten-
sion to n-dimensions, and possibly the identifica-
tion or correlation of anomalies between metrics.
The Welford Algorithm is a single-pass function and
therefore potentially requires a larger number of train-
ing data sets than multi-pass algorithms. Seasonal
(weekly/monthly/yearly) trends could potentially be
identified in this manner; however, the Welford Algo-
rithm considers all time traces equally and therefore
may be slow to forget past behaviour that is no longer
healthy (or normal) behaviour.
6 EVALUATION
The goal of our evaluation is to demonstrate the effi-
cacy of the proposed framework to monitor Cloud ser-
vice execution, analyse the monitoring data and detect
anomalous behaviours. It is based on a use case sce-
nario that describes the service interactions. First, we
present the evaluation environment setup and the use
case descriptions.
6.1 Experiment Environment Setup
To set up the experimental environment, an Open-
Stack Cloud platform installation running Ubuntu
Linux was used. The basic hardware and virtual ma-
chine configurations of our OpenStack platform are
shown in Table 1. We use the Kernel-based Virtual
Machine (KVM) hypervisor for hosting the virtual
machines.
Table 1: Cloud Environment Hardware.
Machine Type = Physical Machine
OS CPU Cores Memory Storage
OpenStack Intel Xeon 2.4 GHz 8 12 GB 1 TB
Machine Type = Virtual Machine
OS CPU Cores Memory Storage
Linux/Ubuntu Intel Xeon 2.4 GHz 1 2048 MB 50 GB
As shown in Table 1, the physical machine re-
sources are capable of supporting on-demand start-
ing of multiple virtual machines for hosting different
Cloud services.
6.2 Use Case Scenario
This use case scenario describes a Cloud service
deployment, the monitoring of the service and the
analysis of the monitoring data to detect anoma-
lous behaviours. To realise this, we set up Apache
A Wavelet-inspired Anomaly Detection Framework for Cloud Platforms
111

Web Servers with back-end MySQL databases on
our OpenStack platform as the demonstrator Cloud
service. On the web servers, we deploy a transac-
tional video-serving web application that responds to
requests and makes queries to back-end databases.
Video data were uploaded to the web servers that
could be rendered on request. The service is designed
to receive and process different queries and workloads
generated by users.
In the evaluation, we simulate user behaviours in
terms of generating queries and placing them to the
Cloud service using Apache JMeter (Apache Soft-
ware Foundation, 2016). The workload consists of
three HTTP queries and two video rendering requests.
The first HTTP query request is for a particular prod-
uct ID from the web application deployed as our
demonstrator service. The web application queries
the back-end database for this ID and provides a re-
sponse. The second HTTP query places an authen-
tication request to the web application using differ-
ent accounts and the third queries the availability of
a product. With these queries, we generate approx-
imately 15 requests per second, representing light to
moderate load on a real-world service. The video re-
quests invoke playback of music video data on the
web servers. We generate five requests per second for
two videos in a mixed sequence.
The execution of this service on the web servers
was monitored using the service monitor described in
Section 4.1. The application-level monitor is event-
based. Therefore, it can continuously monitor the
performance of each request/query placed to the web
application. We monitor 74 metrics (such as Bytes-
Received, ByteSent, ResponseTime, CPUUserLevel,
CPUIdle, FreeDisk, FreeMemory etc.) from this ser-
vice deployment.
For this evaluation, we gathered 17 days’ worth of
data from this service execution monitoring. Since the
workload is simulated, the load distribution on each
particular machine was repeated each day, therefore
the recorded metrics should vary in similar ways each
day. No seasonal or periodic effect of the environment
on the machines should have occurred; therefore the
metric distribution should be normal apart from the
presence of small amount of small random noise.
Due to the velocity, volume, and real-time nature
of Cloud data, it is difficult to obtain time-series data
with true labelled anomalies. To address this issue
in our evaluations we injected anomalies in a ran-
domised fashion into single day’s data (post training).
This injected data is then compared against the trained
model. To avoid bias, the research team was split into
an anomaly injection team and an evaluation team.
The exact date, location and size of the anomalies
were unknown to the evaluation team. The anoma-
lies injected were chosen to reflect the various types
described in Section 2.1, such as point and contextual
anomalies. Our aim here is to identify all anomalies
utilising a single technique. We thus use the modified
monitoring data to evaluate the efficacy of our pro-
posed detection technique.
6.3 Data Analysis and Results
The following sections discuss individual results of
the anomaly detection routine and characterise the re-
sults as i) True positives and ii) False positives.
Based on the wavelet algorithm, we generate a
separate spectrogram for each day of data. Given
that the system load is approximately similar from
one day to the next, a typical presence (or absence)
of frequency-time events can be detected through the
comparison of the individual spectrograms.
To determine if any anomalies are present in a
spectrogram under consideration, two simple tests
are performed. Firstly, having calculated the two-
dimensional mean and standard deviation of a trained
spectrogram, one can check if a point in the new
spectrogram lies within an allowable tolerance of the
trained system. This tolerance is defined as:
M
Trained
−m ·S
Trained
< M
New
< M
Trained
+ m ·S
Trained
(2)
where M and S are the moduli of the complex
mean and standard deviations of the spectrograms. m
is a scaling quantity that allows for the adjustment of
the number (or fraction) of standard deviations per-
mitted. Secondly, the ratio of
M
New
M
Trained
is also compared
with the relative magnitudes of the spectrograms.
Each metric in the spectrogram has a different
dynamic range and distribution; therefore a different
threshold for its abnormality is applied. This thresh-
old represents the allowable tolerance as described in
Equation 2. This however, places a limitation on the
relative size of anomalies that can be detected. Due
to space limitations, we discuss the results of a few
metrics to prove our concept.
6.4 True Positives
FREEDISK. Figure 4 depicts the achieved results
of the FREEDISK metric analysis from eight ac-
tive web servers’ monitoring data. The m parameter
(based on Equation 2) for FREEDISK in this case is
chosen to be 0.1 for all servers. A single m is utilised
so as to simplify comparison between machines. This
means that if a particular VMID usually has quite a
CLOSER 2016 - 6th International Conference on Cloud Computing and Services Science
112
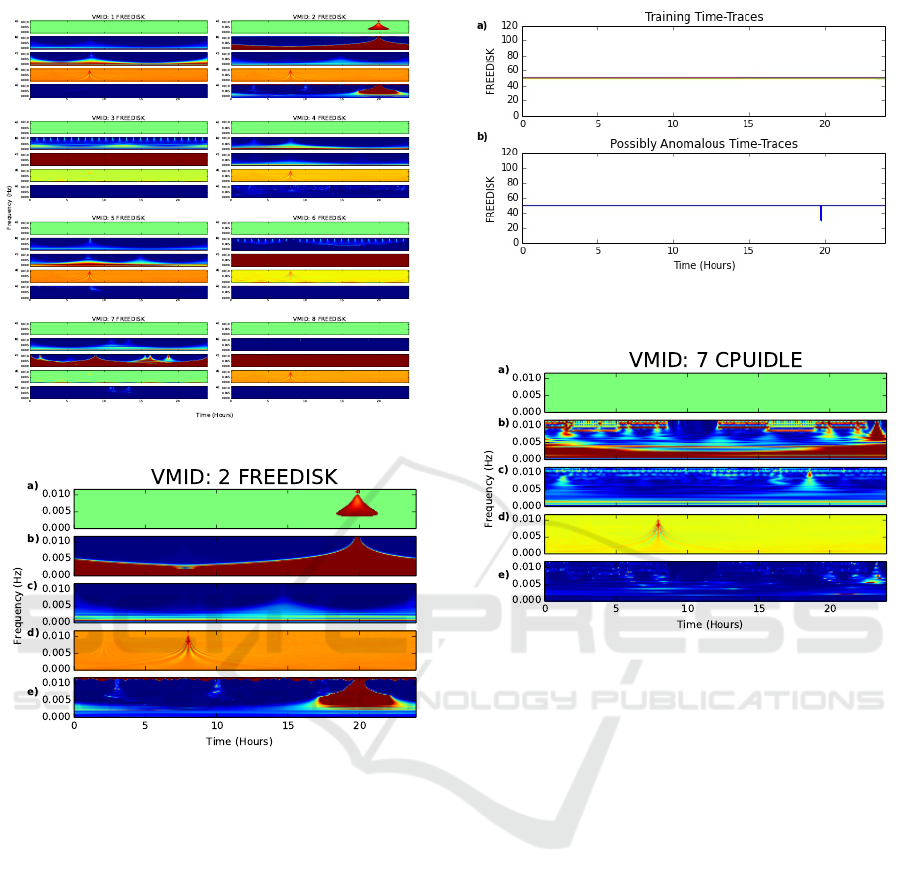
Figure 4: FREEDISK Analysis of Eight Web Servers.
Figure 5: Anomaly Detection for FREEDISK Metric.
dynamic spectrogram, a larger m is required to appre-
ciate its variation. In the case of FREEDISK, gen-
erally the spectrogram was unchanged; therefore a
small m of 0.1 is chosen. Applying this scale value
found anomalies in a virtual machines (with ID 2)
hosting one of the web servers in our OpenStack en-
vironment. Each individual VMID can have different
loads and configuration; therefore each could ideally
have a unique and optimal m value per metric.
The grid view clearly shows the absence of
anomalies in the virtual machines except the one with
ID 2. We present the detected anomalies of this VM
in a larger graphic (Figure 5) for easier understanding.
Figures 5(a) to (e) indicate a frequency anomaly
at the same point in time (near 20 hours), suggest-
ing that the absolute and relative sizes of the wavelet-
transform coefficients are considerably abnormal.
To validate the frequency anomaly detection, we
compare the time traces of the data used to train the
system and the one under investigation. Figure 6(a)
Figure 6: Comparison of a) Training Time Traces and b)
Real Data Time Traces for FREEDISK Metric.
Figure 7: Anomaly Detection for CPUIDLE Metric.
shows the training time traces and Figure 6(b) shows
the time traces of the data under investigation. It can
be observed that at approximately 20 hours, a strong
deviation from the expected behaviour is seen in the
analysed data. This corresponds to the frequency de-
tected anomalies shown in Figure 5.
CPUIDLE. Given that the CPUIDLE metric, under
load, is dynamic in behaviour, a larger m is required.
For this metric, m = 5 was chosen for all the virtual
machines. This value was large enough that minimal
noise (single pixels in the spectrogram) were flagged
as anomalous but also allowed the detection of strong
deviations from expected behaviour.
Applying this scale to the analysis, we detected
anomalies in the VM with ID 7 as shown in Figure 7.
This means that the ratio of wavelet-transform coef-
ficients (of the trained-data to the new data) is quite
large. This is represented as the light blue triangular
region near 23 hours in Figure 7(e). An inspection
of Figure 7(b) and (c) shows an additional frequency-
time event occurring near 23 hours in Figure 7(b) that
is not present in Figure 7(c). Figure 7(a) shows an ab-
normal cluster of yellow points at the same point in
time; however, it occurs at the limit of our frequency
A Wavelet-inspired Anomaly Detection Framework for Cloud Platforms
113
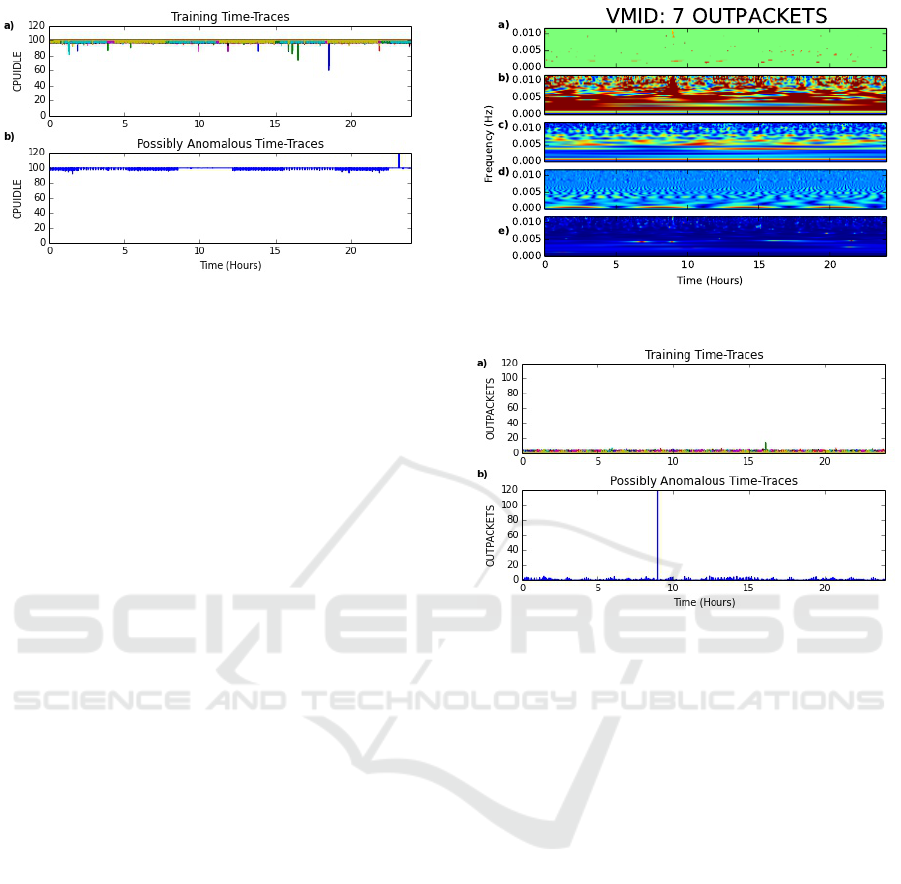
Figure 8: Comparison of a) Training Time Traces and b)
Real Data Time Traces for CPUIDLE Metric.
range. There are also small clusters (akin to noise) at
other times within this spectrogram. To confirm the
anomaly, we must consider the time series used (as
depicted in Figure 8).
Figure 8 shows the training and real data time
traces for this analysis. As can be observed in Fig-
ure 8(b), at the time near 23 hours, an unusual (and
physically impossible) value of the CPUIDLE met-
ric is reported: 120%. This corresponds to the point
anomaly that was detected in Figure 7.
OUTPACKETS. Unlike the previous two metrics
examined, the transition between values of the OUT-
PACKETS metric does not vary smoothly. As a con-
sequence, the frequency information will look more
like noise (a randomly varying signal) than other met-
rics. This means that non-noise anomalies will stand
out strongly, but may not distinguish between anoma-
lies following a different (random) distribution.
We choose m = 5 for the analysis of this metric
across the VMs as with the CPUIDLE, again individ-
ual VMIDs can have tailored thresholds but in this
case a constant m allows for an easy comparison. A
cluster of anomalous points was detected near 8 hours
in the VM with ID 7 as shown in Figure 9(a). The
anomalies were also detected in Figure 9(e) but is not
as clear in (a). An examination of the time series in
Figure 10 shows that an anomaly has indeed been cor-
rectly detected at this point. The smaller points on
Figure 9(a) are noise due to the irregular transition
of the metric values as explained previously. Fourier
transforms and wavelet transforms work well with
smoothly varying functions. In the cases here, the
discontinuity between the integer data points requires
many frequency components to reproduce the jumps
in the frequency domain. This is a possible source
of the smaller anomalous points and is troublesome,
as unlike in the CPUIDLE and FREEDISK metrics
where the anomalies appeared more clearly than the
noise, here the anomaly cluster in Figure 9(a) seems
Figure 9: Anomaly Detection for OUTPACKET Metric.
Figure 10: Comparison of a) Training Time Traces and b)
Real Data Time Traces for OUTPACKETS Metric.
to be of the same size as the noisy points.
6.5 False Positives
In this section, we discuss the detected false positives
and take the CPUIDLE metric as an example.
Figure 11 depicts the results of the falsely detected
anomalies for CPUIDLE. The same threshold as pre-
viously used (m = 5.0 ) was applied. Figure 11(a)
shows that, according to the absolute value of the
spectrogram, anomalous points are seen between 6
and 12 hours (they appear as thick horizontal clus-
ters). Figure 11(e) does not show corresponding lines
using a relative measurement of the spectrograms but
does highlight points in the same region. Considering
both methods flag anomalies in these regions (but do
not agree if they are single point anomalies or not),
the time traces should be investigated.
In Figure 12(a), the time traces are shown to fol-
low a general trend and remain between 15% and 80%
CPUIDLE. On first inspection, Figure 12(b) appears
to be quite similar to some of the time traces used in
the training and does not have any obvious anoma-
lies. Even the local minimum value near 8 hours is
repeated in several of the training days but this is also
CLOSER 2016 - 6th International Conference on Cloud Computing and Services Science
114
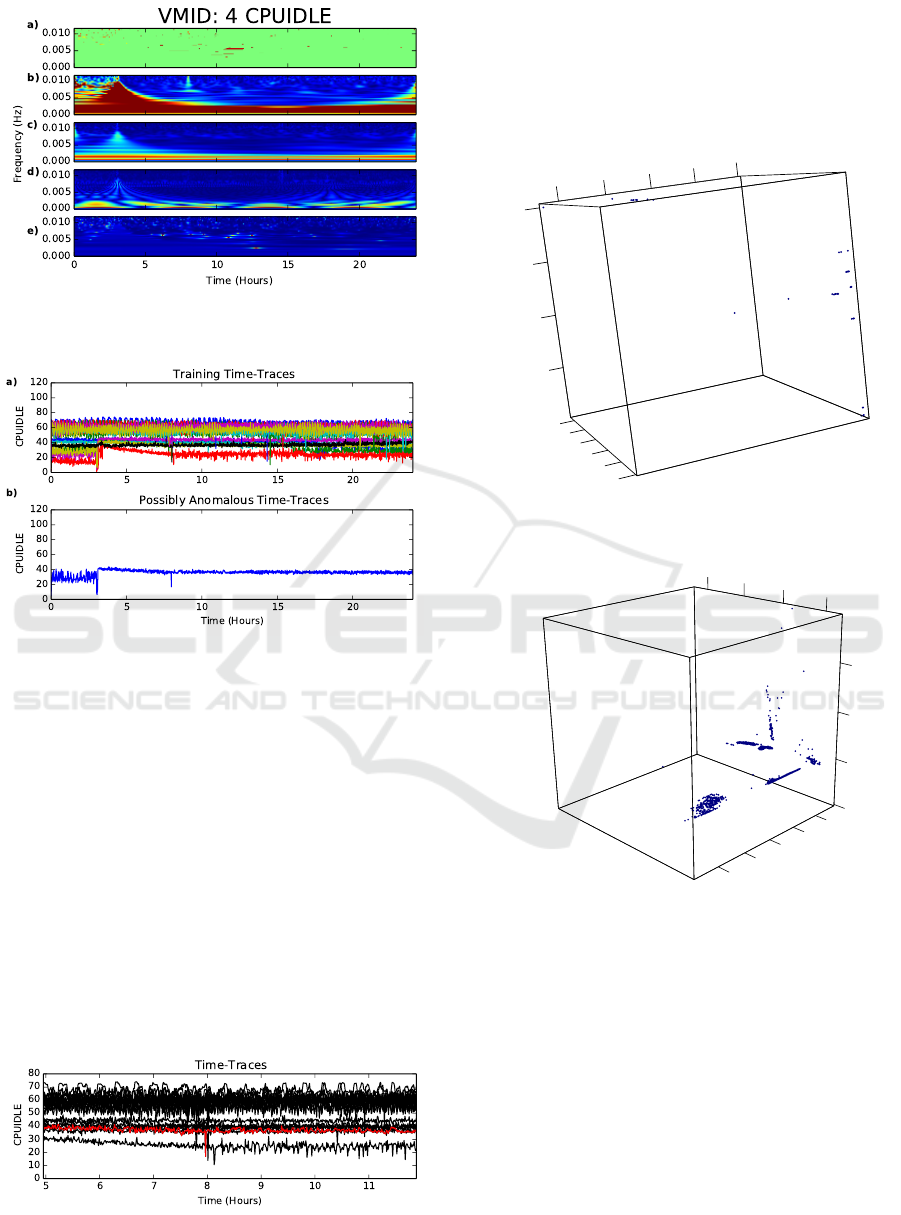
Figure 11: False Positive Anomaly Detection of CPUIDLE
Metric.
Figure 12: Comparison of a) Training Time Traces and b)
Real Data Time Traces for CPUIDLE Metric.
shown to not occur at exactly the same time each day.
In Figure 13, an enlarged view of Figure 12 is pro-
vided with the anomalous time trace in red and the
training time traces are presented in black. An expla-
nation for the false positives is beginning to emerge.
At this point, it is seen that the time that was flagged
as anomalous, between 6 and 12 hours sometimes
achieves values (30 −40% CPUIDLE) that were not
previously visited by the system in the 17 days his-
tory. These excursions are short lived otherwise this
time trace follows closely the model. It is shown that
the time traces are quite clustered with definite gaps
of CPUIDLE values achieved. As the system evolves
and gains longer training history, it is possible to pre-
vent these excursions as being flagged anomalous.
Figure 13: CPUIDLE Time Trace Over Lap: Training Time
Traces (Black) and Anomalous Time Trace (Red).
6.6 Principal Component Analysis
In this section, we present comparisons between the
results of the wavelet inspired method and a pure sta-
tistical approach to show the former’s significance.
0
OUTPACKETS
2000
4000
6000
8000
1e+04
CPUIDLE
20
40
60
80
FREEDISK
20
40
60
80
100
Figure 14: 3D R Plot of Metrics: FREEDISK, CPUIDLE
and OUTPACKETS.
PC1
PC3
-8
-6
-4
-2
0
-20
PC2
0
20
40
-15
-10
-5
0
Figure 15: 3D Plot of PCA Not Normally Distributed Data.
Figure 14 presents a 3D plot of the three anal-
ysed example metrics. The data is very tightly clus-
tered and does not appear to fit any obvious distribu-
tion. While the data is clearly non-normal, a Princi-
pal Component Analysis (PCA) or Linear Discrimi-
nant Analysis (LDA) may still be useful in reducing
the dimensionality of the system regardless of the dis-
tribution. Figure 15 contains the results of the PCA
of 10 linearly independent metrics. The axes (PC1,
PC2 and PC3) are the three most significant vectors
demonstrating the extent of the non-normality of the
data. Taking a confidence interval of 99% yielded
many anomalies. This is as expected, as a purely
statistical approach will, by construction, always dis-
A Wavelet-inspired Anomaly Detection Framework for Cloud Platforms
115

cover anomalous points regardless of whether the
points are in fact anomalous or not. Furthermore, the
number of outliers will be determined by the confi-
dence interval selected. The interesting thing is that
this approach failed to detect some of the injected
anomalies in the gathered data. This demonstrates an
advantage of the wavelet method over a pure statisti-
cal approach.
7 CONCLUSION
This paper presented an anomaly detection frame-
work for detecting anomalous behaviour of services
hosted on Cloud platforms. It contains a moni-
toring tool to monitor service executions in Clouds
and gather monitoring data for analysis. A wavelet-
inspired detection algorithm was implemented to pro-
vide a multi-level analysis of the monitoring data for
anomaly detection. It uses frequency domain and
time domain information to estimate an anomaly-free
spectrogram. The healthy spectrogram is trained (re-
moves seasonality and noise/randomness) by using an
extended two-dimensional Welford algorithm to cre-
ate two-dimensional mean and standard deviations.
These quantities are then used to check for the pres-
ence of anomalies by comparing the trained mean and
standard deviation with those of the new data.
The framework was evaluated based on a Cloud
service deployment use case scenario in an Open-
Stack evaluation testbed. We used 17 days of gath-
ered monitoring data from the service execution from
which a day data were randomly injected with anoma-
lies for the evaluation. The wavelet inspired method
successfully detected the injected anomalies, and a
brief comparison was made with a pure statistical ap-
proach, highlighting the advantages of our technique.
In the future, we aim to progress this work to near-
real time implementation where the anomaly detec-
tion will be carried out on the monitoring data at run-
time. The effect of moving to real time will mean the
introduction of a time-window, which will be continu-
ously updated as the monitoring platform reports up-
dated metric values. Also, moving to real-time will
distribute the computational workload as each time
the metrics are updated, the spectrogram will be ap-
pended to and not entirely recalculated. Further ex-
tensions to this work will permit the comparison of
multiple ANNs across multiple (and individual) met-
rics, which would allow for cross-metric comparison
while retaining the ability of identifying the metric(s)
containing the anomaly. This will allow for the detec-
tion of more complex anomalies in Cloud platforms.
ACKNOWLEDGEMENTS
The research work described in this paper was sup-
ported by the Irish Centre for Cloud Computing
and Commerce, an Irish national Technology Centre
funded by Enterprise Ireland and the Irish Industrial
Development Authority.
REFERENCES
Agarwal, S., Mozafari, B., Panda, A., Milner, H., Mad-
den, S., and Stoica, I. (2013). Blinkdb: queries with
bounded errors and bounded response times on very
large data. In Proceedings of the 8th ACM Euro-
pean Conference on Computer Systems, pages 29–42.
ACM.
Agarwala, S., Alegre, F., Schwan, K., and Mehalingham, J.
(2007). E2eprof: Automated end-to-end performance
management for enterprise systems. In Dependable
Systems and Networks, 2007. DSN ’07. 37th Annual
IEEE/IFIP International Conference on, pages 749–
758.
Albanese, D., Visintainer, R., Merler, S., Riccadonna, S.,
Jurman, G., and Furlanello, C. (2012). mlpy: Ma-
chine learning python. http://mlpy.sourceforge.net/
Accessed on 22/02/2016.
Apache Software Foundation (2016). Apache JMeter.
http://jmeter.apache.org/ Accessed on 06/01/2016.
Bahl, P., Chandra, R., Greenberg, A., Kandula, S., Maltz,
D., and Zhang, M. (2007). Towards highly reliable en-
terprise network services via inference of multi-level
dependencies. In SIGCOMM. Association for Com-
puting Machinery, Inc.
Bakhtazad, A., Palazoglu, A., and Romagnoli, J. (2000).
Detection and classification of abnormal process situ-
ations using multidimensional wavelet domain hidden
Markov trees. Computers & Chemical Engineering,
24(2):769–775.
Buzen, J. P. and Shum, A. W. (1995). Masf-multivariate
adaptive statistical filtering. In Int. CMG Conference,
pages 1–10.
Chandola, V., Banerjee, A., and Kumar, V. (2009).
Anomaly detection: A survey. ACM Comput. Surv.,
41(3):15:1–15:58.
Doelitzscher, F., Knahl, M., Reich, C., and Clarke, N.
(2013). Anomaly detection in IaaS clouds. In
Cloud Computing Technology and Science (Cloud-
Com), 2013 IEEE 5th International Conference on,
pages 387–394.
Emeakaroha, V. C., Brandic, I., Maurer, M., and Dustdar, S.
(2010). Low level metrics to high level slas - lom2his
framework: Bridging the gap between monitored met-
rics and sla parameters in cloud environments. In 2010
International Conference on High Performance Com-
puting and Simulation (HPCS), pages 48 –54.
Emeakaroha, V. C., Netto, M. A. S., Calheiros, R. N.,
Brandic, I., Buyya, R., and De Rose, C. A. F.
(2012). Towards autonomic detection of sla violations
CLOSER 2016 - 6th International Conference on Cloud Computing and Services Science
116

in cloud infrastructures. Future Gener. Comput. Syst.,
28(7):1017–1029.
Fatema, K., Emeakaroha, V. C., Healy, P. D., Morrison, J. P.,
and Lynn, T. (2014). A survey of cloud monitoring
tools: Taxanomy, capabilities and objectives. Jour-
nal of Parallel and Distributed Computing, 74:2918–
2933.
Gander, M., Felderer, M., Katt, B., Tolbaru, A., Breu, R.,
and Moschitti, A. (2013). Anomaly detection in the
cloud: Detecting security incidents via machine learn-
ing. In Trustworthy Eternal Systems via Evolving Soft-
ware, Data and Knowledge, pages 103–116. Springer.
Guan, Q. and Fu, S. (2013a). Adaptive anomaly identi-
fication by exploring metric subspace in cloud com-
puting infrastructures. In Reliable Distributed Sys-
tems (SRDS), 2013 IEEE 32nd International Sympo-
sium on, pages 205–214.
Guan, Q. and Fu, S. (2013b). Wavelet-based multi-scale
anomaly identification in cloud computing systems. In
Global Communications Conference (GLOBECOM),
2013 IEEE, pages 1379–1384.
Guan, Q., Fu, S., DeBardeleben, N., and Blanchard,
S. (2013). Exploring time and frequency domains
for accurate and automated anomaly detection in
cloud computing systems. In Dependable Computing
(PRDC), 2013 IEEE 19th Pacific Rim International
Symposium on, pages 196–205. IEEE.
Gul, I. and Hussain, M. (2011). Distributed cloud intrusion
detection model. International Journal of Advanced
Science and Technology, 34:71–82.
Hodge, V. J. and Austin, J. (2004). A survey of outlier de-
tection methodologies. Artificial Intelligence Review,
22(2):85–126.
Ibidunmoye, O., Hern
´
andez-Rodriguez, F., and Elmroth, E.
(2015). Performance anomaly detection and bottle-
neck identification. ACM Comput. Surv., 48(1):4:1–
4:35.
Lin, M., Yao, Z., Gao, F., and Li, Y. (2015). Toward
anomaly detection in iaas cloud computing platforms.
International Journal of Security and Its Applications,
9(12):175 – 188.
Liu, A., Chen, J. X., and Wechsler, H. (2015). Real-time
timing channel detection in an software-defined net-
working virtual environment. Intelligent Information
Management, 7(06):283.
Mi, H., Wang, H., Yin, G., Cai, H., Zhou, Q., Sun, T.,
and Zhou, Y. (2011a). Magnifier: Online detection of
performance problems in large-scale cloud computing
systems. In Services Computing (SCC), 2011 IEEE
International Conference on, pages 418–425.
Mi, H., Wang, H., Yin, G., Cai, H., Zhou, Q., Sun, T.,
and Zhou, Y. (2011b). Magnifier: Online detection of
performance problems in large-scale cloud computing
systems. In Services Computing (SCC), 2011 IEEE
International Conference on, pages 418–425.
Penn, B. S. (2005). Using self-organizing maps to visual-
ize high-dimensional data. Computers & Geosciences,
31(5):531 – 544.
Reynolds, P., Killian, C., Wiener, J. L., Mogul, J. C., Shah,
M. A., and Vahdat, A. (2006). Pip: Detecting the
unexpected in distributed systems. In Proceedings of
the 3rd Conference on Networked Systems Design &
Implementation - Volume 3, NSDI’06, Berkeley, CA,
USA. USENIX Association.
Sha, W., Zhu, Y., Chen, M., and Huang, T. (2015). Statisti-
cal learning for anomaly detection in cloud server sys-
tems: A multi-order markov chain framework. Cloud
Computing, IEEE Transactions on.
Song, X., Wu, M., Jermaine, C., and Ranka, S. (2007). Con-
ditional anomaly detection. IEEE Trans. on Knowl.
and Data Eng., 19(5):631–645.
Videla, A. and Williams, J. J. (2012). RabbitMQ in Action:
Distributed Messaging for Everyone. Manning Publi-
cations Company.
Wang, C., Talwar, V., Schwan, K., and Ranganathan, P.
(2010). Online detection of utility cloud anomalies us-
ing metric distributions. In Network Operations and
Management Symposium (NOMS), 2010 IEEE, pages
96–103.
Wang, C., Viswanathan, K., Choudur, L., Talwar, V., Sat-
terfield, W., and Schwan, K. (2011). Statistical
techniques for online anomaly detection in data cen-
ters. In Integrated Network Management (IM), 2011
IFIP/IEEE International Symposium on, pages 385–
392.
Welford, B. P. (1962). Note on a method for calculating cor-
rected sums of squares and products. Technometrics,
4(3):419–420.
Zhang, Z., Wang, Y., and Wang, K. (2013). Fault diag-
nosis and prognosis using wavelet packet decomposi-
tion, Fourier transform and artificial neural network.
J. Intell. Manuf., 24(6):1213–1227.
A Wavelet-inspired Anomaly Detection Framework for Cloud Platforms
117
