
Towards a Case-based Reasoning Approach for Cloud Provisioning
Eric K
¨
ubler and Mirjam Minor
Institute of Informatics, Goethe University, Robert-Mayer-Str.10, Frankfurt am Main, Germany
Keywords:
Cloud Management, Case-based Reasoning, Intelligent Cloud Provisioning.
Abstract:
Resource provisioning is an important issue of cloud computing. Most of the recent cloud solutions implement
a simple way with static thresholds to provide resources. Some more sophisticated approaches consider the
cloud provisioning problem a multi-dimensional optimization approach. However, the calculation effort for
solving optimization problems is significant. An intelligent resource provisioning with a reduced calculation
effort requires smart cloud management methods. In this position paper, we propose a case-based reasoning
approach for cloud management. A case records a problem situation in cloud management and its solution.
We introduce a case model and a retrieval method for previously solved problem cases with the aim to reuse
their re-configuration actions for a recent problem situation. The case model uses the container notion corre-
lated with QoS problems. We present a novel, composite similarity function that allows to compare a recent
problem situation with the cases from the past. During retrieval, the similarity function creates a ranking of
the cases according to their relevance to the current problem situation. Further, we describe the prototypical
implementation of the core elements of our case based-reasoning concept. The plausiblility of the retrieval
approach has been tested by means of sample cases with simulated data.
1 INTRODUCTION
The management of resources for services is a vital
aspect of cloud computing (Baun et al., 2011). For
a cloud provider, it is important to fulfill the requests
of their users and to avoid violations of Service Level
Agreements (SLA). On the other hand, it is desirable
to use the available resources as effectively as pos-
sible to avoid the waste of energy and to save hard-
ware costs. It is required to find a good balance
between over-provisioning of resources and under-
provisioning (Armbrust et al., 2010). Cloud manage-
ment addresses monitoring and configuration meth-
ods to achieve a good cloud configuration. A cloud
configuration is the placement of the virtual machines
(VM) on their physical machines (PM) and the ser-
vices on the VM’s. It also includes the resource pro-
visioning for the VM’s and their containers. A con-
tainer is a run time environment such as OpenShift
Gears or a Docker container. Cloud management can
also be seen as a resource management problem that
can be solved by a multi-dimensional optimization
approach (Garg et al., 2011; Zhao and Li, 2013), bal-
ancing resource provisioning with other optimization
criteria like costs for SLA violations. A simple ex-
ample for over-provisioning is two PM’s, each host-
ing VM’s and with an overall average resource uti-
lization of 30%. It could be beneficial to migrate the
VM from one PM to another for the reason of en-
ergy savings by stopping one PM. On the other hand,
under-provisioning of resources such as memory or
bandwidth can lead to SLA violations. Such viola-
tions increase the costs for the provider and may lead
to a decrease of reputation (Shoaib and Das, 2014).
One method to provide resources is the static way.
In this case, the system does not adjust itself to a
changing situation. There is the risk of under- or
over-provisioning (Shoaib and Das, 2014). Several
approaches solve the provisioning problem in a more
dynamic way. They range from rather simple, rule
based approaches, such as observations on the num-
ber of open connections (Pousty and Miller, 2014),
to complex algorithms. Quiroz et al. (Quiroz et al.,
2009) describe a decentralized, robust online cluster-
ing approach for a dynamic set of heterogeneous ap-
plications for resource provisioning. They consider
the typical workload of a cloud infrastructure as a
mix of long running, computationally intensive jobs,
bursty and response-time sensitive web service re-
quests, and data and IO-intensive analytic tasks.
Case-based Reasoning (CBR). (Aamodt and Plaza,
1994) is an intelligent alternative to the static and dy-
namic approaches mentioned above. The core idea is
to retrieve similar situations and their solutions from
290
Kübler, E. and Minor, M.
Towards a Case-based Reasoning Approach for Cloud Provisioning.
In Proceedings of the 6th International Conference on Cloud Computing and Services Science (CLOSER 2016) - Volume 2, pages 290-295
ISBN: 978-989-758-182-3
Copyright
c
2016 by SCITEPRESS – Science and Technology Publications, Lda. All rights reserved
the past in order to reuse them for the current situa-
tion. CBR has been considered for intelligent cloud
management recently in the literature (Maurer et al.,
2013). The work of Maurer et al. applies CBR to im-
plement automatic cloud management following the
MAPE reference model (Monitor - Analyse - Plan -
Execute) (Corporation, 2006), which originates in au-
tonomic computing. A case in cloud management
records a cloud configuration with current services
and SLA’s to be processed as a problem situation.
A solution describes the optimal distribution of work
on the optimal number and configuration of cloud re-
sources while maintaining SLA’s. Maurer et al. use a
bag of workloads to schedule the work, which makes
it difficult to predict future workloads and system be-
havior.
We think a CBR based approach can solve the pro-
visioning problem in a intelligent way with reduced
calculation effort. We are planning to implement a
system that uses CBR. This position paper focuses on
a core concept for intelligent, case-based cloud pro-
visioning namely the case-based retrieval of former
cloud configurations. In our future work, successful
cloud configurations from the past shall be reused for
problem situations in current cloud configurations.
In CBR, the retrieval ”deals with the process
of selecting experience items from the experience
base that are relevant for the current problem to be
solved.”(Bergmann, 2002). In this paper, the expe-
rience items (cases) are containers with their par-
ent node (the VM that executes the container) and
their related services and SLA’s. The experience base
(case base) contains items with violated SLA’s. At
this point the cases only include configurations with
under-provisioning.
2 SERVICE
CHARACTERIZATION
In this section we introduce the characterization of
services, which is a prerequisite to determine the sim-
ilarity between two cases. Inspired by Quiroz et al.
(Quiroz et al., 2009), we use five attributes to charac-
terize a service. These attributes describe the behavior
of the service as follows.
As the name indicates for a response-time sensi-
tive service, the response time is important. A sce-
nario for this characterization could be a task with a
user interaction where a long waiting time is not fea-
sible.
A long running, computationally intensive service
is CPU and/or memory intensive and has a long exe-
cution time, for example more than 1 hour. In con-
Table 1: Overview of service characterization following
Quiroz et al. (Quiroz et al., 2009).
service characterization
1 response-time sensitive
2 long running, computationally intensive
3 bursty, computationally intensive
4 data intensive
5 I/O-intensive
trast, a bursty, computationally intensive service is
CPU and/or memory intensive but has a short execu-
tion time. A storage intensive service needs a large
amount of disk space. This could be for example
a service that processes large video files and stores
them. Such a service would be also I/O-intensive.
This means the service has special requirements for
network bandwidth and/or disk read and write speed.
We have chosen this approach for describing a ser-
vice instead of the more common cpu intensive, mem-
ory intensive, network intensive and storage intensive.
The reason is, we think this is a more natural way to
characterize a service and it describes in a better way
what the behavior of a service is. For example the
term ”‘the service is cpu intensive”’ contains less in-
formation about a service than the term”‘the service is
a long running, computationally intensive service”’.
On the one hand, cpu intensive does not provide in-
formation on the execution time. On the other hand,
it could be difficult to determine the exact resource
usage. Thus, a more fuzzy description could be suit-
able.
We are aware of the fact that not all of the service
characterizations are in any case independent from
each other, and we will consider this in our similar-
ity model. However, we believe that the traditional
model can also suffer from similar dependencies. For
example, a CPU intensive job will also be memory in-
tensive and /or storage intensive in terms of read/write
operations. This may be caused by the fact that the
cache is not large enough and the CPU stores inter-
mediate results in the memory or on the disk. This is
clearly a dependency from the CPU intensive aspect
to the memory intensive aspect.
The similarity function might use alternative ser-
vice characterizations. We have chosen the above
attributes for a service characterization as a starting
point for our experiments.
We use a binary vector to determine the charac-
terization of each service. This is the characteriza-
tion vector. For example, a web service that automat-
ically renders large images and stores them has the
characterization of long running, computationally in-
tensive, storage intensive and I/O-intensive. There is
no user-interaction, i.e. the service is not response-
time sensitive. Because of the large image sizes to be
Towards a Case-based Reasoning Approach for Cloud Provisioning
291
expected it will likely not be bursty, computationally
intensive. The characterization vector for this service
is (0,1,0,1,1) following the order described in Table
1. The values of the characterization vector are deter-
mined automatically for each service. Initially, we de-
rive default values from the SLA specification (com-
pare Table 2). After a period of monitoring, the char-
acterization of the services may be updated based on
observations of the run-time behavior.
Table 2: Overview of service characterizations and their re-
lated SLA’s.
Service characterization Related SLA’s
response-time sensitive network latency, bandwidth
long running, computationally in-
tensive
completion time with a long dead-
line
bursty, computationally intensive completion time with a short dead-
line
data intensive data availability
I/O-intensive network bandwidth, disk IO band-
width
Garg et al. (Garg et al., 2011) says that transac-
tional applications such as Web applications require
guaranteed response time and throughput. We think
that related SLA’s can determine the network latency
and network bandwidth because both values have a
strong impact on the response time and the through-
put. If the network latency is too high, the response
time may also be too high. On the other hand, if
the bandwidth is too low the throughput may be af-
fected. The values network latency and bandwidth
can be measured by network monitoring tools.
The other SLA’s are inspired by (Kolodner et al.,
2011; Kundu et al., 2010).
3 CBR CASE STRUCTURE
First of all we want to give a short introduction into
CBR cases before we introduce the separate parts of
our model. Afterward we describe how we define the
similarity between cases.
A case consists of a problem part and a solution
part. The problem part describes a situation that oc-
curred in the past, for example, a cloud configuration
with violated SLA’s. The solution part contains re-
configuration steps (such as start more VM’s, migrate
containers etc.) to solve the problem. If a new sit-
uation with violated SLA’s occurs, the system will
search in the case base to retrieve a case from the
past that is similar to the current situation. We use
the similarity function we will introduce later on in
this section to determine the similarity between two
cases. If a similar case is found the solution from the
past is used as a starting point for reconfiguration. The
problem part of the case includes a container with its
parent node, the services executed on the node, the
SLA’s related to the services, and the service query.
The service query is the set of services to be started
next. They have not yet been provided with resources.
There are two possible problems that can occur,
which may make it necessary to reconfigure the cloud
configuration. The first problem is that there is a con-
tainer which contains one or more violated SLA’s, or
SLA’s that are about to be violated in the near future.
The second problem is that there are service requests
that can not be fulfilled by the node because of it’s
resource utilization. In both cases, a reconfiguration
may be required.
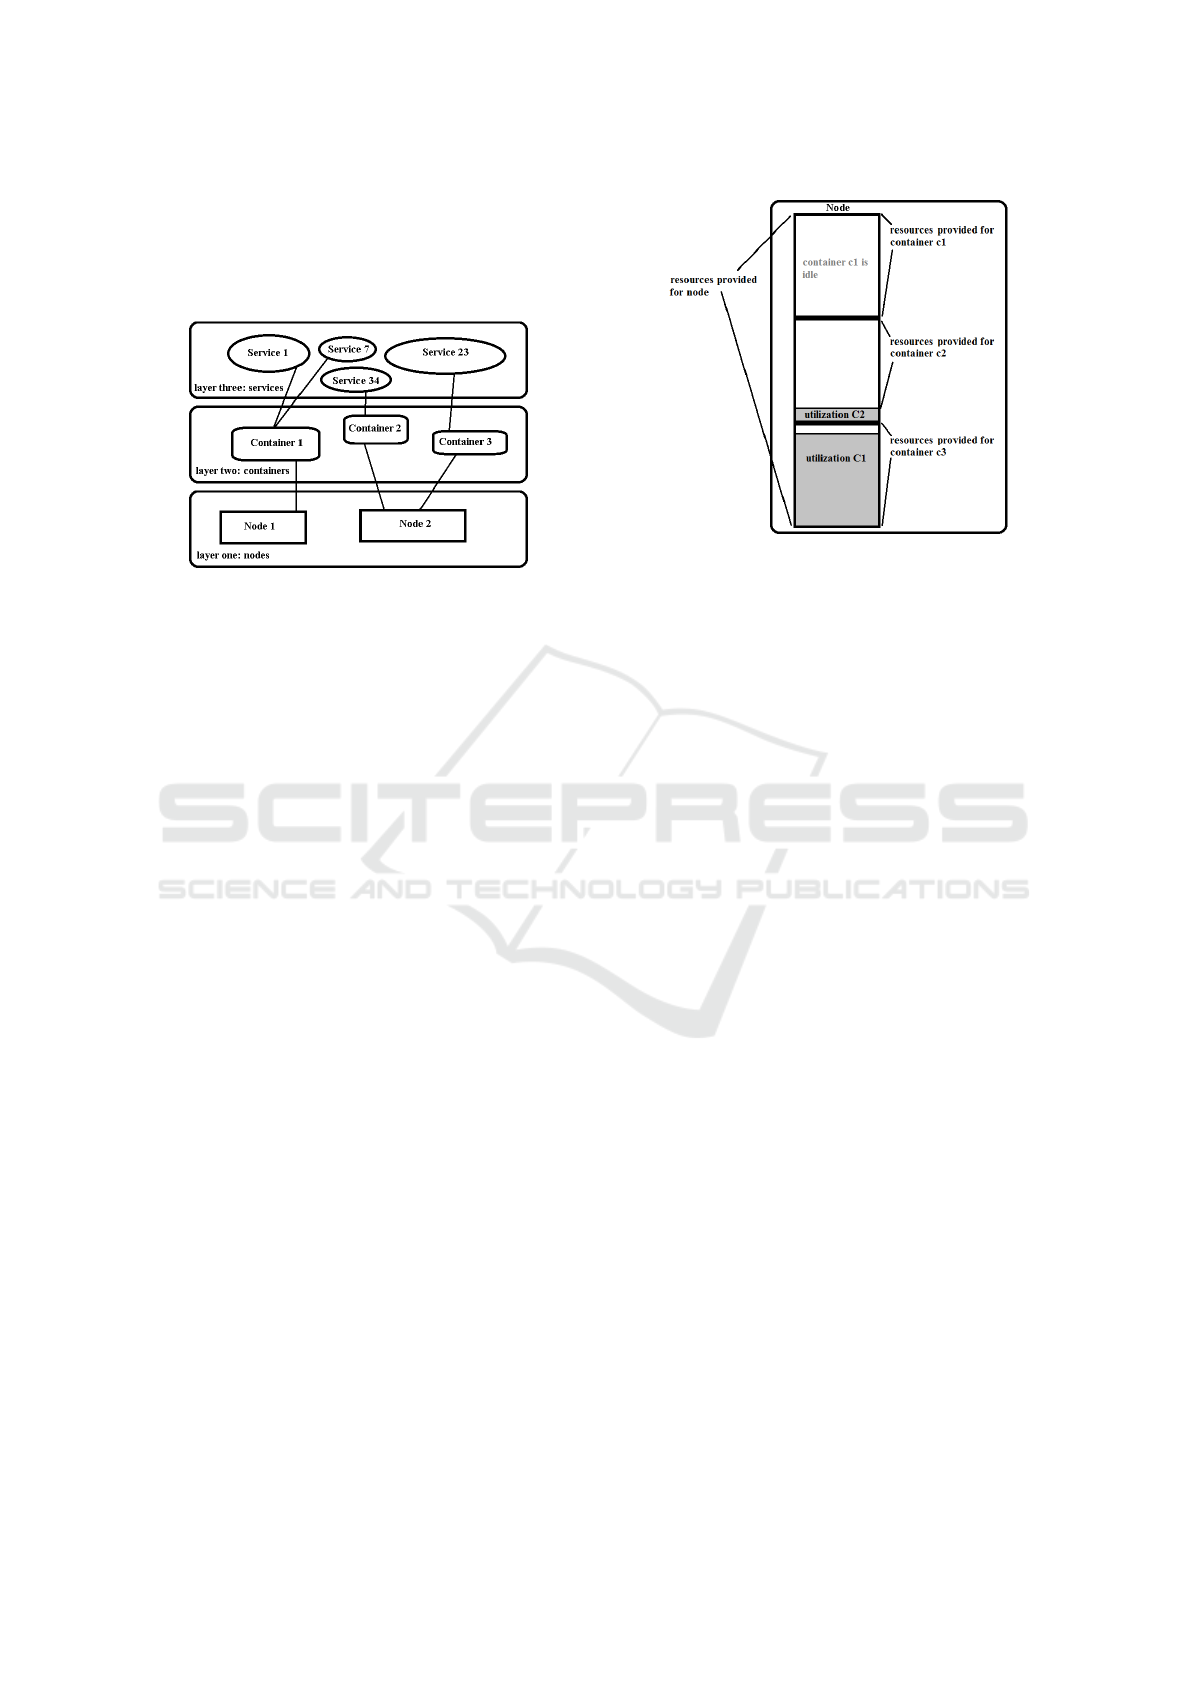
We describe a cloud configuration C as a set of
nodes n ∈ Nodes. A node can be a virtual machine or
a storage component. The nodes form the first layer of
a hierarchical structure as depicted in Figure 1. The
second layer comprises the containers and the third
the services.
Each node n ∈ Nodes includes the provided re-
sources pr
node
, the current utilization ur
node
of each
resource and a set of containers that are executed by
this node n = (pr
node
,ur
node
,containers). The pro-
vided resources depend on the type of node. The pro-
vided resources of a virtual machine are described by
values for CPU, memory, storage and network band-
width pr
node
= (cpu,mem,sto,bdw). The resources
can be monitored by different tools, such as nagios
(Nagios, ). The utilization of the resources is given
as the resource usage (in percentage) of the contain-
ers that are executed on this node. All containers at
the same node share the resources of this node. Thus,
the resource utilization of the node can be determined
from the resource utilization of the particular contain-
ers.
Similar to nodes, containers are run time environ-
ments for services. They are decribed by the provided
resources pr
con
, utilized resources ur
con
, and a set of
services, which use the provided resources and are re-
sponsible of resource utilization in analogy to con-
tainers for nodes. Let c be a container of node n, then
is c = (pr
con
,ur
con
,services).
Each service can be considered a workload, con-
sisting of a unique service identifier, the service char-
acterization, the number of users who are currently
working with, and the volume of the input data. An
example of a service is a rendering Web service where
users can upload their images and let them being ren-
dered. The service characterization of such a service
will probably be response-time sensitive due to the
user interaction, and bursty, computationally intensive
respectively long running, computationally intensive
due to the broad diversity of image sizes. Such a ser-
vice could be used by several users at the same time.
The number of the users who currently communicate
CLOSER 2016 - 6th International Conference on Cloud Computing and Services Science
292
with the service can be discovered by the different IP
addresses. The uploaded images are the input data
and the size (in mb) is the volume of the input data.
This can be monitored by network-traffic monitoring
tools.
Figure 1: The hierarchic structure of cloud configuration.
One challenge is to assign the resource usage of a
node to it’s containers and likewise from a container
to it’s services. For example, if the memory utilization
of a node n is 66% and n comprises only one con-
tainer c
1
it is easy to determine the share of the mem-
ory utilization consumed by c
1
. Let us assume that n
provides c
1
with all available resources, i.e. pr
node
=
pr
con
. In this case the 66% memory utilization comes
all from c
1
. If n comprises three containers (c
1
,c
2
,c
3
)
the case is more difficult. Even if the resources pr
node
of n are distributed in equal parts between the contain-
ers (for each c
i
, pr
con
= 1/3pr
node
) it can not be con-
cluded that the containers have the same workloads
and, thus, are responsible for 22% of the overall uti-
lization. It is possible that one of the containers is
idle while another one has a share of 11% and the last
container is responsible for 55% of the utilization as
illustrated in Figure 2. To estimate the percentage of
utilization consumed by each container /service, we
use task manager tools. At each level of the hierar-
chy (node, container, service), the current share of the
CPU, memory, network and disk I/O usage of the con-
tainers/services can be determined via task manager
tools like top (Unix Top, 2014) which show the indi-
vidual share of the resources for each process. Each
container is visible as a process for a node and each
service for a container.
In addition to the cloud configuration, our model
of a problem situation considers the service query.
Each time a cloud user considers to start a service
she sends a request to the cloud system to trigger this
service. The service query contains all requests that
have not yet been fulfilled. The requests are described
by the name of the service and the according SLA’s.
A sample service is the rendering Web service Ren-
der Service on Apache2.4. After a request is accom-
Figure 2: Example of resources provided and utilized.
plished, the system assigns a unique identifier to the
service and deletes the request from the service query.
The status of the individual SLA’s for ongoing ser-
vices are monitored by the system. The state of a SLA
might be green, yellow or red. Green means the mea-
sured values are acceptable im terms of the SLA. If
the state is yellow the values are still acceptable but
they are close to boarder and a SLA violation in the
near future is to be expected. A red state means that
an SLA violation has occurred. The thresholds for-
changig the state from green to yellow or to red de-
pend on the SLA, i.e. it is predefined by the adminis-
trator or the user.
4 CASE SIMILARITY
In order to determine the similarity between two
cases, we use a composite similarity function for the
problem part of the cases. We define the similarity
between two nodes by the similarity of their resources
provided, including the utilization of these resources.
The similarity function for nodes nodeprov is in-
duced from a taxonomy of nodes as depicted in Fig-
ure 3. For our first experiments, we use the resource
sets of Amazon EC2 instances (AWS, ) as leafs of the
taxonomy. An example for an EC2 instance is the
M3 instance with two virtual CPU’s, 3.75 GB RAM
and 32 GB of disk space. For further information
on the instances, we refer to the Amazon Web page
www.aws.amazon.com/de/ec2/instance-types/. We
think that the size of the instances (tiny, small, 4xlarge
and so on) has a higher impact on the similarity than
an eventual specialization of the container (for exam-
ple for memory intensive applications). For the nodes,
we prefer a taxonomical similarity over a numerical
function calculated from the Euclidean distance, for
Towards a Case-based Reasoning Approach for Cloud Provisioning
293
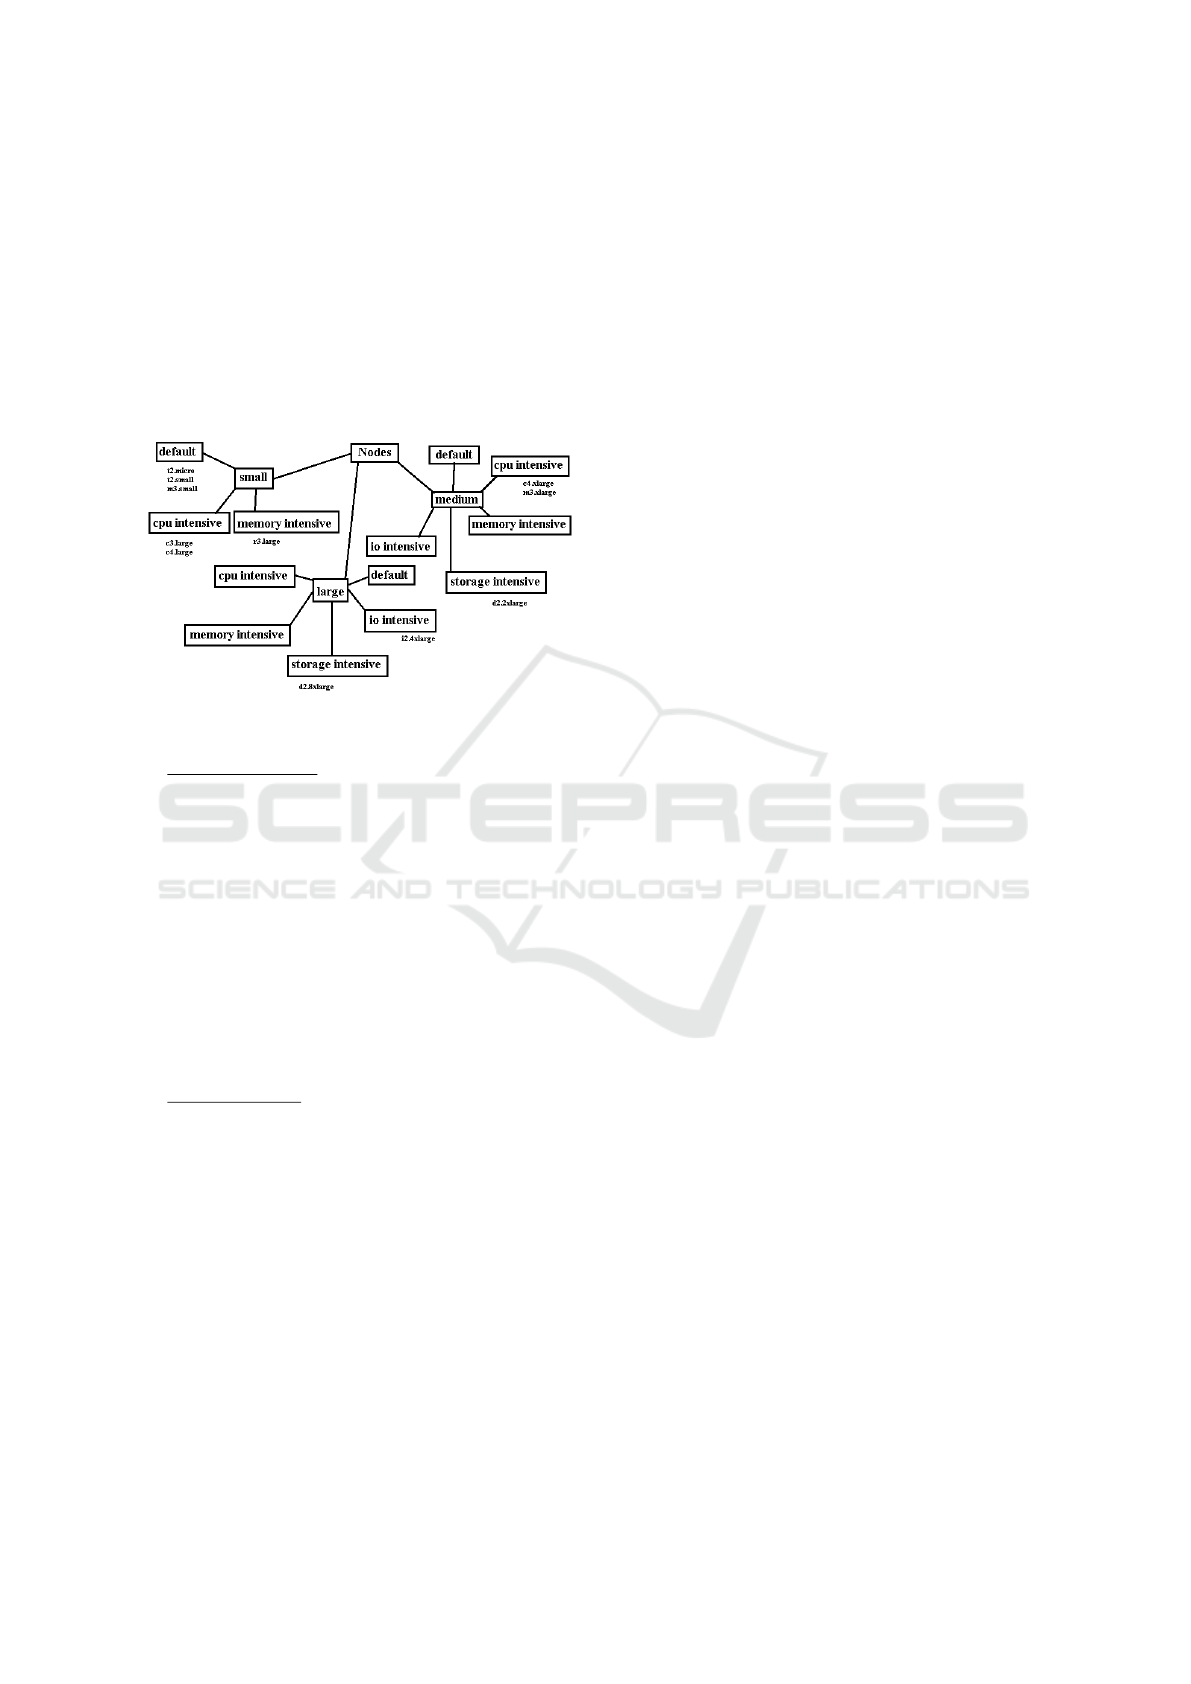
instance. The reason is that for many nodes the val-
ues between several resources differ to a large extent.
For example, the minimal number of CPU’s is one
and the maximum number is 40. On the other hand,
the minimal bandwidth we expect is 100 Mbits/sec.
The maximum is 10 Gbits/sec. Instead of balancing
the similarity values for the particular resources by
weighting or by normalization, we decided to build a
taxonomy since it provides an easy and natural model.
The similarity of the resource utilization nodeutil is
Figure 3: Taxonomy of nodes (in parts).
calculated by the Euclidean distance nodeutil(p,q) =
r
n
∑
i=1
(q
node
i
− p
node
i
)
2
where p is the vector of n uti-
lization values for the first case and q for the second
case. The utilization values are provided in percent-
age. For example, q
node
1
= 50 is the utilization of the
CPU q
node
1
with a value of 50%. p
2
is the utilization
of the memory and so on.
Analog to nodes, we specify the similarity func-
tion between containers consim by means of a tax-
onomy of the provided resources and the Euclidean
distance for the utilized resources conuti. We use
RedHat OpenShift Gears and IBM Bluemix con-
tainers as templates for our containers. Thus, the
similarity function for containers is consim(p,q) =
r
n
∑
i=1
(q
con
i
− p
con
i
)
2
with con for container.
In addition, we consider the services and the
SLA’s related to the container. As pointed out earlier,
every service has a vector of it’s characterizations (see
Section 2). To compare two nodes it is not necessary
to compare the services themselves but to compare the
occurrence of a characterization attribute, i.e. whether
a service is response-time sensitive or not. Therefore,
we build the container characterization conchar. This
is a vector of aggregated occurrences of each service
characterization attribute for each service that is exe-
cuted on the container. For example: a container c has
two services s1, s2. Both services are response-time
sensitive. In addition, s2 is also bursty, computation-
ally intensive. The container characterization vector
CV for c is then CV = (2, 0,1,0,0). We use again the
Euclidean distance for the container characterization
vectors.
To determine the similarity of the number of SLA
violations slavio we build again a vector that contains
every SLA type occurring in our cloud configuration
and sum up the number of SLA’s with condition red
for the specific container. For example, there might
be two different types of SLA’s specified in our cloud
configuration namely network latency and data avail-
ability. Again, we consider container c with two ser-
vices s1,s2. Both services contain an SLA on network
latency and data availability. In this example, both
SLA’s are violated for s1. Due to different thresh-
olds, only the network latency SLA for s2 is in red
state. Thus, the resulting SLA violation vector for c
is c = (2, 1). Again, we use the Euclidean distance
to measure the similarity between two SLA violation
vectors.
Finally, we compare the service query sq for both
cases. At the moment, we compare only the length
of two queries to determine the similarity. In future
work, we will extend this.
Now we can calculate the entire similarity osim
for two cases by aggregating the local similarity val-
ues in a weighted sum:
osim = x
1
∗nodesim+x
2
∗nodeuti+x
3
∗consim+x
4
∗
conuti + x
5
conchar + x
6
∗ slavio + x
7
∗ sq.
The weights x
1
,x
2
...,x
7
are configurable.
5 EVALUATION
In a preliminary evaluation, we have implemented a
prototype to generate 50 test samples and measured
the similarity between them. As mentioned before,
we have used Amazon EC2 instances as a template for
our nodes and OpenShift Gears and Bluemix contain-
ers as a template for our containers. We used about
100 automatically generated services with a random
set of service characterizations. The nodes for the
cases have been chosen randomly with random sets
of containers and random sets of services. Depend-
ing on the service characterizations, we determined
randomly a utilization value for each resource (CPU,
memory...). For example, if a service is long run-
ning, computationally intensive, the average CPU and
memory utilization will be higher than for a service
without this characterization. The utilization is also
higher for a container with multiple characterizations
of the same type. For example, if a container contains
two services with the long running, computationally
intensive characterization the entire utilization value
CLOSER 2016 - 6th International Conference on Cloud Computing and Services Science
294

will be higher than for a single one. After having ini-
tialized the utilization for each container, we calcu-
lated the resource utilization for the node. Further, a
set of SLA’s is assigned to the containers, depending
on the services executed on the container. If an SLA
can not be fulfilled due to the resource utilization of
the container, the SLA is set to status red. The case
base has been created by chosing randomly one con-
tainer per node.
We applied the similarity function described in
Section 4. The results in Figure 4 indicate that the
size of the nodes (for example Case 4 is an i2.xlarge
node) is an important aspect since nodes with a simi-
lar size are frequently more similar to each other than
two nodes with other sizes. The result shows also that
the distance of a case to itself is always zero, i.e. that
the cases are equal.
Figure 4: Example result of our experiments.
6 CONCLUSION
In this paper, we have presented our concept for the
retrieval part of a case-based approach for intelligent
cloud provisioning. We have introduced our similar-
ity function for cases and have conducted several test
evaluations. The evaluation with sample test cases has
shown that it is possible to retrieve plausible results.
There are several open issues we will tackle in future.
We have only considered under-provisioning so far.
However, we will develop a CBR approach for pre-
venting over-provisioning as well. Second, we will
consider whether it is sufficient to observe only single
containers with their nodes. Another open issue is to
determine the characterization for services based on
their run-time behavior. The preliminary results are
promising and provide a first, important step towards
intelligent, case-based cloud provisioning.
REFERENCES
Aamodt, A. and Plaza, E. (1994). Case-based reasoning:
Foundational issues, methodological variations, and
system approaches. 7(1):39–59.
Armbrust, M., Fox, A., Griffith, R., Joseph, A. D., Katz,
R., Konwinski, A., Lee, G., Patterson, D., Rabkin, A.,
Stoica, I., and Zaharia, M. (2010). A view of cloud
computing. 53(4):50–58.
AWS. Amazon web services (AWS) - cloud computing ser-
vices. http://aws.amazon.com/, 12-19-2015.
Baun, C., Kunze, M., Nimis, J., and Tai, S. (2011).
Cloud Computing - Web-Based Dynamic IT Services.
Springer.
Bergmann, R. (2002). Experience management: Founda-
tions, development methodology, and Internet-based
applications. Springer Verlag.
Corporation, I. B. M. (2006). An architectural blueprint for
autonomic computing.
Garg, S. K., Gopalaiyengar, S. K., and Buyya, R. (2011).
SLA-based resource provisioning for heterogeneous
workloads in a virtualized cloud datacenter. In Al-
gorithms and Architectures for Parallel Processing,
pages 371–384. Springer.
Kolodner, E. K., Tal, S., Kyriazis, D., Naor, D., Allalouf,
M., Bonelli, L., Brand, P., Eckert, A., Elmroth, E.,
Gogouvitis, S. V., Harnik, D., Hernandez, F., Jaeger,
M. C., Lakew, E. B., Lopez, J. M., Lorenz, M.,
Messina, A., Peleg, A. S., Talyansky, R., Voulodimos,
A., and Wolfsthal, Y. (2011). A cloud environment for
data-intensive storage services. pages 357–366. IEEE.
Kundu, S., Rangaswami, R., Dutta, K., and Zhao, M.
(2010). Application performance modeling in a vir-
tualized environment. pages 1–10. IEEE.
Maurer, M., Brandic, I., and Sakellariou, R. (2013). Adap-
tive resource configuration for cloud infrastructure
management. 29(2):472–487.
Nagios. Nagios - the industry standard in IT infrastructure
monitoring. http://www.nagios.org/, 12-19-2015.
Pousty, S. and Miller, K. (2014). Getting Started with Open-
Shift. ”O’Reilly Media, Inc.”.
Quiroz, A., Kim, H., Parashar, M., Gnanasambandam, N.,
and Sharma, N. (2009). Towards autonomic workload
provisioning for enterprise grids and clouds. In Grid
Computing, 2009 10th IEEE/ACM International Con-
ference on, pages 50–57. IEEE.
Shoaib, Y. and Das, O. (2014). Performance-oriented cloud
provisioning: Taxonomy and survey. abs/1411.5077.
Unix Top (2014). http://www.unixtop.org/, 12-18-2015.
Zhao, H. and Li, X. (2013). Resource Management in Util-
ity and Cloud Computing. Springer, 1 edition.
Towards a Case-based Reasoning Approach for Cloud Provisioning
295
