
Cost Model Approach for Next Generation Emergency Call Systems
Italy Case Study
Ahmet Apak and Ilker Ustoglu
Control Automation Department, Yildiz Technical University, Davutpasa Campus, Istanbul, Turkey
Keywords: Emergency Call System, 112 PSAP, Rescue Services, ERO (Emergency Response Organization), Cellular
Tower Network, Crash Notification, Emergency Call Unit, eCall, PSAP, Cellular Tower.
Abstract: Next generation emergency notification system after emergency call (eCall) equipped vehicle regulations
with the legislation EU-2015/758 is analysed via optimal architecture selection with the study of cost
modelling for the “Emergency Calls EROs Handling” model of European Emergency Number Association
(EENA) which is applied in Italy, Austria, France, Germany and Norway. According to EU-Regulation
2015/758, public safety answering points (PSAPs) need to be ready for the new model system with the start
date of 1st October 2017 while eCall-equipped vehicles are started to be produced at the end of March 2018.
With this regulation, infrastructure and working procedure of eCall systems as well as eCall equipments and
related vehicle structures will be updated or modified as an obligation. According to status of most
appropriate 112 PSAPs, there may be an adaptation of manual eCall PSAPs, auto eCall PSAPs. In this
paper, the optimal architecture of the system in Italy is discussed and the next generation crash notification
systems for current “Emergency Calls EROs Handling” model are defined.
1 INTRODUCTION
According to International Accident and Road
Database (IRTAD), numbers of road fatalities are
changing between 3 and 13 for 100000 inhabitants
in the IRTAD member countries (IRTAD, 2014).
The countries try to decrease these fatality rates; so
the new regulations are created. The main objective
of this study is to define the optimal architecture of
emergency call system in Italy after eCall equipped
vehicle regulation, EU-2015/758 in 2018. It means
there will be the next generation of current
“Emergency Calls EROs Handling” model of
European Emergency Number Association (EENA).
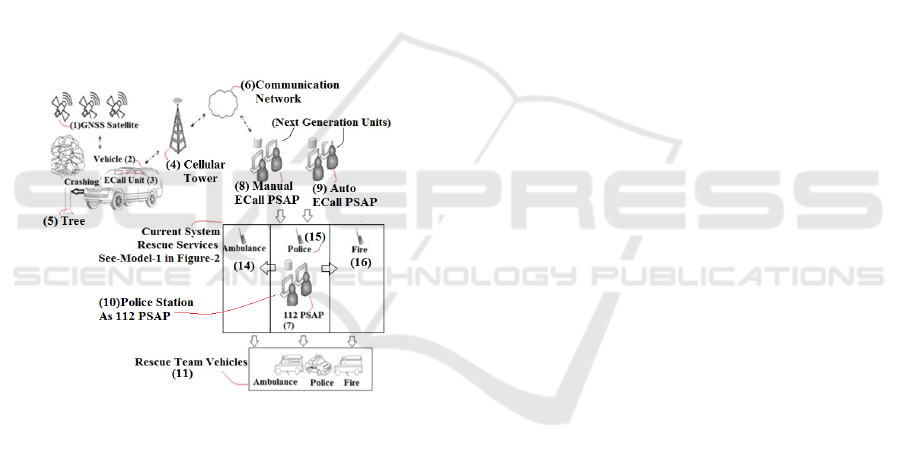
The emergency calls (eCall) system generic
structure which includes both current and next
generation units are described in Figure-1. The
current architectures of European Emergency
Number Association (EENA) are defined in Figure-
2. In Figure-2, Model-1 is the current Italy
infrastructure and its next generation scenarios are
analysed in this paper. Moreover, the next
generation architectures of Italy Infrastructure after
the eCall equipped vehicle regulation in 2018 are
explained in Figure-3. In all figures, the description-
numbers of units are expressed as: (1) Global
Navigation Satellite System to take the positioning
data of the vehicle (2) which have an accident when
crashing the tree (5). Next, eCall unit (3) is the
device inside of the vehicle and will be an obligation
after eCall equipped vehicle regulation in 2018.
Cellular tower (4) processes the communication
signals and transfer to the related services thanks to
communication network (6). 112 PSAP (7) is the
emergency call response service in the current
statuses. When Manual eCall PSAP (8) is the next
generation PSAP service for the accidents of the
vehicles which have manual eCall device, Automatic
eCall PSAP (9) is the next generation PSAP service
for the accidents of the vehicles which have
automatic eCall device. If the Manual eCall PSAP
and/or Auto eCall PSAP is only one unit, it is
described with unit (20). The Police station (15)
which is used as 112 PSAP (7) is the integrated unit
(10). Rescue team vehicles are defined as the unit
(11) when ambulance service station is unit (14) and
fire service station is unit (16). Moreover, public
communication device such as mobile phone which
enables to call the emergency service is unit (12)
when the 112 PSAP which has an interconnected
structure is the unit (13). Interconnected PSAPs are
connected with each others in the same region. If
130
Apak, A. and Ustoglu, I.
Cost Model Approach for Next Generation Emergency Call Systems - Italy Case Study.
In Proceedings of the International Conference on Vehicle Technology and Intelligent Transpor t Systems (VEHITS 2016), pages 130-137
ISBN: 978-989-758-185-4
Copyright
c
2016 by SCITEPRESS – Science and Technology Publications, Lda. All rights reserved
any of them cannot response the emergency calling,
the other interconnected PSAP can response it. In
the next generation scenarios, the integrated control
room/building which can include PSAPs, rescue
services, dispatch and response units inside, is the
unit (17) while the out of control room/building
structure is described with unit (19). Moreover, the
unit (18) is defined which is the dispatch unit for all
type of rescue services. The unit (18) can be thought
as the one unit and it can make the dispatches for
police vehicles, ambulance vehicles and fire
vehicles. If there is unit (18), there is no usage for
unit (14), (15) and (16) for the vehicle accidents.
The generic eCall system embodies the accident
with a vehicle (2) crashing into a tree (5) in Figure-
1. After the crash, vehicle-eCall unit (3) is
responsible for the activation process. If the eCall
device is triggered automatically, it is called
automatic eCall activation. Manual or automatic
activation is enabled by vehicle ignition signal and
eCall wake up signals.
Figure 1: Generic eCall crash notification system for Italy
(Current and Next Generation Units).
In this system, the supply voltage is provided by a
starter battery and the boost processor creates the
different types of voltages where the vehicle location
is received by internal GNSS module from GNSS
Satellite (1). Cellular connection is provided with
internal GSM module in the eCall device (3). By the
way, eCall device includes two main parts which are
eCall measurement unit and Control Unit. It includes
also rechargeable battery which protects the device
from power losses. Airbag signal, car crashing input
and related vehicle data are sent to the main
processor of eCall control unit. ECall data in eCall
equipped vehicle (2) will be sent to cellular tower
(4) via cellular tower network. The cellular tower is
chosen by its capacity, signal power of sending data
and cellular tower usage. Data are transmitted to the
related data entity which is defined by the service
rules of digital cellular telecommunication
regulation. After the data is processed in cellular
tower, it is forwarded to public safety answering
points with the communication network (6). By the
way, eCall data are checked by (i) general
description of data; (ii) code requirements and (iii)
data conformance tests. Data of public safety
answering points with the new structure are fitted
with the operating requirements in the regulations of
third party organizations. PSAPs (7, 8 or 9) inform
the rescue services with the accident data; and then
they forward the data sets to the rescue-vehicle
teams (11). This whole accident situation needs to be
fitted with the pan European eCall regulation and
end to end conformance tests.
2 ECALL ARCHITECTURES
2.1 UpTo Date EENA Emergency Call
Architectures
Without eCall equipped vehicle regulations, there
exist six main emergency system architectures at the
current status based on EU-Countries.
Model-1: Emergency Calls EROs handling
(Austria, France, Germany, Italy, Norway)
Model-2: Filtering stage-1 PSAP and resource
dispatching stage-2 PSAPs (UK, Ireland,
Netherland)
Model-3: Data Gathering by stage1 and
resource dispatching by stage2 (Romania)
Model-4:Data Gathering by stage PSAP1 and
resource dispatching by stage PSAP2 in an
integrated control room (Madrid, Ostrava,
Belgium, Turkey)
Model-5: ERO Independent PSAP (Finland)
Model-6:Interconnected PSAP (Czech
Republic, Bulgaria, Sweden)
These current architectures are figured in Figure 2.
In this paper, the next generation of Model-1,
‘Emergency Calls EROs handling’ which is the
current status of Italy, Norway, Germany, France
and Austria is investigated based on Italy
infrastructure.
On the other hand, there exists one more model
which is not used in any country at the current status
which includes control room of PSAP (17) service
with 1 ERO (14 or 15 or 16 or 18). It can be called
as Model-7.
Cost Model Approach for Next Generation Emergency Call Systems - Italy Case Study
131
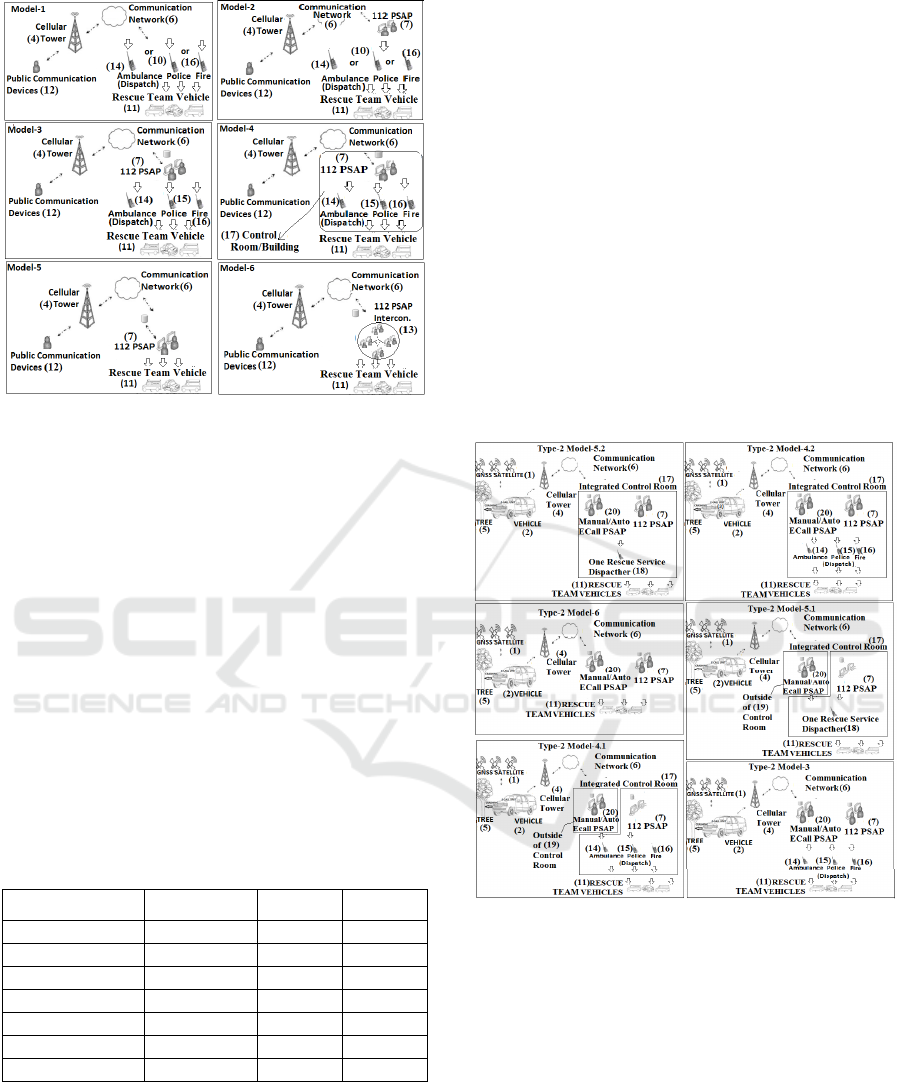
Figure 2: EENA Current Emergency Call Architectures.
2.2 Next Generation Emergency Call
Architectures
After eCall legislation of the vehicles, EU-2015/758;
emergency call structures need to be adapted or
modified into the systems in Figure-2. New
Emergency call cases are analyzed with respect to
eCall receiving’s. New system receiving-types are
listed below:
Type-1: 112 PSAP Receiving’s (Current Status-
in Figure-2)
Type-2: 112 PSAP and Manual/Automatic
ECall PSAP Receiving’s
Type-3: All PSAPs (112 PSAP, Manual eCall
PSAP and Auto Ecall PSAP) Receiving’s
Types are combined with current models in Table-1.
Table 1: Number of New ECall System Architectures.
Model/Type Type-1 Type-2 Type-3
Model-1 1 0 0
Model-2 1 1 1
Model-3 1 1 2
Model-4 1 2 5
Model-5 1 3 5
Model-6 1 1 2
Model-7 1 1 2
Table-1 shows the total number of new
architecture types after eCall equipped vehicle
regulations.
2.3 Next Generation Emergency Call
Architectures of Current
“Emergency Calls EROs Handling”
System (Italy)
“Emergency Calls EROs Handling PSAP” model
was explained in Figure-2 with Model-1 in which its
infrastructure does not include any PSAP service
externally due to the fact that one of Rescue Service
is working as PSAP. According to Model-1
infrastructure property, 33 Architecture types in
Table-1 can be filtered. After the variant filtration,
12 architectures can be applied to Italy which has the
“Emergency Calls EROs Handling PSAP” model.
The optimal 6 of 12 architectures via cost models are
analyzed and decided with the simulation, which is
shown in Figure-3. The details of simulation study
are explained in Part-3.
Figure 3: Possible New ECall System Architectures for
“Emergency Calls EROs Handling PSAP” Model.
In Figure-3, Type-2 Model-5.2 has an integrated
control room concept (17) includes manual/auto
eCall PSAP (20) and 112 PSAP (7) with one rescue
dispatch unit (18) when Type-2 Model-4.2 includes
the same PSAP types (7, 20) with all rescue units
(14, 15, 16). Next, Type-2 Model-6 includes only
two PSAPs as Manual/Auto eCall PSAP (20) and
112 PSAP (7) in which both giving responses to
emergency calls and making dispatches to the rescue
service vehicles (11). Type-2 Model-5.1 has the 112
PSAP for call-response and one rescue service unit
(18) for the dispatch process in integrated control
VEHITS 2016 - International Conference on Vehicle Technology and Intelligent Transport Systems
132
room/building (17) when Manual/Auto Ecall PSAP
(20) is out side of the Control Room (19). Type-2
Model-4.1 has the same structure with Type-2
Model-5.1, but the only the difference is that
includes the all rescue services (14, 15, 16) in the
integrated control room (17). Finally, Type-2
Model-3 has Manual/Auto eCall PSAP (20) and 112
PSAP (7) for call response and making dispatches
with rescue stations (14, 15 and 16).
Taking these architectures into consideration,
they will be analysed with respect to: (i) intelligent
vehicle system, (ii) eCall component in the vehicle,
and (iii) infrastructure system costs in Part-3; then
the study result will be evaluated in Part-3.4 and
Part-4.
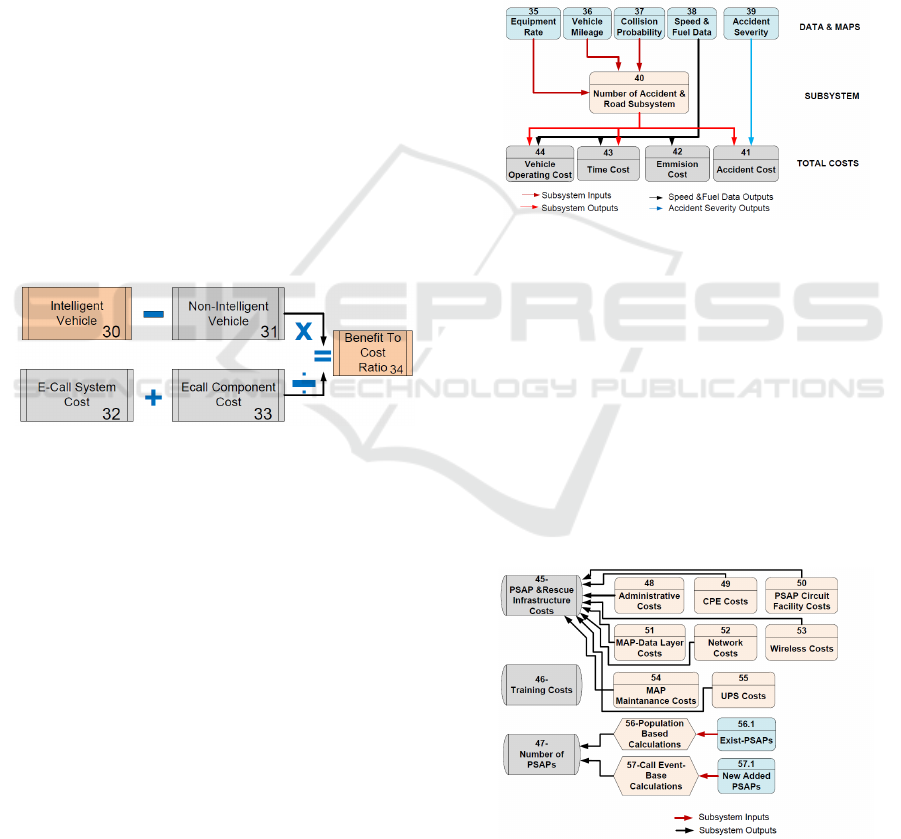
3 OVERALL COST MODEL
3.1 Terms and Definitions
The logical approach in the cost model is associated
with the vehicle specifications (30, 31), eCall
component (33) and eCall system infrastructure (32)
is shown in Figure-4.
Figure 4: Cost-Model Approach.
In Figure-4, intelligent vehicle is defined as
intelligent vehicle safety system includes the smart
technologies for pre-crash, post-crash and crashing.
ECall is a post crash item and it will be analyzed
in this study. Other technologies in the vehicles will
be investigated with equipment rates which show the
percentage rate of vehicle technology increasing
year by year. As it is shown in Figure-4, the benefit
is analysed with the difference of smart vehicle (30)
and vehicle without smart properties (31). It includes
all status such as transportation, vehicle technology
rates, saving life in accidents etc. Next, System cost
defines the infrastructure costs (32) of whole system
which is described in Figure-1. Finally, E-Call
component (33) is the device integrated to the
vehicle. The calculation with the function of benefit
(process 30 and 31) and total consumption (32, 33)
enables to see the benefit to cost ratio (34).
First of all, vehicle process (30, 31) definitions
will be explained as it is shown in Figure-5.
General vehicle system in Figure-5 describes the
vehicle system for both intelligent vehicle (30) and
non-intelligent vehicle (31). The only differences
between them are the parts; 39 (Accident Severity),
43 (Time Cost) and 41 (Accident Cost).
Benefits come from these parts for post-crash
eCall items such as life savings, time savings.
Vehicle system is investigated with three groups
which are data and maps, subsystems and total costs.
Data and maps are the inputs of the systems which
are 35 (equipment rate), 36 (vehicle mileage), 37
(collision probability), 38 (speed and fuel data) and
39 (accident severity).
Figure 5: General Vehicle System (30, 31).
Subsystem is defined with item-40 which includes
the calculations of number of accident and road
conditions. All these subsystem and inputs create the
total costs which are 41 (Accident Costs), 42
(Emission Costs), 43 (Time Costs) and 44 (Vehicle
Operating Costs).
Ecall component cost (33) defines the
equipment costs which are adapted to the vehicle
after the regulations.
Ecall system costs explain the infrastructure cost
of whole eCall system and it can be summarized
with Figure-6.
Figure 6: Infrastructure System Costs (32).
There are 3 main subgroups in Figure-6. These
are 45 (PSAP & Rescue Infrastructure Costs), 46
Cost Model Approach for Next Generation Emergency Call Systems - Italy Case Study
133

(PSAP & Rescue Persons’ Training Costs) and 47
(Number of PSAP workers). Item-45 includes 8
subsystems which are 48 (administrative costs), 49
(Customer Premise Equipment Costs), 50 (PSAP
Circuit and Facility Costs), 51 (Map & Data Layer
Costs), 52 (Network Costs), 53 (Wireless Costs), 54
(Maintenance Costs) and 55 (Unit Power Supply
Modules Costs).On the other hand, number of
PSAPs (47) are calculated by two methods;
population-based (56) and call-event based (57).
Population-based calculation provides the exist-
PSAPs data when call-event base calculations enable
next generation PSAPs such as Manual, Automatic
eCall PSAP.
When item-48 in Figure-6 defines the personal
costs of services, item-50 calculates the1 event
prices and office costs. In addition, map and data
layers (51) are the software programme
requirements of the worker computers and
workstations. Next, network costs (52) define the all
database and charges about frame relay network
when item-53 is the wireless communication
network.
3.2 Intelligent Vehicle Safety System
General overview of the vehicle system in all system
structure is defined at last section 3.1 with Figure-4
and Figure-5. In this section, all parts will be
investigated in details.
-Equipment Rate (35)-
Equipment Rate is the rate of vehicle stock (VS)
divided by equipped vehicle stock (EVS) as it is
shown in f1. Equipment rate in the vehicle defines
the smart technology rate of the vehicle.
Eq.Rate = (EVS/VS)*100 (f1)
Eq. Rate is explained for EU-25 Countries year
by year by ACEA. Equipped vehicle stock depends
on old registered vehicle stock (EVS’) and diffusion
rate (dR) which describes the technology difference
between intelligent vehicle and non-intelligent
vehicle. EVS formula is shown in f2.
EVS = EVS’+dR (f2)
The author calculation with the data support of
ACEA-report shows that 2015 year Eq. Rate is 46
percent when it is 76 percent in 2020.
-Vehicle Mileage (36)-
Vehicle Mileage is calculated by carrying good
or passenger in transportation. Country
transportation data which is for Italy in this paper is
calculated by author with the data support of world
transport report. When passenger transportation is
478 MKm in 2018, good transportation is about 98
MKm and vice versa.
-Collision Probability (37)-
It is the function of collision types and driver
reactions. The Collision Study of Enke Probability is
applied in this paper which includes three types of
collisions with the probability data. These are
collisions at intersections, oncoming traffic
collisions and rear end collisions. When minimum
data in the cost model is 0.1 % at collisions at
intersections, maximum data is nearly 75 % at
oncoming traffic collisions.
-Speed & Fuel Data (38)-
Driving statistics in the study of Andre’1999 with
the road types such as rural, urban and motorway are
applied to this cost model and its simulation with
two factors; road type and vehicle type. When
minimum and maximum values for all vehicles in
urban ways are between 23 and 49 km/h, it is
between 39 and 87 for passenger cars and light
duties in rural ways. Next, rural way rates for heavy
duty vehicles are between 40 and 77 km/h. Finally,
the motorway rates for light duty and passenger cars
are between 91 and 109 km/h when it is between 76
and 84 km/h for heavy duties.
-Accident Severity (39)-
Accident severity is analysed in three sections;
slight injury, severe injury and fatality rates.
This rate is calculated by author with the data
support of e-merge project in 2004. It enables to see
that intelligent vehicle fatality rates can be decreased
to 0.9 from 1 which enables to save life and decrease
big amount of costs. This decrease may cause to
increase the severe injury or slight injury rates from
1 to 1.1. But its consumption cost is not high.
According to IRTAD Annual Report, unit cost of
fatality is around 1503000 € when severe injury unit
cost is 197000 € in Italy. Next, slight injury unit cost
is about 17000 € in Italy. It shows the cost difference
between fatality unit cost and injury unit costs.
-Number of Accident and Road Subsystem (40)-
Accident rates are analysed via being EU-
Countries or EU-Accending countries. Accident
risks are defined with the table-2.
In this paper, the roads of Italy which has the
“Emergency Calls EROs handling” model are
487,700 km includes 6700 km of express ways is
rated in the simulation via being rural, urban and
motorway.
-Total Vehicle Costs (41, 42, 43, 44)-
Accident Costs (41) are calculated by the
multiplication inputs of accident cost unit rates
(defined in speed section), accident severity (39) and
number of accidents (40).
VEHITS 2016 - International Conference on Vehicle Technology and Intelligent Transport Systems
134
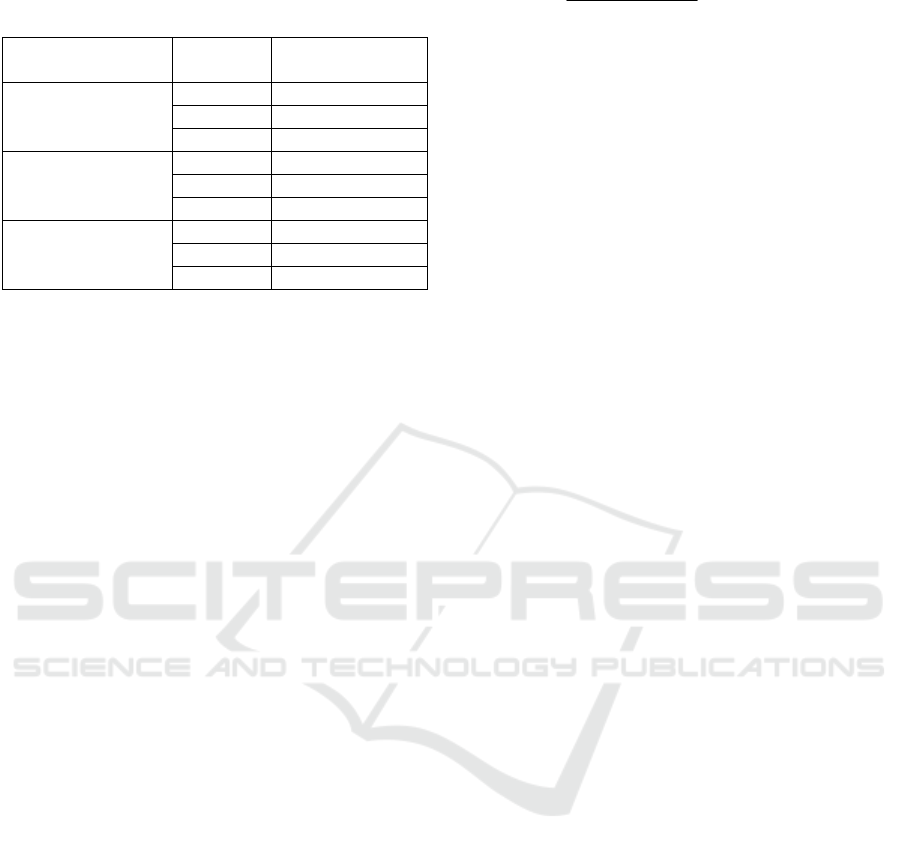
Table 2: Risk of Accident in Different Road Categories
(Author Calculation with the data support of European
Commission 2003a report).
Country Road
Type
Accident Risk
(per Billion-Km)
EU-25 Best Perform
Motorway 2-4
Rural 2-5
Urban 3-5
EU-25 Worst
Perform
Motorway 9-15
Rural 12-15
Urban 15
EU-Accending
Motorway 10-20
Rural 13-22
Urban 17-24
Moreover, operating costs (44) are measured by
operating basic costs and fuel consumption costs.
Operating basic cost is calculated by multiplication
of fixed-operating costs with vehicle mileages (36).
Fixed-operating costs are the unit rates of vehicles
such as 9.16 €/100km for cars, 14.19 €/100 km for
trucks, 45.90 €/100 km for busses. Fuel costs are
enabled by two sections: (i) annual rate of road-fuel
consumption in the country, which will be 29.416
10^9Liters in Italy in 2018 and it was 30.408
10^9liters in 2015. It is multiplied with Fuel
consumption constant which is 10 in the calculation
and these all numbers are divided by fuel
consumption factor. This factor is decided by Lam
Formula and its default value is 0.0075. (ii) Second
section is calculated by the multiplication of annual
rate of country-fuel consumption which is 29.416
10^9Liters in Italy in 2018 and fuel consumption
unit rate. Fuel consumption unit rate is decided by
fuel volume type (net or gross) and fuel type
(gasoline or diesel). It is 0.189 €/litres for diesel and
0.185 €/litres for gasoline.
Next, time cost (43) is calculated by vehicle
mileage calculated in road subsystem (40) is divided
by speed function (38).
Finally, emission cost (42) is calculated with the
multiplication of total fuel consumption in the roads
which is 29.416 10^9Liters in Italy in 2018,
emission cost unit rate, emission constant (9.54 for
gasoline and 9.45 for diesel) and emission factor.
Emission cost unit rate is reviewed via CO2 and
NOx. CO2 unit rate is 0.205 €/1kg-CO2 when Nox
price is announced by European Commission
ExternE programme. Finally emission factors are
provided by emission handbooks.
3.3 Infrastructure System Cost (32)
Infrastructure system cost which is defined in Figure
4 is formulated in f3.
ISC =
)
1))1((
)1(*
(
−+
+
bt
bt
dr
drdr
*OSc*np)+Tc
(f3)
In f3, ISC is infrastructure system cost when OSc
describes the overall system cost. Next, np is the
number of PSAP while Tc is the training costs of
emergency service workers. By the way, dr is
discount rate and bt is the depreciation period.
Discount rate is assumed as 3% when depreciation
period is about 8 years.
Numbers of PSAP calculations are explained
with NENA Standarts which describes the
population 0-19000 with small size PSAP, 19000-
100000 with Medium size PSAP and 100000-
140000 with large size PSAP. In addition, The
author calculation with the data support of NENA
standards and its membership report shows that
small size PSAP includes the workers between 7 and
11, medium size PSAPs include the workers
between 12 and 20, and large size PSAPs include the
workers between 21 and 50. With these information,
total population of Italy which is 61.336 Million is
rated via being county and city; then current np in f3
(56.1) is calculated. Moreover, total call events due
to the accidents after ecall equipped vehicle
regulations are enabled by IRTAD road-accident
annual report 2014 for Italy to decide the newcomer
calls due to the accidents; and then these events
enable to calculate new PSAP numbers (next
generation np) and PSAP worker numbers (npw).
Italy road accidents in 2012 are 186726 in the report
and these events are rated with author calculation to
decide the number of new PSAP and its workers in
Italy. As a conclusion, number of PSAPs and
number of PSAPs’ workers in the current system
and in next generation system are calculated with
population of Italy (56) and accident-events (57) in
IRTAD road safety annual report with the author
calculation.
PSAP training costs (Tc) are measured with the
unit costs of EU-Expenses which enable the unit
costs of meals, accommodations and travels. The
unit costs are multiplied with number of PSAP
workers (npw) and results are defined for total cost.
OSc in f3 which is defined in Figure-6 is
explained with its 8 subsystems. Administrative
costs are decided by the conversion of number of
eCall events (nce) to number of PSAP workers
(npw). ‘nce’ is 186726 in IRTAD 2014 report which
is 2012 data. ‘npw’ conversion is created by author
calculations with the process mentioned after f3.
Administrative costs are in f4.
Ad = (npw*Lc*wh*(nad+ntd))+msc (f4)
Cost Model Approach for Next Generation Emergency Call Systems - Italy Case Study
135
In f4, Ad is the administrative costs, npw is the
number of PSAP workers, Lc is the hourly labour
cost, wh is the working hour, nad is the number of
available days, ntd is the number of training days
and msc is the membership prices in Italy.
Map and Data Layer Costs (51) in OSc includes
the software prices of call takers’ and dispatchers’
computers. It includes purchase costs, map-upgrade
costs, replacements and software maintenance costs.
Network costs (52) in OSc are the frame relay
network, its equipment and terminal line costs.
UPS Costs (55) in OSc covers uninterrupted
power supply modules of PSAPs which has the costs
of module hardware and its maintenance.
Wireless communication costs (53) in OSc
include wireless equipments, wireless service
charges, databases, pseudo automatic number
identification charges and accuracy testing.
PSAP Circuit and Facility Costs (50) in OSc is
contented by emergency call-event costs and office
costs if there is any new-opened offices. Unit costs
of events in a minute is rated between 0.3 € and 0.6
€ when the wrong calls are between 0.1 € and 0.2 €.
Nevertheless, workstation places are calculated with
the unit costs of 400 € and 600 € per m^2 for EU-
Countries with the supporter data of NENA member
state report. Moreover, workstation areas are defined
between 34 to 76 m^2 per small size PSAPs, 85 to
380 m^2 per middle size PSAPs and 340 to 969 m^2
per large size PSAPs.
3.4 Cost Model Simulation Results:
Possible next Generation
“Emergency Calls EROs Handling”
Model, Italy
All architectures and cost models are analysed in
Matlab/Simulink environment with the related
properties: (i) fuel types are investigated by being
diesel or gasoline (ii) fuel volume is net volume, (iii)
emission standards are EU-6, (iv) eCall event time
duration between 1.5 minute and 2 minutes, (v)
driver reaction in the accident probability between
0.5 second and 3 seconds, (vi) fuel consumption
parameters via Lam Formula, (vii) unit price of ecall
components between 100 € and 150 € with 8 years
bt and 3 % dr, (viii) PSAP bt is 20 years with 3 %
dr, (iix) working hour rates between 8 and 12 hour,
(ix) worker cost calculations with EU-agency rules,
(x) unit costs are rated by NENA membership
reports, (xi) equipment rates are measured with
ACEA rates, (xii) Country populations are loaded
from World Bank real data, (xiii) transportation is
analysed with being good or passenger for all type of
vehicles, (xiv) simulation is analysed with the year
2018 data (xv) all type of ways (rural, urban and
motorway) are analyzed with all type of injuries;
slight, severe and fatality.
Simulation in Matlab/Simulink environment is
studied in three subgroups:
Status in Urban Way with Slight Injuries in Italy
Status in RuralWay with Severe Injuries in Italy
Status in Motorway with Fatalities in Italy
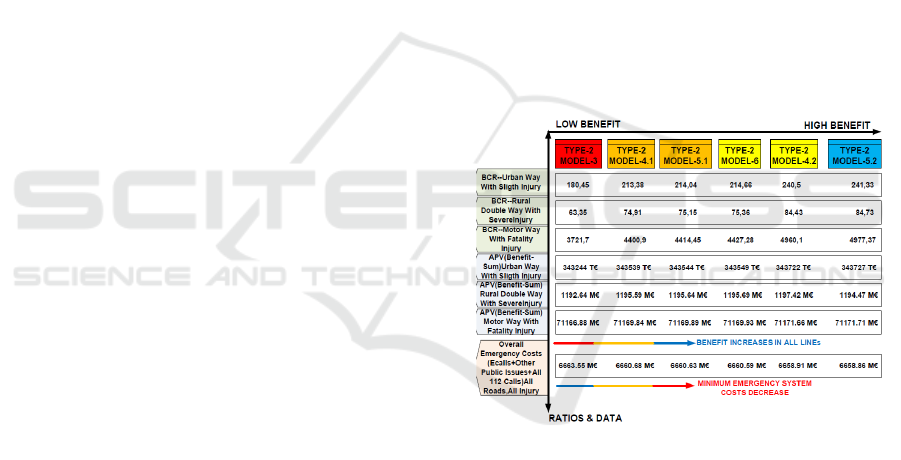
In Figure-7, next generation architectures which
are explained in Part-2.3 in Figure-3 are studied in
the simulation in Matlab/Simulink environment.
With its simulation results, they are sequenced with
respect to their benefits and low system costs. BCR
is the benefit to cost ratio and analyzed for all three
subgroups. APV is the annuity Present Value defines
the net benefit for new eCall notification system.
APV is the calculation of whole benefit in the
system described in Figure-4. The last section of
Figure-7 is the overall system costs which define the
costs of current status in Italy emergency services
and the new architecture units’ annual cost.
Figure 7: Simulation Results of Architecture Cost Model.
In Figure-7, BCR and APV values for three
subgroups has the best value in Type-2 Model-5.2.
Type-2 Model-4.2 is the second option of next
generation architecture for “Emergency calls EROs
handling” in Italy. Next, Type-2 Model-6 can be the
third alternative to apply. Benefit to Cost Ratio is
changing between 180 and 241 for slight injuries in
urban ways when it is between 63 and 84 for severe
injuries in rural ways. Moreover, benefit to cost ratio
is high as between 3721 and 4977 for fatalities in
motorways which shows the importance of saving
life and the difference of accident cost unit rates
described in Part-3.2. When APV is changing
between 343244 T€ and 343727 T€ in urban ways, it
is between 1192.64 M€ and 1194.47 M€ in rural
VEHITS 2016 - International Conference on Vehicle Technology and Intelligent Transport Systems
136

ways. Next, it is between 71166 M€ and 71171 M€
in motorways. On the other hand, overall emergency
costs are between 6663.55 M€ and 6658.86 M€ in
all hands. (T€=10^3 €, M€= 10^6 €)
As a conclusion, Italy can choose the next
generation architecture with the sequence below:
(i)The best option: Type-2 Model-5.2; (ii) 2
nd
Option: Type-2 Model-4.2; (iii) 3
rd
Option: Type-2
Model-6; (iv) 4
th
Option: Type-2 Model-5.1; (v) 5
th
Option: Type-2 Model-4.1 (vi) Worst- option of
these optimal six architectures: Type-2 Model-3.
4 CONCLUSION & FUTURE
WORKS
This paper advises the optimal solution of next
generation architecture for “Emergency Calls EROs
Handling” Model. Its architecture selection is
described in Part-2.3 in Figure-3 and cost model
simulation results are explained in Figure-7. Its
optimal solution is Type-2 Model-5.2 in Italy after
ecall equipped vehicle regulations in 2018.
Future work can describe the next generation
eCall system architectures of other EU-Countries to
give an advice for the optimal architecture selection.
Future work can make deep-dive on the response
and dispatch types with the simulation of call-taker
and dispatcher behaviour. This type of study enables
to see the time and life saving rates in details.
REFERENCES
OECD, 2014, “IRTAD Road Safety Annual Report,
2014”, pp.-13-15; pp.-281-290
ERTICO, 2014, “Harmonised Ecall European Pilot Final
Report 1”, HeERO Project, pp-29-30.
REA Agency, 2015, ‘Policy for Travel Expenses’,
European Commission Research Directorate General
pp.2
‘EENA Standarts’, http://www.eena.org/pages/ng-
112#.VoI47-iLTIU accessed 29 December 2015
L. R. Kimball, 2011, “Next Generation 9-1-1 Cost
Analyses”, State of Oregon Office of Emergency
Management, pp-20-28.
Johannes Abele, Christiane Kerlen, Sven Krueger, 2005,
“Exploratory Study on the potential socio-economic
impact of the introduction of Intelligent Safety
Systems in Road Vehicles” VDI,VDE,IT-IfV Köln,
pp-25, 69.
D. P. Bowyer, R. Akçelik, D. C. Biggs, 1985, ARRB
Transport Research Ltd. “Guide to Fuel Consumption
Analysis for Urban Traffic Management”, pp.28-30.
‘Continental, Worldwide Emission Standarts and Related
Regulations March 2015 Passener Cars, Ligth and
Mediun
DutyVehicles’http://www.contionline.com/www/downloa
d/automotive_de_en/general/contact_services/downloa
ds/commercial_vehicles/powertrain/common/pow_emi
ssion_booklet_pdf_en.pdf accessed 28 December
2015
ACEA, 2004, “New PC registrations by country,
Historical series 1990-2004”
L. R. Kimball Agency, 2012, ‘Consolidation Feasibility
Study’, Office of Statewide Emergency
Telecommunications State of Connecticut
Russ Russell, 2003, ‘SME 911 Consulting - PSAP
Stuffing Guidelines Worksheet: PSAP Requirements-
NENA Standarts’ http://www.nena.org/?page=
Standards. pp.1-4.
André, M./Hammerström, U./Reynaud, I.,1999, “Driving
Statistics for the Assessment of Pollutant Emissions
from Road Transport” Inrets,Bron,Report LTE
9906,pp.170-172.
Kristian Bodek, John Heywood, March 2008, ‘Europe’s
Evolving Passenger Vehicle Fleet: Fuel Use and GHG
Emission Scenarios through 2035, MIT Laboratory for
the Energy and Environment, pp.29-31.
Shane B. McLaughlin, 2007, ‘Analytic Assessment of
Collision Avoidance Systems and Driver Dynamic
Performance in Rear-End Crashes and Near-Crashes’
PHD Thesis, Virginia Polytechnic Institute and State
University
E-MERGE Project,2004, “Cap Gemini Ernst & Young, E-
MERGE Compiled Evaluation Results, Deliverable
6.3.”
‘Italy Population Rates-County and City population data’
http://www.citypopulation.de/Italy.html Accessed 5
January 2016
‘European Commission ExternE programme’
https://ec.europa.eu/research/energy/pdf/kina_en.pdf
accessed 29 December 2015
‘Italy Road Rates - The World Factbook Publications’
https://www.cia.gov/library/publications/the-world-
factbook/fields/2085.html ; accessed 29 November
2015
EU Parliament and Council of EU, 2015, ‘REGULATION
(EU) 2015/758 OF THE EUROPEAN PARLIAMENT
AND OF THE COUNCIL’, Office Journal of the
European Union, 29 April 2015, pp. L123/77-L123/89
European Commission, 2003a, “Extended impact
assessment of the proposal for a decision amending
Decision No 1692/96/EC on the trans-European
transport network”, Commission Staff Working Paper,
SEC-2003 1060, Brussels 01.10.2003.
Cost Model Approach for Next Generation Emergency Call Systems - Italy Case Study
137
