
Unveiling Political Opinion Structures with a Web-experiment
Pietro Gravino
1
, Saverio Caminiti
2
, Alina Sˆırbu
3
, Francesca Tria
1
, Vito D. P. Servedio
2,4
and Vittorio Loreto
1,4
1
Institute for Scientific Interchange Foundation, Via Alassio 11/c, 10126, Turin, Italy
2
Institute for Complex Systems (ISC-CNR), Via dei Taurini 19, 00185 Roma, Italy
3
University of Bologna, Dept. of Computer Science and Engineering, Bologna, Italy
4
Sapienza University of Rome, Physics Dept., P.le Aldo Moro 2, 00185 Roma, Italy
Keywords:
Opinion Dynamics, Web-experiment, Politics.
Abstract:
The dynamics of political votes has been widely studied, both for its practical interest and as a paradigm of
the dynamics of mass opinions and collective phenomena, where theoretical predictions can be easily tested.
However, the vote outcome is often influenced by many factors beyond the bare opinion on the candidate,
and in most cases it is bound to a single preference. The voter perception of the political space is still to be
elucidated. We here propose a web experiment (laPENSOcos`ı) where we explicitly investigate participants’
opinions on political entities (parties, coalitions, individual candidates) of the Italian political scene. As a main
result, we show that the political perception follows a Weber-Fechner-like law, i.e., when ranking political
entities according to the user expressed preferences, the perceived distance of the user from a given entity
scales as the logarithm of this rank.
1 INTRODUCTION
In the United States hundreds of millions of
dollars are yearly spent for presidential cam-
paigns (Buchanan, 2004), but the very mechanisms
through which public opinion can be succesfully in-
fluenced are not fully understood. Politics is a uni-
versal topic of conversation. People express opin-
ions, try to convince their interlocutors, build them-
selves their believes under the influence of a variety
of factors, with different degrees of rationality (Za-
ller, 1992; Bartels, 2010; Kahneman, 2011; Ben-
dor et al., 2011; Antonakis and Dalgas, 2009). In-
formation from mass media and political campaigns
strongly influence the debate, and often in an impre-
dictable way (Berelson et al., 1954; Buchanan, 2004).
More at the core of the question, people perception
of politics and political subjects follows laws that are
largely to be uncovered. Due to the practical as well
as theoretical interest in the understanding of politi-
cal opinion dynamics, available data have been stud-
ied seeking for universals (Chatterjee et al., 2013) and
experiments have been proposed aiming to highlight
different mechanisms influencing voters opinions on
candidates (Todorov et al., 2005). Also, models of
opinion dynamics inspired from statistical physics,
which analyse the mechanics of opinion formation,
have been proposed recently (Sirbu et al., 2013b;
Castellano et al., 2009; Sirbu et al., 2013a). How-
ever, comprehensive and focused databases of politi-
cal opinions are lacking. While in fact political elec-
tions outcomes constitute precious databases to inves-
tigate voters behavior (Borghesi and Bouchaud, 2010;
Hummel and Rothschild, 2013), the real opinion of
voters may be hidden by many different factors, as
for instance tactical voting (Arajo et al., 2010) and
limitations imposed by the election rules. Moreover,
the electoral system usually allows the expression of
a single positive vote per elective assembly, so that
individuals are called to compress all their interpreta-
tion of the political landscape in a single preference.
Most importantly, voters are bound to express positive
votes, so that only approval and not disappointment
can be directly expressed. For all these reasons, elec-
tions outcomes only partially represent voter opinions
and the study of the political perception of citizens has
to rely on different kinds of data.
Here we propose an experiment aiming at over-
coming these limitations, providing a more complete
picture of the political perception and allowing in this
way a quantitative analysis of the complex structure
of individuals opinions. In particular, following a
Gravino, P., Caminiti, S., Sîrbu, A., Tria, F., Servedio, V. and Loreto, V.
Unveiling Political Opinion Structures with a Web-experiment.
In Proceedings of the 1st International Conference on Complex Information Systems (COMPLEXIS 2016), pages 39-47
ISBN: 978-989-758-181-6
Copyright
c
2016 by SCITEPRESS – Science and Technology Publications, Lda. All rights reserved
39

general trend emerged in the last few years, where
web-games are adopted as interesting laboratory to
run experiments in the social sciences (Howe, 2006;
Lazer and et al., 2009; Salganik and Watts, 2009; Suri
and Watts, 2011), we propose a web experiment in
which people are directly called to express their opin-
ions on political subjects. The data gathered with the
laPENSOcos`ı experiment reflect the general negative
sentiment the italian population has towards its polit-
ical class. More interestingly, we found that opinions
follow a distribution compatible with an exponential
distribution, with a negative coefficient whose abso-
lute value decreases with the level of optimism, but
that remains almost constant across different politi-
cal orientations. This result strongly recalls a well
known law linking stimuli and perception, i.e., the
Weber-Fechner law. This law has been observed in
several situations involving physical perceptions, e.g.
light brightness (Hecht, 1924) or noise intensity, and
also in other less tangible contexts, e.g. numerical
cognition (Dehaene, 2003; Nieder and Miller, 2003)
and more recently in the subjective perception of the
quality of a service (Reichl et al., 2010; Egger et al.,
2012). The presence of a Weber-Fechner-like law in
political perception is a novel aspect. This finding
could foster other experiments in this direction and
can have a profound impact on the way models of
opinion dynamics are constructed.
2 RESULTS
2.1 The Experiment
In the last few years the Web has been progressively
acquiring the status of an infrastructure for social
computing that allows researchers to coordinate the
cognitive abilities of users in online communities, and
to suggest how to steer the collective action towards
predefined goals (Howe, 2006; Suri and Watts, 2011;
Salganik and Watts, 2009; Fischer and et al., 2012;
Gravino et al., 2011). Web games prove to be partic-
ularly fruitful whenever the peculiar human computa-
tion abilities are crucially required for research pur-
poses (von Ahn and Dabbish, 2004; von Ahn, 2006;
Schawinski and et al., 2010; Cooper and et al., 2010;
Khatib and et. al, 2011). The laPENSOcos`ı experi-
ment takes advantage of the Experimental Tribe
1
plat-
form for web-based experiments and social computa-
tion (Caminiti et al., 2013; Cicali et al., 2011).
In the laPENSOcos`ı
2
experiment, people were
1
freely available at http://www.xtribe.eu
2
still available at http://www.lapensocosi.it
called to express their opinion on political subjects,
including single candidates, parties and coalitions.
Opinions are expressed by means of a real number
in the interval [−1,1], negative numbers expressing
disapproval. Subjects were randomly presented from
a pool composed by the 160 most famous italian
politicians, parties and coalitions. Data were gath-
ered from middle of January 2013 to the early days of
March 2013, exploiting the italian political elections
that took place on 24-25th February 2013. We here
present results on 39154 opinions expressed by 1038
users, corresponding to the data gathered in the last
version of our experiment (refer to the Section 3 for
details). People were free to assign to each of the ran-
domly presented political subject a vote in the inter-
val [−1,1]. The actual normalization of the interval
is arbitrary and does not affect generality, while its
extension over a range of both negative and positive
values allows people to express both disapproval and
approval in a straightforward way. A possibility to
abstain is also given, together with a direct link to the
wikipedia page describing the politician or the party
under evaluation, in the case it would be unknown to
the user. As an additional information, the user can
also leave an explicit comment on the political entity
they are called to judge. A snapshot of the game is
given in Fig. 1, while for a detailed description we
refer to the Method section.
2.2 Outcomes
A first portrait of the perception of the political world
can be drawn by measuring the distribution of the
opinions in the whole dataset, referred to any polit-
ical subject and expressed by any user.
This distribution is reported in Fig. 2, showing the
average opinion on any political entities being signif-
icantly negative (the mean value of the distribution
being −0.472). This simply corresponds to the gen-
eral negative perception of politics. The distribution
shows peaks at the extremes (value −1 and +1) and
of the center (the zero value) of the interval, with the
highest peaks at the extremes. The peaks can be eas-
ily explained as due in part to a natural tendency of
extremization, and to the visually attractive effect of
extremes and natural numbers, and more in particular
as an effect of the visualization of the voting interval.
More interestingly, the distribution between the peaks
seems to follow an exponential law, decreasing when
the opinion value is growing.
This behavior reminds of a general property of
perception, the Weber-Fechner law, which states that
the perception is proportional to the logarithm of the
stimuli. In our context, for each user we can rank the
COMPLEXIS 2016 - 1st International Conference on Complex Information Systems
40
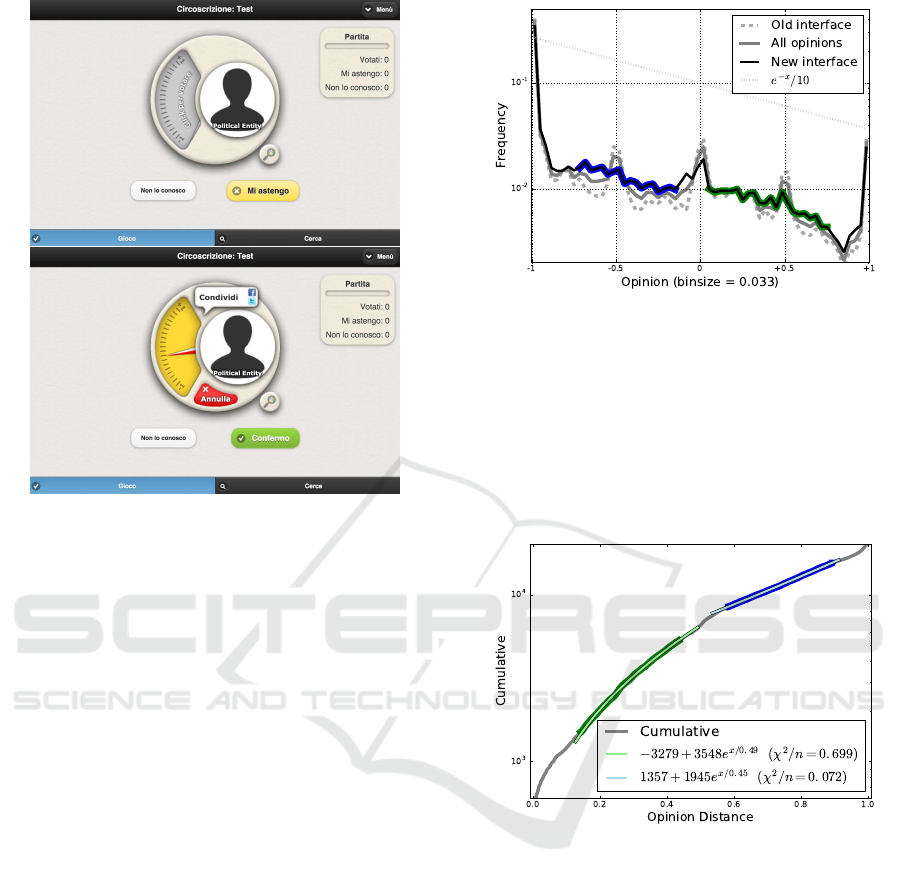
Figure 1: Two screenshots of the last version of the inter-
face, before (top) and after (bottom) the interaction. Users
were prompted with a photo of a politician or a party logo
and were asked to use the scale on the left to express their
opinions.
political subjects according to the appreciation they
expressed on them, from the most esteemed to the
most unappreciated. We can thus interpret the posi-
tion in this rank as a sort of distance between the user
and the given political subject. This allows to directly
interpret the exponential form of the opinion distribu-
tion in terms of the Weber-Fechner law.
We can define this opinion “distance” as x
p
=
(1 − o)/2, where o is the opinion expressed by the
user in [−1, +1]. To support the hypothesis of the ex-
ponential, we performed a fit on the areas of interest
(blue and green part of the curve in Fig. 2). In order
to have a less noisy curve we converted opinions in
distances and used the cumulative distribution repre-
sented in Fig. 3.
To perform a χ
2
test we estimated the error for
the cumulative distribution as the 1%. The results
are strongly supporting the compatibility with an
exponential-like law.
In order to more deeply investigate this phe-
nomenon, we looked at the robustness of the opinion
distribution against political orientation of the users
and against their optimistic or pessimistic attitude, as
signalled by the average of the individual opinion dis-
tribution (refer to Section 3 section for more details).
Results are reported in Figures 4 and 5 respectively,
showing how the form of the distribution remains sta-
Figure 2: The histogram of the opinions expressed by users
in semilog scale. In black, the histogram relative to data
gathered with the last version of the interface. We high-
lighted in blue and in green the exponential-like parts, that
appear linear in semilog scale. A simple exponential is re-
ported as a reference. Also, it is reported the histogram of
the dataset obtained with the old interface (gray, dashed)
and the histogram of the whole dataset (gray). With the old
interface, peaks at -0.5 and +0.5 emerged as a consequence
of major ticks in the scale where users expressed their opin-
ions.
Figure 3: The gray curve represents the cumulative distribu-
tion of opinions in the distance space. In green and in blue
the area of interest already highlighted in Fig. 2. In light
green and in light blue we reported the exponential fits. In
the legend we can see the results of the χ
2
test. Relative
errors have been estimated to be ∼ 1%.
ble against subsampling of the population. Interest-
ingly, when subsampling the population according to
the individual level of optimism, the exponent of the
exponential law appears to be directly related to the
degree of optimism, its absolute value increasing with
optimism.
We note that the distributions considered so far
are aggregated distributions of many users, while the
Weber-Fechner law refers to the perception of each
individual. It is thus important to show that the aggre-
gate distribution well reflects an individual property.
This point is addressed in Section 3, where we report
Unveiling Political Opinion Structures with a Web-experiment
41
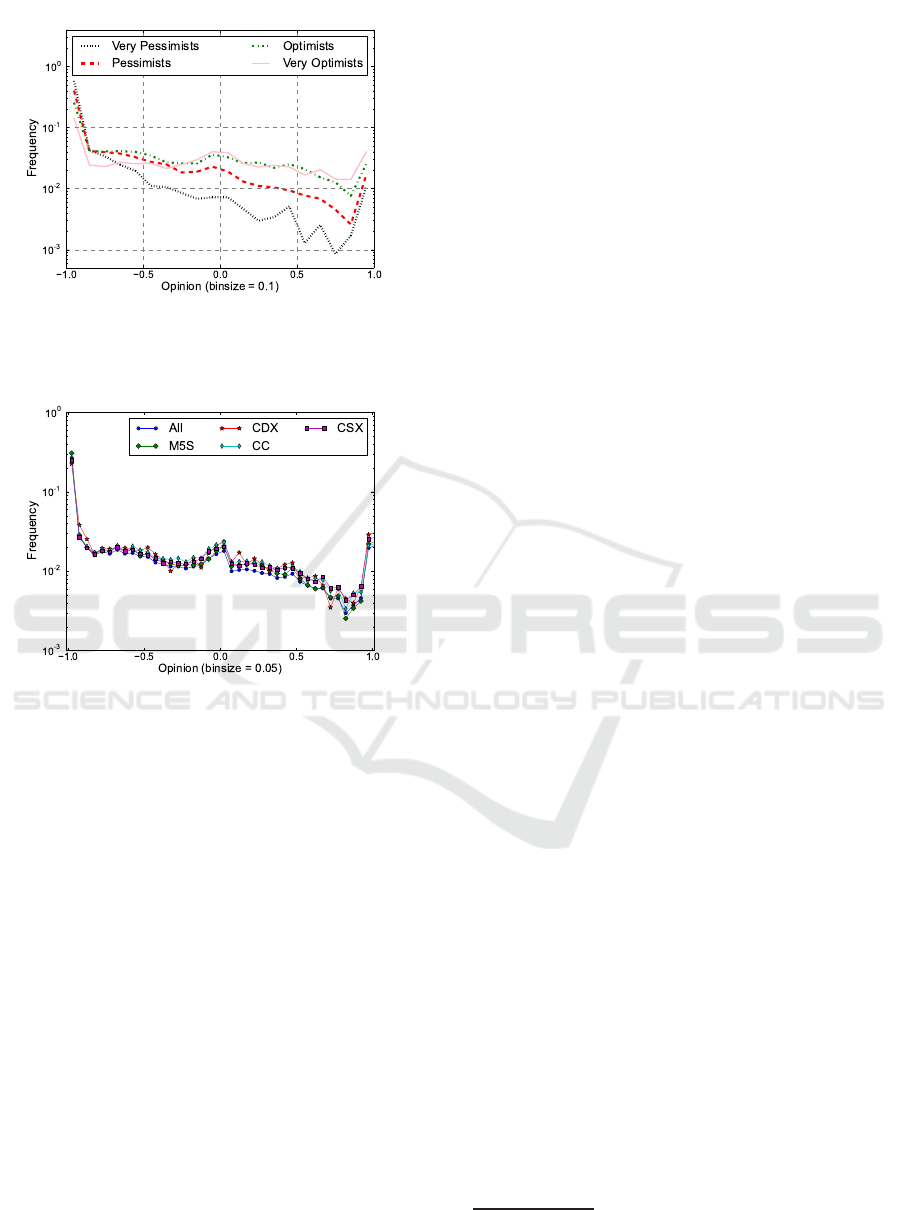
Figure 4: Histograms of the opinions for 4 subsets of users,
divided according to their level of “optimism”, i.e. the user
average opinion.
Figure 5: The histogram of the opinions weighted consid-
ering 4 different “points of view” relative to the 4 poles of
Italian politics. Each histogram is calculated by weighting
each user opinion with the user average opinion distance
from the entity of the given pole.
that both individual and collective opinion structures,
reported in Fig. 8, show some slight differences that
disappear if we disaggregate the set depending on the
level of optimism of the user. In other words, if we
consider groups of users with the same level of opti-
mism, the individual opinion distribution is fairly sim-
ilar to the collective one. Finally, we built a graph
representation of the political space. Each time a user
provides opinions about two or more entities, they are
actually defining a distance amongst them. By aver-
aging the distances provided between all the pairs of
entities we created a graph in which nodes are the en-
tities and the weight of links are the inverse of these
distances. The result is reported in Fig. 6 (we tried
several spacial disposition algorithms finding similar
results). Colors represent different coalitions and the
relative clustering spontaneously emerge as a natural
consequence of the spacial disposition according to
links weight. This network representation points out
the distance between traditional left-wing and right-
wing parties, and the middle position of center mod-
erate parties. Furthermore, the perception of the novel
political force (at the time of the elections consid-
ered) “Movimento 5 Stelle” is accurately reproduced
and perceived as new and different from all the oth-
ers. Fig. 6 reproduce the actual overview of the Ital-
ian political landscape. The accuracy in the portrait is
a very interesting result stemming from a completely
bottom-up elaborated representation.
3 Methods
3.1 laPENSOcos
`
ı
Experimental Tribe (XTribe in short)
3
, is a general
purpose platform to help researchers to realize web
games/experiments with a very small coding over-
head. We released the laPENSOcos`ı
4
experiment
hosted on the XTribe portal in the middle of January
2013. In the default mode (named “Modalit`a Gioco”,
Game Mode, GM in the following), subjects were
presented randomly 20 political entities to be rated
from a pool composed by the 160 most famous ital-
ian politicians and all existing parties. Users could
also check the list of candidates (in List Mode, LM)
or use a search engine. We focused on the dataset ob-
tained in GM because in LM users tended to evaluate
their preferred entities. Aiming at a representation of
the political space, the random sampling obtained in
game mode represents a more effective choice. The
experiment exploited the hot topic of political elec-
tions in Italy at the end of February 2013 (24-25th
February 2013). At the early days of March 2013 the
experiment gathered in Game Mode 81,508 opinions
expressed by 1,727 users, on our pool of 160 political
subjects. In Fig. 7 we reported the daily number of
opinions, users and sessions of play.
For the analysis presented in this paper (except
the gray dashed curve in Fig. 2), we considered only
data gathered with this last version of the interface.
This interface has been introduced at the beginning
of February 2013 and 39,154 opinions were gathered
thanks to 1,038 users. Data obtained with the pre-
vious interface were discarded because the interface
introduced an optical bias: in the opinion scale, major
ticks at -0.5 and +0.5 attracted the attention so that the
opinion distribution, reported in Fig. 2, shows peaks
at -0.5 and +0.5.
3
http://www.xtribe.eu
4
http://www.lapensocosi.it
COMPLEXIS 2016 - 1st International Conference on Complex Information Systems
42
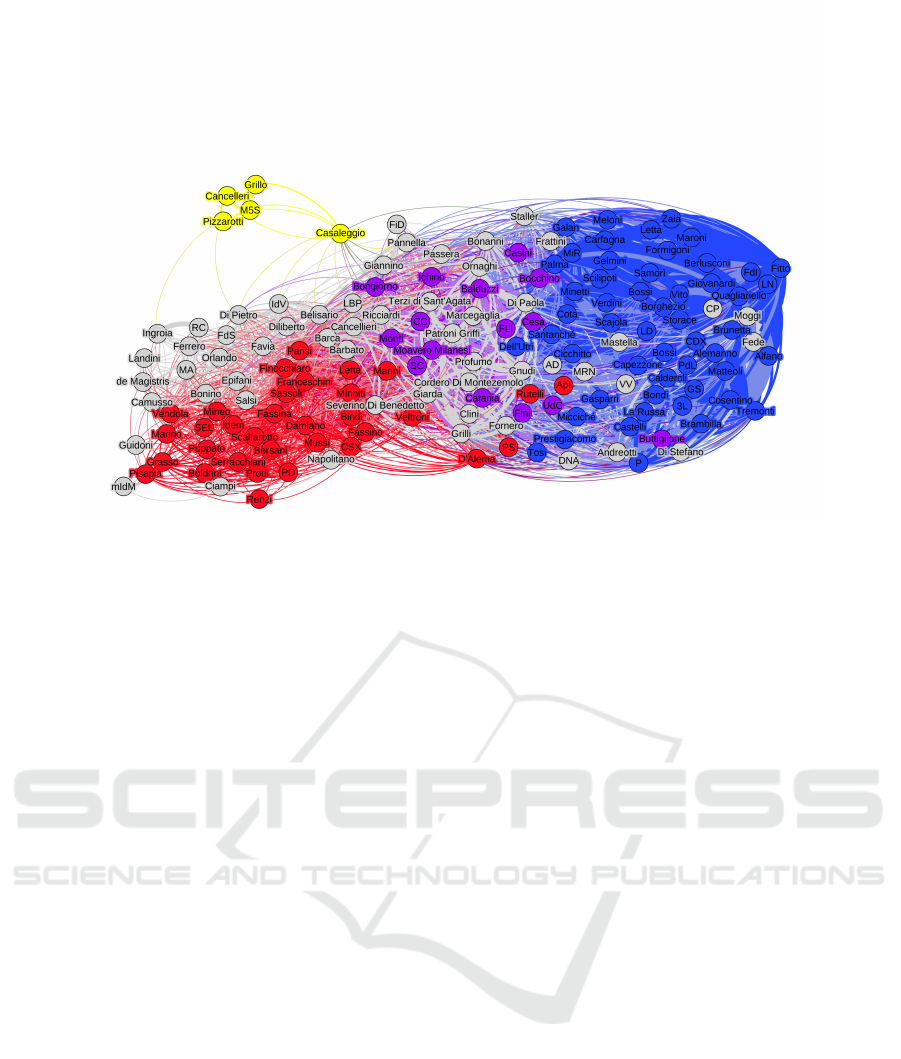
Figure 6: The graph of italian political entities immediately before February 2013 political elections. Nodes are coloured
according to the coalition: red for left-wing coalition, blue for right-wing coalition, purple for center coalition and yellow for
Movimento 5 Stelle (M5S), a novel formation not belonging to a coalition. The color clustering spontaneously emerges by
imposing distances between entities obtained by averaging those defined by users opinion.
3.2 Reliability of the Data
The data gathered with the experiment correctly re-
produce the italian political scene, in terms of rela-
tions between political subjects, as visible in Figure
6. The accuracy of the reproduction is an indirect val-
idation of the dataset, since the aim was to measure
the political opinion structure and not the forecasting
of the elections outcome.
3.3 Recruitment
In order to make the experience possibly viral, we im-
plemented some social sharing functionalities, allow-
ing users to publish their opinion on Facebook and
Twitter, advertising the experiment. Furthermore, to
improve the user experience enjoyability, the request
for opinions has been formulated in the shape of a
“personality test”: after each session of evaluation
(which consisted in 20 evaluation rounds) the user re-
ceived a profile describing them. According to the
average value of opinion in the session the user was
classified as an optimist (high average) or a pessimist
(low average). Also, depending on the value of the
standard deviation of session opinions, the user was
labeled as an extremist (high standard deviation) or a
moderate (low standard deviation). The result of the
test was sharable on Facebook or Twitter, in order to
attract other to discover their profile.
3.4 Optimists and Pessimists
We divided the population in 4 parts according to
users average opinion: the quarter with the highest av-
erages has been considered “very optimist”, the quar-
ter with the highest average above the remaining has
been considered “optimist”, and so on. Then we cal-
culated the opinion distribution for the 4 subpopula-
tion. The result is shown in Fig. 4. It appears clearly
how the whole structure is coherent with an exponen-
tial law: the only thing changing seems to be the coef-
ficient of the exponential regression. This highlights
the importance of the exponential law and also points
out that the exponent can be considered a measure of
the “structural optimism” about political perception.
In fact, differently from the optimism defined as the
simple average of the opinions of a given user, the ex-
ponent gives us more information. Obviously, from
an higher exponent follows an higher average but also
a different opinion structure, with deep consequences
in terms of resolution in the comprehension of polit-
ical entities relations, as we will see in the following
sections.
3.5 Political Points of View
As anticipated in Section 2, we tested also the dis-
tribution stability against differences in the political
point of view of the considered population. The ital-
ian political forces scheme can be divided in four
main political factions: the center-right coalition (will
be indicated as CDX); the center coalition (CC); the
center-left coalition (CSX); the Movimento 5 Stelle
party (M5S). Since in this case there is no clear dis-
tinction we managed to define, for each user, an ag-
gregated opinion (agg. op. in the following) about
each one of these poles. These opinions have been
used to weight all other opinions while recalculating
the opinion distribution. In other words, to get the
opinion distribution of the CDX supporter we used
Unveiling Political Opinion Structures with a Web-experiment
43
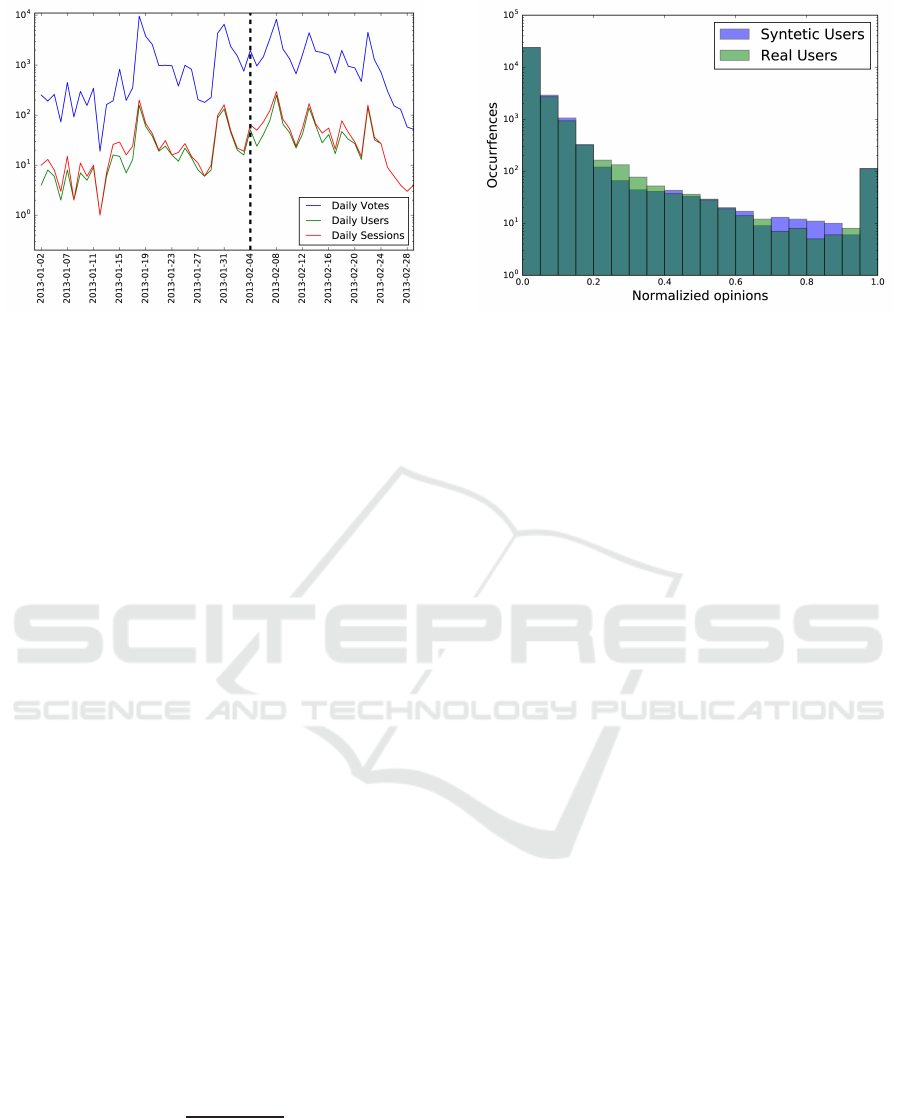
Figure 7: The daily number of opinions, users and session
of play.
the agg. op. about CDX of each user to weight his/her
opinions, so that, for example, if a user had a CDX
agg. op. = +1 then his/her opinions were considered
normally while if CDX agg. op. = −1 then his/her
opinions were not considered at all. The result of this
analysis are the four front weighted distributions that
are reported in Fig. 5. It is clearly visible how all the
distributions are fairly compatible. This graph sug-
gests that the opinion distribution we measured and
showed in Fig. 2 is a quite robust feature. Again, in
Fig. 5 we can find the exponential shape (with some
noise due to the reduction of the statistics, conse-
quence of the weighting procedure). Furthermore, the
opinion structure of different voters tends to be simi-
lar even if the political point of view is different (and
even opposite). This interestingly points out a sort of
universality in the perception of the political space.
3.6 Individual vs Collective Opinions
Structure
The opinion distribution shown in Fig. 2, which is one
of the focal points of this paper, is calculated by ag-
gregating all users opinions. It is a collective measure,
but since we want to infer the properties at the individ-
ual level, we had to show that individual and collec-
tive distribution are compatible. To this purpose we
calculated a new distribution of opinions, by rescal-
ing by +1 and by normalizing to 1. In other words,
the new opinions o
′
is defined as follows:
o
′
=
o+ 1
∑
user
(o+ 1)
(1)
where the sum runs on the other opinions of the same
user. This novel set of opinions has been compared
with a syntetic set representing the collective opin-
ion distribution. For each user, we generated a syn-
tetic user with the same number of opinions randomly
Figure 8: The distribution of opinions rescaled and normal-
ized by user, for real users and for a syntetic set of users.
Differences reflect the difference in the opinion structure
between single user and the collective result.
picked from the whole set of opinions, in order to de-
stroy correlations. The histrograms of the real and
syntetic opinions is reported in Fig. 8. The distribu-
tion seems quite similar but some differences emerge.
To those differences we performed the two sample
Kolmogorv-Smirnov test, for 100 random sampling,
finding p-value= 0.065±0.078which gives a quanti-
tative measure of the differencebetween the collective
and individual distribution. This points out that the
global aggregation is imperfect to represent individ-
ual behaviour. Some level of disaggregation should
be introduced. We already reported about the impor-
tance of the optimism level so we used this parame-
ter to disaggregate. We divided the population in two
sets, according to the user level of optimism. Thus we
performedagain the same analysis on the two separate
sets. The KS test showed a more high p-value in both
cases: 0.096 ± 0.072 and 0.289 ± 0.119. From these
analysis we can state that individual behaviour can be
in first approximation represented by the collective
behaviour but disaggregating by optimism level im-
proves strongly the compatibility between the single
user opinion structure and the global one.
3.7 The Emergence of Weber-Fechner
Law
3.7.1 The Opinion Space
In this paragraph, we shall provide the interpretation
of the exponential law observed in Fig. 2. In order to
understand the implication of the exponentials, let us
try to reformulate our problem. To simplify, we will
consider a bounded space, an opinion space, whose
distribution follows just an exponential law. In the
opinion space, each user can place political subjects
COMPLEXIS 2016 - 1st International Conference on Complex Information Systems
44

according to their perception. Our experiment asks
for opinions between −1 and +1 but we can also
translate these opinions in some sort of distance per-
ceived by the user. In this framework, entities near
+1 can be considered as perceived near the user while
those entities near −1 can be considered as far from
the user, according to his perception. We can thus say
that users assign to each entity a coordinate in this per-
ceptual space, that we will call x
p
(i) (as we already
did in Section 2, for entity i). Without loss of general-
ity, we shift and normalize the range of the perceptual
space to the interval [0,+1], whereas 0 corresponds to
opinion +1 and 1 corresponds to opinion −1. The ex-
ponential law we measured in Fig. 3 represents, in this
framework, the density of the political subject in the
perceptual space. We can then express the perceived
density as an exponential with a proper normalization
in the following way:
ρ
p
(x
p
) =
e
x
p
λ
e
1
λ
− 1
(2)
where λ is a characteristic parameter of the user (or of
the subset of similar users considered). As we saw in
Fig. 4, this parameter is probably linked to the “op-
timism”. What we described so far is a matter of
perception. The situation is similar to what happens
with our “normal” senses (sight, hearing, touch, etc).
For the five senses, we can measure their efficiency
in mapping reality by knowing how a certain stimu-
lus (or a distribution of stimuli) is translated in our
perception (or in a distribution of perceptions).
In the present case, we measured the perceived
distribution, but what about the stimuli distribution?
We measured the perceived density distribution of a
set of political entities, but how were they distributed
originally? And in what kind of space?
3.7.2 The Rank Space
It is not just a matter of stimuli distribution. If the
sensing process we are considering is a sort of map-
ping, what exactly are we mapping in the opinion
space? From what kind of space the mapping starts?
So far we considered the evaluation process as a sort
of positioning of the entity in the opinion space. Po-
sitioning may also be considered a second order pro-
cess with respect to a ranking process. It sounds rea-
sonable to assume that users have their own personal
rank of the political subjects. In this rank, we can con-
sider the first as the nearest to the user, and the last as
the farthest. While telling their opinion, the user is
basically translating a rank into a position. Thus, we
can define a rank space in which entity are placed,
sorted by their rank. By definition of rank, entities are
simply distributed uniformly, in a discrete sense (one
in each rank position). Even if the rank space discrete
by definition, in order to analyze the mapping, we will
consider it as a continuous space, in which x
r
(i) will
refer to the rank position of the entity i. The bound
of the rank will be 1 and the number of entities N
e
.
As we said, we consider the density as a continuous
uniform density distribution defined as follows:
ρ
r
(x
r
) =
1
N
e
(3)
3.7.3 Mapping and Resolving Power
Now that we have both the perceived and the original
distribution we can find the transformation by impos-
ing that:
ρ
r
(x
r
)dx
r
= ρ
p
(x
p
)dx
p
(4)
This condition is equivalent to require that the trans-
formation from x
r
to x
p
is essentially a bijection, i.e.
to each point x
r
there is one and only one correspond-
ing point x
p
. This assumption is quite reasonable for
a perceptive mapping. In Eq. 4, by substituting Eq. 2
and Eq. 3, we get:
1
N
e
dx
r
=
e
x
p
λ
e
1
λ
− 1
dx
p
dx
r
dx
p
= N
e
e
x
p
λ
e
1
λ
− 1
(5)
and by integrating we obtain:
x
r
=
λN
e
e
1
λ
− 1
e
x
p
λ
(6)
x
p
= λlog
e
1
λ
− 1
λN
e
x
r
∝ logx
r
(7)
Eq. 7 tells us how the rank space is transformed in
the opinion space, i.e. according to a logarithmic law.
This law appears similar to others perception map-
ping law, such that observed for spatial disposition for
natural numbers. To investigate the efficiency of the
mapping, let us consider Eq. 5. If we substitute Eq. 7
we get:
dx
p
=
λ
x
r
dx
r
(8)
which describes how the perception becomes less ef-
ficient when x
r
is growing. In other words, differ-
ences are perceived smaller and smaller as we go far
from the user. Hence it is more difficult to distinguish
among different but far (from the user) entities. Eq. 8
and Eq. 7 strongly recall a well-known law linking
stimuli and perception: the Weber-Fechner law. The
Unveiling Political Opinion Structures with a Web-experiment
45

presence of a Weber-Fechner-like law in political per-
ception is a novel aspect. The emergence of this sort
of “Political Myopia” can have a profound impact on
the way models of opinion dynamics are constructed.
To complete, let us calculate the resolving power. By
considering dx
r
as a fixed parameter ∆x
r
, we can also
find an expression for the opinion space, defining the
resolving power needed to notice a difference ∆x
r
as
a function of x
r
RP(x
r
|∆x
r
;λ;N
e
) =
1
∆x
r
x
r
log
e
1
λ
− 1
λN
e
x
r
. (9)
4 CONCLUSIONS AND
PERSPECTIVES
The laPENSOcos`ı web-experiment aimed to measure
the political opinion structure. By exploiting the hot
topic of Italian political elections of February 2013,
this web application gathered opinions of more than
one thousand users in few weeks. Participants were
asked to express their opinion about political entities
on a continuous scale between [−1,+1], in order to
overcome limitations of usual vote procedure. The
resulting dataset gave us precious insights about how
political entities are distributed in the opinion space.
With a novel bottom-up approach, we managed to re-
produce the relation between italian political entities,
represented by the graph in Fig. 6, in a very accu-
rate way. We also measured the distribution of the
opinions, reported in Fig. 2, unfolding how politi-
cal entities perceptions are distributed. This distri-
bution reflected the main feature of the political sce-
nario in Italy in the early 2013: a general negative
feeling and a strong contrast between political play-
ers, leading to a negative opinion average and peaks
at the extremes. Another interesting feature of the dis-
tribution is an exponential-like shape, which recalls a
known law linking stimuli and perception, the Weber-
Fechner law. The exponential shape has been proved
to appear also by disaggregating and resampling the
dataset, thus seemed to be quite robust, like a sort of
universal law of political perception. Obviously more
experimental confirmations are needed to improve the
robustness of these conclusions. We plan to repeat
the experiment at the next political elections in Italy
and also abroad, in order to check if the exponential-
like opinion distribution shows traits of universality
irrespective of nationality. This can be easily done,
because of the experimental procedure adopted. In
fact, the laPENSOcos`ı web-experiment exploited the
services of the Experimental Tribe platform, a so-
cial computation platform designed to help the im-
plementation of web-experiments. Beside the inves-
tigation of the opinions distribution, new experiments
can also deal with the opinion structure in a dynamical
way, by monitoring a population opinion distribution
over time. This kind of experiments could provide di-
rect informationabout opinion dynamics and precious
hints in the design of new models to analyze political
opinion dynamics.
ACKNOWLEDGEMENTS
We acknowledge support from the KREYON project
funded by the Templeton Foundation under contract
n. 51663. VDPS acknowledges the EU FP7 Grant
611272 (project GROWTHCOM) and the CNR PNR
Project “CRISIS Lab” for financial support.
REFERENCES
Antonakis, J. and Dalgas, O. (2009). Predicting elections:
Child’s play! Science, 323(5918):1183.
Arajo, N., Andrade, J. J., and Herrmann, H. (2010). Tactical
voting in plurality elections. PLoS ONE, 5(9):e12446.
Bartels, L. (2010). The study of electoral behavior. The
Oxford Handbook of American Elections and Political
Behavior, pages 239–261.
Bendor, J., Diermeier, D., Siegel, D. A., and Ting, M. M.
(2011). A behavioral theory of elections. Princeton
University Press.
Berelson, B., Lazarsfeld, P., and McPhee, W. (1954). Vot-
ing: A study of opinion formation in a presidential
campaign. University of Chicago Press.
Borghesi, C. and Bouchaud, J.-P. (2010). Spatial corre-
lations in vote statistics: a diffusive field model for
decision-making. The European Physical Journal B,
75(3):395–404.
Buchanan, M. (2004). How strategists design the perfect
candidate. Science, 306(5697):799–800.
Caminiti, S., Cicali, C., Gravino, P., Loreto, V., Serve-
dio, V. D., Sirbu, A., and Tria, F. (2013). Xtribe: a
web-based social computation platform. In Cloud and
Green Computing (CGC), 2013 Third International
Conference on, pages 397–403. IEEE.
Castellano, C., Fortunato, S., and Loreto, V. (2009). Statis-
tical physics of social dynamics. Reviews of modern
physics, 81(2):591.
Chatterjee, A., Mitrovi/’c, M., and Fortunato, S. (2013).
Universality in voting behavior: an empirical analy-
sis. Scientific Reports, 3.
Cicali, C., Tria, F., Servedio, V. D., Gravino, P., Loreto, V.,
Warglien, M., and Paolacci, G. (2011). Experimen-
tal tribe: a general platform for web-gaming and so-
cial computation. Proceedings of the NIPS Workshop
on Computational Social Science and the Wisdom of
Crowds.
COMPLEXIS 2016 - 1st International Conference on Complex Information Systems
46

Cooper, S. and et al. (2010). Predicting protein struc-
tures with a multiplayer online game. Nature,
466(7307):756–760.
Dehaene, S. (2003). The neural basis of the weber–fechner
law: a logarithmic mental number line. Trends in cog-
nitive sciences, 7(4):145–147.
Egger, S., Reichl, P., Hosfeld, T., and Schatz, R. (2012).
”time is bandwidth”? narrowing the gap between
subjective time perception and quality of experience.
In Communications (ICC), 2012 IEEE International
Conference on, pages 1325–1330. IEEE.
Fischer, D. and et al. (2012). Planet Hunters: The First Two
Planet Candidates Identified by the Public using the
Kepler Public Archive Data. Monthly Notices of the
Royal Astronomical Society, 419:2900–2911.
Gravino, P., Servedio, V. D. P., Barrat, A., and Loreto,
V. (2011). Complex structures and semantics in free
word association. Advances in Complex Systems.
Hecht, S. (1924). The visual discrimination of intensity and
the weber-fechner law. The Journal of General Phys-
iology, 7(2):235–267.
Howe, J. (2006). The rise of crowdsourcing. Wired, 14(06).
Hummel, P. and Rothschild, D. (2013). Fundamental
models for forecasting elections. ResearchDMR.
com/HummelRothschild
FundamentalModel.
Kahneman, D. (2011). Thinking, fast and slow. Macmillan.
Khatib, F. and et. al (2011). Crystal structure of a
monomeric retroviral protease solved by protein fold-
ing game players. Nat Struct Mol Biol, 18:1175–1177.
Lazer, D. and et al. (2009). Social science: Computational
social science. Science, 323(5915):721–723.
Nieder, A. and Miller, E. K. (2003). Coding of cogni-
tive magnitude: Compressed scaling of numerical in-
formation in the primate prefrontal cortex. Neuron,
37(1):149–157.
Reichl, P., Egger, S., Schatz, R., and D’Alconzo, A. (2010).
The logarithmic nature of qoe and the role of the
weber-fechner law in qoe assessment. In Communica-
tions (ICC), 2010 IEEE International Conference on,
pages 1–5. IEEE.
Salganik, M. J. and Watts, D. J. (2009). Web-Based Ex-
periments for the Study of Collective Social Dynam-
ics in Cultural Markets. Topics in Cognitive Science,
1(3):439–468.
Schawinski, K. and et al. (2010). The Sudden Death of the
Nearest Quasar. The Astrophysical Journal Letters,
724(1):L30.
Sirbu, A., Loreto, V., Servedio, V. D., and Tria, F.
(2013a). Cohesion, consensus and extreme informa-
tion in opinion dynamics. Advances in Complex Sys-
tems, 16(06):1350035.
Sirbu, A., Loreto, V., Servedio, V. D., and Tria, F. (2013b).
Opinion dynamics with disagreement and modulated
information. Journal of Statistical Physics, 151(1-
2):218–237.
Suri, S. and Watts, D. J. (2011). Cooperation and contagion
in web-based, networked public goods experiments.
PLoS ONE, 6(3):e16836.
Todorov, A., Mandisodza, A. N., Goren, A., and Hall, C. C.
(2005). Inferences of competence from faces predict
election outcomes. Science, 308(5728):1623–1626.
von Ahn, L. (2006). Games with a purpose. Computer,
39(6):92–94.
von Ahn, L. and Dabbish, L. (2004). Labeling images with
a computer game. In CHI ’04: Proceedings of the
SIGCHI conference on Human factors in computing
systems, pages 319–326, New York, NY, USA. ACM.
Zaller, J. (1992). The nature and origins of mass opinion.
Cambridge university press.
Unveiling Political Opinion Structures with a Web-experiment
47
