
RTTMM: Role based 3-Tier Mobility Model for Evaluation of Delay
Tolerant Routing Protocols in Post Disaster Situation
Nikhil N. Gondaliya
1
and
Mohammed Atiquzzaman
2
1
G. H. Patel College of Engineering & Technology, Gujarat Technological University, Gujarat, India
2
School of Computer Science, University of Oklahoma, Norman, OK 73019, U.S.A.
Keywords: Delay Tolerant Networks, Disaster Mobility Model, DTN Routing Protocols, Internet of Things.
Abstract: In Internet of Things (IoT) the devices are interconnected through Internet with several redundant paths, but
they are still vulnerable to the effects of large scale disasters such as earthquakes and floods. The disaster area
may be disconnected from the rest of the Internet and the need arises to get information about the victims.
Adhoc networks like MANETs and DTNs are most suitable to support the communication in partitioned
networks, such as a network in a post disaster situation. Even an adhoc network becomes one of the essential
network architecture in IoT and attracted lots of attention in the last decade. The disaster affects the several
regions with different intensities called each region as disaster event which are located nearer to each other.
Each disaster event is assigned a group of rescue entities with hand held IoT device, where they perform the
tactical operation. The movement pattern of the rescue entities in a post disaster area is described by a mobility
model which is used to evaluate the routing protocols for post disaster scenario networks. Existing mobility
models for post disaster scenarios do not distribute the rescue entities in proportion to the intensity of disaster
events in the case of multiple events occurring simultaneously. In this work, we propose the Role-based 3-
Tier Mobility Model (RTTMM) to mimic the movement pattern of different rescue entities involved in the
disaster relief operation by distributing them based on the proportion of the intensity of the disaster event.
Our model generates the mobility traces of the rescue entities, which are fed as input to the DTN routing
protocols. We also evaluate the performance of existing DTN routing protocols using the traces obtained from
RTTMM.
1 INTRODUCTION
The Interne of Things (IoT) consists of massive
deployment of heterogeneous devices which are
battery operated and interconnected through wireless
network interfaces. The IoT communication
architectures facilitate such devices not only
connected to the backbone (i.e. the Internet) using
infrastructure-based wireless networks, but also to
communicate with one another autonomously,
without the help of any infrastructure such as
temporary wireless network (Petersen, 2015). This
temporary or adhoc based networks are MANETs and
DTNs which will become the important network
architecture in IoT (Reina, 2013). Even in IoT,
devices are interconnected through the Internet all the
time. But in many situations such as military and
disaster, they become disconnected from the Internet
backbone and communication needs to carry out
using ad hoc manner.
Natural or man-made disaster may destroy the
existing communication infrastructure, making it
difficult for rescue entities to communicate among
themselves and the outside world to perform relief
operations. Mobility characteristic of the rescue
entities in a post disaster situation is very different
from other environments, like campus, conference
and military. Relief workers, policemen, emergency
vehicles and ambulances have different movement
patterns in the disaster affected area. The mobility
model of a disaster scenario mimics the movement
pattern of rescue team members to inspect the event
areas, providing medical service and relief goods, and
collect the information about victims and damage due
to the disaster. Existing mobility models like Random
Walk (RW) and Random Way Point (RWP) cannot
be used to model the movement of rescue entities. In
the literature, the authors have proposed mobility
models to imitate the movement pattern of the entities
in a post disaster scenario. The models can be
categorized into synthetic and map based models.
11
Gondaliya N. and Atiquzzaman M.
RTTMM: Role based 3-Tier Mobility Model for Evaluation of Delay Tolerant Routing Protocols in Post Disaster Situation.
In Proceedings of the International Conference on Internet of Things and Big Data (IoTBD 2016), pages 11-20
ISBN: 978-989-758-183-0
Copyright
c
2016 by SCITEPRESS – Science and Technology Publications, Lda. All rights reserved
11

The synthetic mobility model by Nelson et al.
(Nelson, 2007) assumed that when an event (for
example, disaster) occurs, some entities (relief
workers) are attracted towards the event and others
(civilians) flee away from the events. This model
assumes that even though the event lasts until the
relief operation ends, but rescue team members are
always working around recently happened event. This
model does not distribute the dedicated relief workers
to the specific event areas when multiple disaster
events occur simultaneously. Another synthetic
mobility model by Aschenbruck et al. (Aschenbruck,
2007) is based on separation of rooms (zones). Zones
are established in the disaster affected area also called
incident location and movement of rescue entities is
restricted only inside their respective zones. This
model is suitable only for single incident location or
disaster event because it needs same set of zones to
be created for each disaster event.
Gupta et al. (Gupta, 2015) proposed a 4-tier map
based DTN architecture to provide communication
infrastructure in the post disaster scenario and the
area is divided into shelter points (SPs) with Throw
boxes (TBs) being placed in each SP. This model
emulates only the movement pattern of relief workers
inside the SP and assumes that the messages are
delivered from the SP to the main coordination center
through Data Mules (DMs).
The existing models do not distribute the rescue
entities to the disaster event in proportion to its
intensity at different events need a varying number of
rescue entities. Moreover, each rescue entity
performs the relief operation with a pre-defined
unique role, and their movement is restricted to the
specified trajectory. These demands a suitable
mobility model for the post disaster scenario to
realistically mimic the movement patterns of rescue
entities. In this paper, we propose the Role based 3-
Tier Mobility Model (RTTMM) which mimics the
movement of rescue entities and the unique role
assigned to them. The rescue entities are distributed
to the events in proportion to their intensity values
and movement of relief workers is restricted in their
respective event area only. We implemented tool in
C++ language to generate the movement traces of
RTTMM.
The rescue entities with the devices of a post
disaster network may remain disconnected for a
significant amount of time. Such a network cannot be
supported by traditional wired networks like TCP/IP
or Ad hoc wireless network such as MANETs which
require a continuous network connection. The above
requirement of a disconnected network can be
accomplished by opportunistic networks, such as
DTNs to support the communication among the
rescue entities. The performance of such a network
mainly depends on the mobility of the rescue entities
(devices of the network). A mobility model is
therefore required to carry out the performance
evaluation of the network. The movement traces of
the mobility model used in a disaster scenario have
also a great impact on the performance of routing
protocols in DTNs. The performance of routing
protocols has been found to vary depending on the
mobility model that is used.
Many authors have evaluated the performance of
DTN routing protocols such, as Prophet (Lindgre,
2003), Epidemic (Vahdat, 2000), MaxProp (Burgess,
2006) and SprayAndWait (Spyropoulos, 2007) using
mobility models (Aschenbruck, 2007; Nelson, 2007)
of the post disaster scenario. To compare the
effectiveness of RTTMM, the performance evaluations
can be carried out using the realistic mobility model
proposed in this paper. The main problem in analyzing
the performance of a routing protocol for post disaster
scenario is the absence of a realistic mobility model
which distributes the rescue entities in proportion to the
intensity of the disaster event.
The mobility traces generated by RTTMM are fed
as input to the DTN routing protocols. The
performance parameters of routing protocols like
delivery probability and delivery delay are most
important in the post disaster operation as they deal
with information about human lives and give a picture
of the damage. The device carried out by rescue team
members is battery operated and with limited storage
so, energy consumption and buffer storage are to be
considered. Therefore, we also evaluate the routing
protocols for overhead ratio and cost per message
which show the energy conservation in the network.
The existing routing protocols are also evaluated by
varying number of devices, buffer size and message
size using ONE simulator (
Keranen, 2009).
The rest of the paper is organized as follows:
Section 2 presents related works on the mobility
modelling in a disaster situation, different network
architectures and existing routing protocols. Sections
3 and 4 explain RTTMM and its analysis,
respectively. The performance and simulation
parameters are discussed in Section 5. The simulation
results and discussions are presented in Section 6.
Finally the conclusions are drawn in Section 7.
2 RELATED WORKS
To model the mobility and select the most appropriate
wireless adhoc network architecture for the post
IoTBD 2016 - International Conference on Internet of Things and Big Data
12
IoTBD 2016 - International Conference on Internet of Things and Big Data
12

disaster situation is a challenging task and is currently
an active area of research. This Section describes the
existing mobility models and multi hop wireless
adhoc network, such DTNs, for the post disaster
scenario. These are followed by the existing DTN
routing protocols, evaluated for the disaster mobility
scenario.
2.1 Existing Disaster Mobility Models
The mobility models proposed so far can be divided
into synthetic and map based mobility models as
described below.
2.1.1 Synthetic Mobility Models
A number of authors have proposed synthetic
mobility models to impersonate the movement
pattern of objects in a disaster situation to provide
communication in the disaster situation. Aschenbruck
et al. (Aschenbruck, 2007) presented a synthetic
mobility model called separation of room which
divides the disaster areas into different zones:
incident zone, casualty clearing and patient waiting
area, transport zone and technical operational
command. The BonnMotion tool developed by
Aschenbruck et al. (Aschenbruck, 2010) allows
generation of the mobility traces for this mobility
model. This model is mainly used to provide medical
treatment in the post disaster scenario. It however has
the disadvantage of requiring the set of zones to be
established for each event area.
Another synthetic mobility model presented by
Nelson et al. (Nelson, 2007) assigns a unique role to
each object. They propose low level gravity based
mobility model in which events apply forces to the
objects (civilians, relief workers, policemen etc.).
Consequently, civilians flee away from the event and
the relief workers approach the event. The drawback
of this model is that relief workers are always
attracted to the recent event and they do not follow
the tactical movement inside the event area.
2.1.2 Map based Mobility Models
Uddin et al. (Uddin, 2009) presented the first map
based mobility using DTNs in post disaster situation.
They simulated the mobility for both rescue entities
and victims, including the different centres (fire
station, neighbourhood, house, medical camp, relief
camp and police station) that are established after the
disaster. Movement patterns are also defined for
rescue members and victims by extending the map
based movement model in the ONE simulator on a
built-in map of Helkensi city. This mobility model
included the impact of disaster on the transportation
network and modelled the population and relief
vehicles only.
Gupta et al. (Gupta, 2015) proposed 4-tier map
based DTN architecture to provide communication
infrastructure with respect to the flood disaster which
occurred in the Uttrakhand State of India in 2014. The
disaster area also called activity area is divided into
shelter points (SPs) which are the particular areas
assigned to the group of relief workers to investigate
the scene. Each SP is allocated static TB, which
collects the information within its SP for further
transmission to Main Control Station (MCS). Data
Mules (e.g., ambulances, boats, helicopters) collect
the data from SP and deliver to the MCS which is
connected to the outer world. The authors in their
work have assumed that inter SP communication is
managed by DMs, but they have not emulated the
movement pattern of them to deliver the messages to
the final destination (MCS).
2.2 DTNs for Disaster Scenario
DTNs are most appropriate in a disaster situation due
to their inherent characteristic to operate in the
absence of end-to-end path and continuous network
connectivity. In recent years, researchers have
presented many solutions for disaster scenario using
DTNs in the form of system to help in disaster
recovery and mobility models as discussed in Section
2.1.
Martin-Campillo et al. (Martin-Campillo, 2010)
developed a system to collect victim information
using electronic triage and mobile devices in disaster
situation. Legendre et al. (Legendre, 2011)
summarized the work done in wireless network which
is able to uphold the communication during a disaster
when the existing communication infrastructure is
damaged. They also proposed Twimight which is an
Android based application, sends tweets using
Tweeter severs in normal mode while it uses
opportunistic contacts in disaster mode between
mobile devices in the absence of network
connectivity.
Fujihara et al. (Fujihara, 2012) presented real-
time disaster evacuation guidance system which helps
the evacuee himself to gather the information about
road blockage and danger areas due to fire and share
that information opportunistically with other mobile
devices. Fajardo et al. (Fajardo, 2014) presented a
content based data prioritization method that gathers
the images of the disaster area and images with
RTTMM: Role Based 3-Tier Mobility Model for Evaluation of Delay Tolerant Routing Protocols in Post Disaster Situation
13
RTTMM: Role based 3-Tier Mobility Model for Evaluation of Delay Tolerant Routing Protocols in Post Disaster Situation
13

critical content is sent faster than non-critical content
in order to handle critical events immediately.
2.3 Existing DTN Routing Protocols in
Disaster Scenario
Many DTN routing protocols have been proposed in the
literature which can be categorized into flooding based,
forwarding based and social based routing protocols.
The forwarding and flooding based routing protocols
have been evaluated by the authors for the existing
mobility models in a post disaster scenario. The social
based routing protocols find their applicability in the
human mobility only so, they are not suitable in a post
disaster mobility. Martin-Campillo et al. (Martin-
Campillo, 2013) evaluated the performance of
Epidemic, Prophet, MaxProp and Time-To-Return
(TTR) in disaster scenario using model by Aschenbruck
et al. (Aschenbruck, 2007). It is concluded that
MaxProp gives best performance in delivery probability
and TTR in overhead ratio and cost per message. Saha
et al. (Saha, 2011) evaluated Prophet, Epidemic, Spray
and Wait, MaxProp and Spray and Focus routing
protocols using a cluster based mobility model.
Inwhee et al. (Inwhee, 2010) proposed message
priority based forwarding protocol which handles
messages according to priority. Martin-Campillo et al.
(Martin-Campillo, 2012) proposed new energy
efficient routing and evaluated using synthetic mobility
model by Aschenbruck et al. (Aschenbruck, 2007) for
post disaster situation. Nelson et al. (Nelson, 2009)
evaluated the performance of existing routing
protocols (Epidemic, MaxProp, Spray and Wait, Spray
and Focus and Prophet) using event driven role based
mobility model and proposed Encounter Based
Routing (EBR) protocol. Recently, Bhattacharjee et al.
(Bhattacharjee, 2015) evaluated existing routing
protocols such as MaxProp, Prophet, Spray and Wait
(SnW), Epidemic routing using four different mobility
models: custom map based mobility, post disaster
mobility model, Random waypoint model and Cluster
movement model for disaster scenario. The majority of
above works used existing routing protocols such as
Epidemic, Prophet, MaxProp, EBR and SnW to
evaluate the mobility model for disaster situation. So,
we use the same routing protocols in order to evaluate
RTTMM model.
3 RTTMM: ROLE BASED 3-TIER
MOBILITY MODEL
This Section discusses the proposed synthetic
mobility model which emulates the movement pattern
of different rescue entities working in the post
disaster scenario. Sections 3.1 and 3.2 explain the
different entities involved in the disaster scenario,
disaster events, and the role assigned to a rescue
entity with its movement pattern.
3.1 Rescue Entities and Events
The following Sections describe the different rescue
entities involved in the post disaster relief operation
and the disaster events.
3.1.1 Rescue Entities
There are five different kinds of rescue entities
involved in the model: relief worker, policeman,
ambulance, emergency vehicle, hospital and relief
camp. These entities are categorized into specific
tiers. Mobile devices held by a policeman and relief
worker are treated as tier-1 devices. Ambulance and
emergency vehicle mounted with devices called DMs
are termed as tier-2 devices. Hospital and relief camp
placed at fixed location usually at distant place to
avoid the recurrence of the disaster event called TBs
have connectivity with the outside world are termed
as tier-3 devices. Also, each event area is allotted one
fixed TB and placed in the center.
3.1.2 Disaster Events
Disaster events may be an earthquake, fire damage,
landslide, flood, hurricane, etc. An event has an
associated intensity value which defines the level of
impact of the disaster. We identify the damage radius
for each event that is determined based on the
intensity of the event so that relief workers always
restrict their movement inside the damage radius. Our
RTTMM supports multiple events to occur
simultaneously or sequentially. When an event
happens, the relief workers, ambulances and
emergency vehicles are assigned to the event in
proportion to the intensity of the event. For example,
if two events occur simultaneously with intensity
values of
and
, the relief workers are distributed
to the events as given in Equation (1). Where, n
t
is the
total number of relief workers in the disaster scenario.
n
1
=
i
1
+ i
* i
andn
2
= n
-
(1)
n
1
and n
2
are the number of relief workers distributed
to the events 1 and 2, respectively, based on the values
of their intensity. Similarly, ambulances and
emergency vehicles are also assigned to the events in
proportion to their intensity values.
IoTBD 2016 - International Conference on Internet of Things and Big Data
14
IoTBD 2016 - International Conference on Internet of Things and Big Data
14

3.2 Role and Movement Pattern of
Rescue Entity
Each rescue entity is assigned a unique role and it acts
accordingly. For example, the relief workers move
within the damage radius of the event area. Each
relief worker randomly selects the distance to travel
within the damage radius from the center and returns
to the same point. The same movement pattern is
repeatedly followed again and again. Ambulances
move between the hospital and the event area and
transfer victims from the event area to hospital.
Similarly, emergency vehicles also move between an
event area and the relief camp to provide relief goods
for the victims to be distributed by the relief workers.
The policeman performs patrolling by randomly
selecting event locations, hospital and relief camp.
4 ANALYSIS OF THE RTTMM
The mobility model RTTMM discussed in the
previous Section needs to be analyzed to know the
characteristics of the network and the behavior of the
devices which can be used by network designers to
select the appropriate Ad Hoc network and propose a
suitable routing protocol. We compare our mobility
model with Event Driven Role-based Mobility Model
(EDRMM) because it exhibits similar characteristics
with RTTMM but not strategic movement of relief
workers. Both the models have been analyzed using
different parameters which are described in Sec. 4.1.
4.1 Parameters for Analysis
The following three parameters are considered to
analyze the mobility models which show that whether
the network of the post disaster remains connected or
not and the device will have more opportunity to
forward the messages.
1. Average Device Degree: It is defined by the
average number of neighbors per device and it
is used to differentiate the connectivity of the
network.
2. Maximum Device Degree: The maximum
device degree is the maximum number of
neighbors of a device.
3. Clustering Coefficient: It represents a measure
of the degree to which devices in a graph tend
to cluster together.
4.2 Results for Analysis of RTTMM
In order to assess the mobility model discussed in
Sec. 3, the following scenario is considered. The
simulation is carried out for 6000 seconds with a
square grid size of 3000 m
2
. There are total 52 mobile
devices involved in a disaster scenario: 38 relief
workers, 2 fixed TB in the center of the event area, 4
ambulances, 4 emergency vehicles, 2 policemen, 1
hospital and 1 relief camp. The transmission range of
each device is set to 50 meters. Two events occur
simultaneously with intensity values of 4000 and
2000. The speed of the relief workers, ambulance and
emergency vehicle and policeman is set to 3 m/s, 12
m/s, and 7 m/s respectively. The same configuration
parameters are set for EDRMM and it also includes
some specific settings, which are taken as per
(Nelson, 2007). Average results for 10 different
simulations with different random seeds are collected.
Figure 1 shows the metrics as a function of time
for RTTMM and EDRMM. As shown in Figures 2(a)
and 2(b), the average device degree and maximum
device degree are always higher in RTTMM due to
planned movement of rescue team members. At the
start of the simulation before the disaster event
occurs, all rescue team members gathered at one place
(for ex. Relief workers and emergency vehicles at
relief camp) which shows higher values of the
average and the maximum device degree in the same
Figure. These metrics are important because they
show the information about number of neighbors a
device has at any point of time which can offer the
high network connectivity.
Figure 1(c) depicts the average clustering
coefficient of all the devices which shows that the
network remains more clustered in RTTMM than
EDRMM due to the strategic and confined movement
of rescue team members. These analyses prove that
RTTMM is more suitable for use in post disaster
situation.
5 EXPERIMENTAL SET UP AND
PERFORMANCE METRICS
In this section, we describe the configuration
parameters for RTTMM and the performance metrics
for the evaluation of the routing protocols.
RTTMM: Role Based 3-Tier Mobility Model for Evaluation of Delay Tolerant Routing Protocols in Post Disaster Situation
15
RTTMM: Role based 3-Tier Mobility Model for Evaluation of Delay Tolerant Routing Protocols in Post Disaster Situation
15

(a) Average device degree Vs Simulation time (b) Maximum device degree Vs Simulation time
(c) Clustering coefficient Vs Simulation time
Figure 1: Analysis of mobility models: RTTMM and EDRMM.
5.1 Configuration Parameters
The configuration parameters of RTTMM, which
generates the mobility traces of rescue entities for
input to the routing protocol, and the configuration
parameters of ONE are described below. Table 1
shows the parameters of RTTMM and ONE that are
common to all the experiments, unless explicitly
specified. We have taken 10 message copies for the
SnW and EBR routing protocols; settings for the
other routing protocols are as per default
implementation available in the ONE simulator.
5.2 Performance Metrics
The following performance metrics have been
considered to assess and compare the performance of
the existing routing protocols with RTTMM using
DTNs.
1. Delivery Probability or Delivery Ratio: It is
calculated as the ratio of the number of
messages successfully delivered to the
destination to that of the total number of
messages generated in the network.
2. Average Delivery Delay or Latency: Delivery
delay is the time elapsed between the creations
of the message at the source and delivered
successfully to the destination. Average
delivery delay is average of delivery delay of
all the delivered messages.
3. Average Overhead Ratio: It is the ratio of the
difference between the total number of
messages relayed minus delivered
successfully to that of the number of messages
delivered successfully. This is also a measure
of the additional number of transmissions
required for each message to be delivered from
source to the destination.
4. Cost per Message: It is defined as the total
number of message transmissions divided by
the total number of successfully delivered
messages.
6 EVALUATION OF DTN
ROUTING PROTOCOLS
In this Section, we analyze the performance of five
RTTMM as the mobility model. The main objective
of evaluating these routing protocols is to verify their
effectiveness and applicability in the post disaster
scenario. The Section 4 has shown that RTTMM
offers more network connectivity than existing model
EDRMM so, we have chosen the movement traces of
0
2
4
6
8
10
12
1000 2000 3000 4000 5000
Average node degree
Simulation time (Seconds)
RTTMM
EDRMM
0
5
10
15
20
25
30
1000 2000 3000 4000 5000
Maximum node degree
Simulation time (Seconds)
RTTMM
EDRMM
0
0.1
0.2
0.3
0.4
0.5
0.6
0.7
0.8
1000 2000 3000 4000 5000
Clustering coefficient
Simulation time (Seconds)
RTTMM
EDRMM
IoTBD 2016 - International Conference on Internet of Things and Big Data
16
IoTBD 2016 - International Conference on Internet of Things and Big Data
16

Table 1: Configuration parameters of RTTMM and ONE
simulator.
Parameter Value
Simulation area 3000 m
2
Simulation time 6000 seconds
Transmission range 50 meters
Transmission speed 2 Mbps
No. of devices 100, one hospital and one
relief camp
Message generation
interval
One message/second from
relief workers;
One message every 30-35
seconds from hospital and
relief camp
Message size 25k
Buffer size of relief
workers
5 MB
Buffer size of DMs and
TBs
100MB
Speed of relief workers 3 m/s
Speed of
ambulance/emergency
vehicle
12 m/s
Speed of policeman 7 m/s
No. of events 2
Damage radius 20% of intensity value
Event intensity I
1
= 4000 , I
2
= 2000
RTTMM as input to the routing protocols. To
demonstrate the effectiveness of the routing
protocols, we varied the number of devices, buffer
sizes and message sizes. The average of 10 simulation
runs is considered on different input files generated
using RTTMM for a 95% confidence interval.
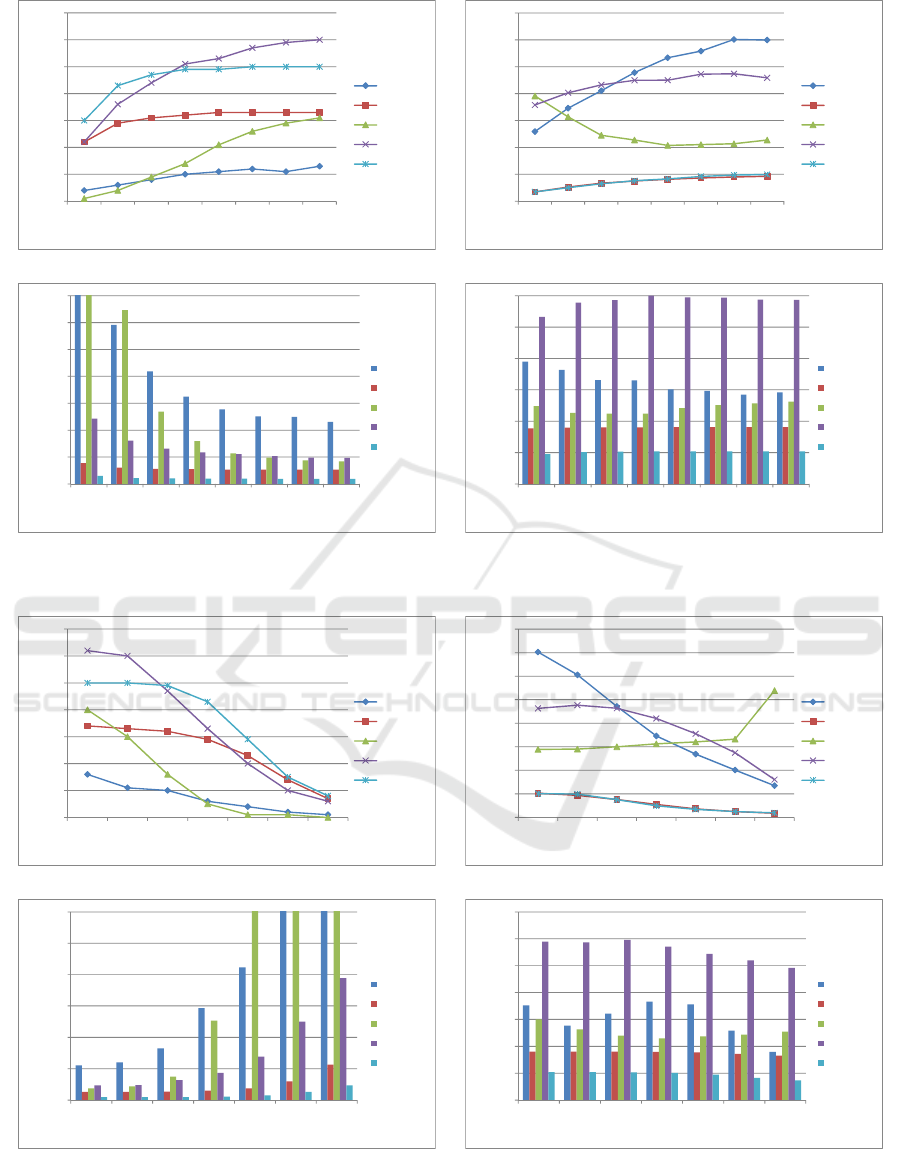
6.1 Effect of Varying Number of
Devices
Simulations were carried out to evaluate the
scalability of the routing protocols by increasing the
device density. The number of devices varied from 50
to 250 in increments of 50. Experiments were carried
out considering that 80% of the devices are relief
workers, 3% are policemen and 17% are vehicles.
Figure 2(a) shows that delivery probability is
increasing with number of devices for EBR and
MaxProp while it is decreasing for Epidemic, Prophet
and SnW. MaxProp shows the highest delivery
probability due to its wise strategy for the selection of
relay devices as compared to others. EBR has next
highest performance in terms of delivery probability
which takes the advantage of encounter information
of DMs with statically placed TBs. The forwarding
strategy of Epidemic, Prophet and SnW do not work
in this scenario and messages are dropped by the
devices without delivering to the actual destination.
The average delivery delay of all routing
protocols decreases as the number of devices
increases except Epidemic as shown in Figure 2(b).
EBR has lowest delivery delay amongst all routing
protocols. Figure 2(c) depicts the average overhead
ratio, which increases with the number of devices for
all routing protocols excluding EBR. EBR has a low
overhead ratio than others and which does not
fluctuate while increasing the number of devices. The
cost per message is increasing with the number of
devices for MaxProp, Epidemic and Prophet routing
protocols while it remains stable for EBR and SnW as
shown in Figure 2(d). These results show that
MaxProp outperforms in terms of delivery
probability, but at the cost of the other three
parameters. EBR has lower delivery probability than
MaxProp with minimum delivery delay, overhead
and cost per message.
The performance of routing protocols depends on
the availability of buffer space, particularly when
they use multi copy message approach. We have
chosen message size of 50k in these sets of
experiments and buffer size is varied from 1MB to
8MB in increments of one. The buffer size is only
varied for the mobile devices carried by relief
workers. Figure 3(a) shows that delivery probability
increases as buffer size increases for all the routing
protocols. EBR shows the highest delivery
probability up to buffer size of 3MB and becomes
stable at 4MB. MaxProp outperforms at a buffer size
of 4MB onwards as its performance is mainly
depends on the available buffer space.
6.2 Effect of Varying Buffer Size
The average delivery delay is decreasing with an
increase in the buffer size except Prophet as shown in
Figure 3(b). EBR and SnW have the lowest average
delivery delay with marginal increase with the buffer
size. Figure 3(c) demonstrates that an average
overhead ratio is higher for Epidemic and Prophet and
decreasing with an increase of buffer size for all
routing protocols. It remains lowest and stable for
EBR and SnW schemes. The cost per message does
not vary much for all the routing schemes and it
remains mostly steady for EBR as depicted in Figure
3(d).
6.3 Effect of Varying Message Size
When relief workers are gathering information about
the disaster area, they may need to send text as well
RTTMM: Role Based 3-Tier Mobility Model for Evaluation of Delay Tolerant Routing Protocols in Post Disaster Situation
17
RTTMM: Role based 3-Tier Mobility Model for Evaluation of Delay Tolerant Routing Protocols in Post Disaster Situation
17

(a) Delivery probability Vs No. of devices (b) Avg. delivery delay Vs No. of devices
(c) Avg. overhead ratio Vs No. of devices (d) Cost per message Vs No. of devices
Figure 2: Effect of varying number of devices.
data in the form of pictures and video clips to the
centres and vice versa. Here we check the
performance of routing protocols on varying sizes of
messages from 16k to 1MB in increment of power of
2. Average delivery probability is decreasing as
message size increases as shown in Figure 4(a).
MaxProp shows maximum delivery probability with
message size below 64k as it starts dropping the
message when it is of bigger size due to insufficient
buffer space as discussed in Section 6.2. EBR
performs better than all the routing protocols with big
message sizes.
Figure 4(b) depicts that an average delivery delay
is decreasing with increase in message size except
Prophet and the reason is that there is decreasing of
delivery probability. EBR and SnW have the lowest
average delivery delay than other schemes. The
average overhead ratio is increasing for all the
protocols, but remains the lowest for EBR and SnW
as shown in Figure 4(c). The cost per message does
not fluctuate more in case of all the routing schemes
and it stays mostly steady for EBR and SnW as
depicted in Figure 4(d).
7 CONCLUSIONS AND FUTURE
PLAN
In this paper, we proposed the role based 3-tier
synthetic mobility model, called RTTMM, to mimic
the movement pattern of the rescue team members in a
post disaster situation. RTTMM solves the limitations
of existing mobility models which do not have the
flexibility to assign different behavior and movement
pattern for different team members. RTTMM has been
compared against EDRMM and found to be more
effective and applicable in a post disaster scenario.
We also evaluated the performance of five
existing DTN routing protocols using the movement
traces of RTTMM. The simulation results show that
MaxProp outperforms in terms of delivery probability
for varying number of devices and buffer sizes, but
decreasing with message size. The demerit of this
protocol is that it shows higher delivery delay,
overhead ratio and cost per message. EBR has shown
the next best performance in terms of delivery
probability with the lowest average delivery delay. It
also has steady overhead ratio and cost per message.
There is not any protocol which performs the best
for all the metrics. It is concluded that DTNs facilitate
0
0.1
0.2
0.3
0.4
0.5
0.6
0.7
0.8
0.9
50 100 150 200 250
Delivery probability
No. of nodes
Epidemic
SnW
Prophet
MaxProp
EBR
200
400
600
800
1000
1200
1400
1600
50 100 150 200 250
Avg. delivery delay (Seconds)
No. of nodes
Epidemic
SnW
Prophet
MaxProp
EBR
0
50
100
150
200
250
300
50 100 150 200 250
Avg. overhead ratio
No. of nodes
Epidemic
SnW
Prophet
MaxProp
EBR
0
10
20
30
40
50
60
70
80
90
100
50 100 150 200 250
Cost per message
No. of nodes
Epidemic
SnW
Prophet
MaxProp
EBR
IoTBD 2016 - International Conference on Internet of Things and Big Data
18
IoTBD 2016 - International Conference on Internet of Things and Big Data
18
(a) Delivery probability Vs Buffer size (b) Avg. delivery delay Vs Buffer size
(c) Avg. overhead ratio Vs Buffer size (d) Cost per message Vs Buffer size
Figure 3: Effect of varying buffer size.
(a) Delivery probability Vs Message size
(b) Avg. delivery delay Vs Message size
(c) Avg. overhead ratio Vs Message size (d) Cost per message Vs Message size
Figure 4: Effect of varying message size.
0
0.1
0.2
0.3
0.4
0.5
0.6
0.7
1M 2M 3M 4M 5M 6M 7M 8M
Delivery probability
Buffer size (MB)
Epidemic
SnW
Prophet
MaxProp
EBR
100
300
500
700
900
1100
1300
1500
1M 2M 3M 4M 5M 6M 7M 8M
Avg. delivery delay (Seconds)
Buffer size (MB)
Epidemic
SnW
Prophet
MaxProp
EBR
0
50
100
150
200
250
300
350
1M 2M 3M 4M 5M 6M 7M 8M
Avg. overhead ratio
Buffer size (MB)
Epidemic
SnW
Prophet
MaxProp
EBR
0
5
10
15
20
25
30
1M 2M 3M 4M 5M 6M 7M 8M
Cost per message
Buffer size (MB)
Epidemic
SnW
Prophet
MaxProp
EBR
0
0.1
0.2
0.3
0.4
0.5
0.6
0.7
16k 32k 64k 128k 256k 512k 1M
Delivery probability
Message size
Epidemic
SnW
Prophet
MaxProp
EBR
100
300
500
700
900
1100
1300
1500
1700
16k 32k 64k 128k 256k 512k 1M
Avg. delivery delay (Seconds)
Message size
Epidemic
SnW
Prophet
MaxProp
EBR
0
100
200
300
400
500
600
16k 32k 64k 128k 256k 512k 1M
Avg. overhead ratio
Message size
Epidemic
SnW
Prophet
MaxProp
EBR
0
5
10
15
20
25
30
35
16k 32k 64k 128k 256k 512k 1M
Cost per message
Message size
Epidemic
SnW
Prophet
MaxProp
EBR
RTTMM: Role Based 3-Tier Mobility Model for Evaluation of Delay Tolerant Routing Protocols in Post Disaster Situation
19
RTTMM: Role based 3-Tier Mobility Model for Evaluation of Delay Tolerant Routing Protocols in Post Disaster Situation
19

communication infrastructure in a post disaster
scenario when network partition is observed in IoT.
The future work is to exploit the movement
characteristics such as planned and scheduled
movement of rescue entities from RTTMM and
utilize them in the forwarding decisions by the
routing protocols in DTNs.
REFERENCES
Aschenbruck, N, Ernst, N R, Gerhards-Padilla, E and
Schwamborn, M 2010, ‘BonnMotion: a mobility
scenario generation and analysis tool’, in Proceedings
of the 3
rd
International ICST Conference on Simulation
Tools and Techniques (SIMUTools ’10), Brussels,
Belgium.
Aschenbruck, N, Gerhards-Padilla, E, Gerharz, M, Frank,
M and Martini, P 2007, ‘Modelling mobility in disaster
area scenarios’, in Proc. of the 10
th
ACM Symposium on
Modelling, analysis, and simulation of wireless and
mobile systems, pp. 4–12.
Bhattacharjee, S, Roy, S and Bandyopadhyay, S 2015,
‘Exploring an energy-efficient DTN framework
supporting disaster management services in post
disaster relief operation’, in Wireless Networks
(Springer), vol. 21, pp. 1033-1046.
Burgess, J, Gallagher, B, Jensen, D and Levine, B N 2006,
‘MaxProp: routing for vehicle-based disruption-
tolerant networks’, in Proceedings of the 25
th
IEEE
International Conference on Computer
Communications (INFOCOM ’06), Barcelona, Spain,
pp. 1–11.
Fajardo, J T B, Yasumoto, K and Ito, M 2014, ‘Content-
based data prioritization for fast disaster images
collection in delay tolerant network’, in Proceedings of
the 7
th
International Conference on Mobile Computing
and Ubiquitous Networking (ICMU ’14), pp.147–152.
Fujihara, A and Miwa, H 2012, ‘Real-time disaster
evacuation guidance using opportunistic
communications’, in Proceedings of the IEEE/IPSJ 12
th
International Symposium on Applications and the
Internet (SAINT ’12), Izmir, Turkey pp. 326–331.
Gupta, A, Bhattacharya, I, Banerji, P S and Mandal, J K
2015, ‘DirMove: Direction of Movement based
Routing in DTN Architecture for Post-Disaster
Scenario’, Journal of Wireless Networks (Springer), pp.
1-18.
Inwhee, J and Sang-Bo, K 2010, ‘A message priority
routing protocol for Delay Tolerant Networks (DTN) in
disaster areas’, in Future Generation Information
Technology, (Springer), pp. 727–737.
Keranen, A, Ott, J, Karkkainen, T 2009, ‘The one simulator
for dtn protocol evaluation’, in proceedings of the
2
nd
international conference on simulation tools and
techniques (Simutools 2009), Brussels, Belgium. pp. 1–
10.
Legendre, F, Hossmann, T, Sutton, F and Plattner, B 2011,
‘30 years of wireless Ad Hoc networking research: what
about humanitarian and disaster relief solutions? What
are we still missing?’,in Proceedings of the 1
st
International Conference on Wireless Technologies for
Humanitarian Relief (ACWR ’11), pp. 217-217.
Lindgren, A, Doria, A and Schel´en, O 2003, ‘Probabilistic
routing in intermittently connected networks’, ACM
SIGMOBILE Mobile Computing and Communications
Review, vol. 7, pp. 19–20.
Martın-Campillo, A and Mart´ı, R 2012, ‘Energy-efficient
forwarding mechanism for wireless opportunistic
networks in emergency scenarios’, Computer
Communications, vol. 35, no. 14, pp. 1715– 1724.
Martın-Campillo, A, Crowcroft, J, Yoneki, E and Mart´ı, R
2013, ‘Evaluating opportunistic networks in disaster
scenarios’, Journal of Network and Computer
Applications, vol. 36, no. 2, pp. 870–880.
Martın-Campillo, A, Crowcroft, J, Yoneki, E, Mart´ı, R,
and Mart´ınez-Garc´ıa, C 2010, ‘Using Haggle to create
an electronic triage tag’, in Proceedings of the
2
nd
International Workshop on Mobile Opportunistic
Networking (MobiOpp ’10), pp. 167–170.
Nelson, S C, Albert F Harris, and Robin Kravets 2007,
‘Event-driven, role-based mobility in disaster recovery
networks’, in proceedings of 2
nd
ACM workshop on
challenged networks CHANTS ‘07, pp. 27-34.
Nelson, S C, Bakht, M, and Kravets, R 2009, ‘Encounter-
based routing in DTNs’, in IEEE INFOCOM 2009, Rai
de Janeiro, pp. 846–854.
Petersen, H, Baccelli, E, Wahlisch M et al. 2015, ‘The Role
of the Internet of Things in Network Resilience’,
Internet of Things, IoT architecture, Lecture Notes of
Institute of Computer Science, Social Informatics and
Telecommunication Engineering (LNICST), vol. 151,
pp. 283-296.
Reina, D G, Toral, S L, Barrero, F et al. 2013, ‘The Role of
Ad Hoc Network in the Internet of Things: A Case
Scenario for Smart Environment’, Internet of Things
and Inter-Cooperative Computational Technologies for
Collective Intelligence, vol. 460, pp. 89-113.
Saha, S, Sheldekar, A, Joseph, C R, Mukherjee, A and
Nandi, S 2011, ‘Post disaster management using delay
tolerant network’, Communications in Computer and
Information Science, vol. 162, pp. 170–184.
Spyropoulos, T, Psounis, K and Raghavendra, C S 2005,
‘Spray and wait: An efficient routing scheme for
intermittently connected mobile networks’, in
Proceedings of. ACM SIGCOMM Workshop Delay-
tolerant networking, Philadelphia, PA, pp. 252–259.
Uddin, Y M S, Nicol, D M, Abdelzaher, T F and Kravets,
R H 2009, ‘A post-disaster mobility model for delay
tolerant networking’, in Proceedings of the Winter
Simulation Conference (WSC ’09), pp. 2785–2796.
Vahdat, A and Becker, D 2000, ‘Epidemic routing in for
partially connected ad hoc networks’, Tech. Rep. CS-
2000-06, Duke University, Durham, NC.
IoTBD 2016 - International Conference on Internet of Things and Big Data
20
IoTBD 2016 - International Conference on Internet of Things and Big Data
20
