
Stock Price Prediction based on Stock Big Data and Pattern Graph
Analysis
Seungwoo Jeon
1
, Bonghee Hong
1
, Juhyeong Kim
1
and Hyun-jik Lee
2
1
Dept. of Electrical and Computer Engineering, Pusan National University, Busan, South Korea
2
Division of Chronic disease control, Korea centers for disease control & prevention, Cheongju, South Korea
Keywords:
Stock Price Prediction, Hierarchical Clustering, Pattern Matching, Feature Selection, Artificial Neural
Network.
Abstract:
Stock price prediction is extremely difficult owing to irregularity in stock prices. Because stock price some-
times shows similar patterns and is determined by a variety of factors, we present a novel concept of finding
similar patterns in historical stock data for high-accuracy daily stock price prediction with potential rules for
simultaneously selecting the main factors that have a significant effect on the stock price. Our objective is
to propose a new complex methodology that finds the optimal historical dataset with similar patterns accord-
ing to various algorithms for each stock item and provides a more accurate prediction of daily stock price.
First, we use hierarchical clustering to easily find similar patterns in the layer adjacent to the current pattern
according to the hierarchical structure. Second, we select the determinants that are most influenced by the
stock price using feature selection. Moreover, we generate an artificial neural network model that provides
numerous opportunities for predicting the best stock price. Finally, to verify the validity of our model, we use
the root mean square error (RMSE) as a measure of prediction accuracy. The forecasting results show that the
proposed model can achieve high prediction accuracy for each stock by using this measure.
1 INTRODUCTION
Stock price provided by Koscom consists of thirty-
two items (four groups: domestic buying, domestic
selling, foreign buying, and foreign selling) such as
domestic selling high price, foreign selling opening
price, and domestic buying completion amount. Even
if stock prices have the same value, their inside com-
binations may be different. For example, domestic
selling high price may show a downturn and domes-
tic buying completion amount may show an upturn
or vice versa. Because the items are highly variable,
the objective is to predict the next stock price pattern
graph using these items, which would be very useful.
Stock market analysis and prediction are being
studied using various methods such as machine learn-
ing and text mining. Data mining studies use daily
stock data. For example, prediction studies based on
support vector machines (SVMs) (Cao and Tay, 2001;
Ince and Trafalis, 2007) have been conducted to de-
termine whether the new pattern data belongs to a
certain pattern category. In addition, artificial neu-
ral networks (ANNs) (Kimoto et al., 1990; Kohara
et al., 1997) have been employed to achieve good pre-
dictions even in the case of complex relationships of
variables, while an autoregressive integrated moving
average (ARIMA) model (Pai and Lin, 2005; Wang
and Leu, 1996) has been used to identify and predict
time series variation. On the other hand, several pre-
diction studies are based on word analysis of news
articles (Mittermayer, 2004; Nikfarjam et al., 2010;
Kim et al., 2014).
These studies predict daily stock prices using the
daily closing price, which is not sufficient to make
predictions in a short period of time (e.g., 1 hour and
30 minutes). Moreover, even though these studies
have analyzed the significance of variables and in-
creased the prediction accuracy by eliminating unim-
portant variables, the error rates of the predictions are
high owing to the use of outliers.
Stock price consists of several patterns such as
consolidation, cup with handle, double bottom, and
saucer, as shown in Figure 1. Because these patterns
appear repeatedly at time intervals, if we find a par-
allel pattern to the current pattern, we will be able to
predict the following pattern.
By focusing on this point, in this paper, we pro-
pose a new method for generating stock price pre-
Jeon, S., Hong, B., Kim, J. and Lee, H-j.
Stock Price Prediction based on Stock Big Data and Pattern Graph Analysis.
DOI: 10.5220/0005876102230231
In Proceedings of the International Conference on Internet of Things and Big Data (IoTBD 2016), pages 223-231
ISBN: 978-989-758-183-0
Copyright
c
2016 by SCITEPRESS – Science and Technology Publications, Lda. All rights reserved
223

(a) Consolidation pattern. (b) Cup with handle pattern.
(c) Double bottom. (d) Saucer.
Figure 1: Various stock patterns (Bulkowski, 2011).
diction based on historical stock big data. First, un-
like existing studies that mostly use closing price data,
the present study uses tick-by-tick data for short-term
prediction and aggregates them to transform non-
continuous data into continuous data. Then, we make
some patterns similar to the current pattern by using a
hierarchical clustering algorithm and select important
features affecting the stock price by using stepwise
regression. Finally, we generate an ANN using the
data to be completed, similar patterns, and selected
features as input data for high prediction accuracy
through learning in order to derive the best results.
Thus, we propose a prediction system based on
big data processing (Hadoop, Hive, RHive) and anal-
ysis (R) tools for next stock price prediction. The
system consists of four connected computers and in-
cludes five steps. The first step is a preprocessing
step for transforming tick-by-tick data into aggregated
data at five-minute intervals in order to facilitate the
prediction and make daily patterns with five-minute
generation units using Hadoop and RHive query. The
second step is to find all similar patterns for one year
using hierarchical clustering provided by the R func-
tion. Then, the system repeatedly removes insignif-
icant variables through stepwise regression on the R
function. Next, the system uses an ANN to generate
the final prediction model according to numerous sim-
ulations. Finally, we verify the validity of the model
using root mean square error (RMSE) as a measure of
prediction accuracy.
The main contributions of this paper can be sum-
marized as follows.
• We generate a model for predicting stock prices
by applying an ANN through hierarchical clus-
tering for pattern searching and stepwise regres-
sion for significant/insignificant variable distinc-
tion with real tick-by-tick stock data.
• We evaluate the proposed model using RMSE,
which is widely used in stock price forecasts; low
RMSE implies high prediction accuracy.
• To generate the predicted stock price automati-
cally, we build a new system based on big data
processing open-source tools such as Hadoop and
R.
The remainder of this paper is organized as fol-
lows. Section 2 reviews various existing studies on
stock price forecasting. Section 3 presents the speci-
fication of stock data. Sections 4 and 5 describe our
new complex methodology and system architecture
for handling the overall processes. Section 6 presents
our evaluation results. Finally, Section 7 summarizes
our findings and concludes the paper with a brief dis-
cussion on the scope for future work.
2 RELATED WORK
In this section, we introduce some related studies on
various methods such as ANN, feature selection, and
text mining for stock price prediction. ANN was the
most widely used method a few decades ago. Ini-
tially, it was used by itself, and later, attempts were
gradually made to combine it with other techniques in
order to achieve higher prediction accuracy. In (Ki-
moto et al., 1990), a buying and selling timing pre-
diction system was proposed using economic indexes
(foreign exchange rates) and technical indexes (vec-
tor curves) from the Tokyo Stock Exchange Prices In-
dexes (TOPIX). In another study, an echo state net-
work was used as a novel recurrent neural network to
forecast the next closing price (Lin et al., 2009).
The following method involves feature selection
for selecting significant input attributes, and it is
based on other methods that have been widely used
in recent years. In (Huang and Tsai, 2009), a com-
bination of support vector regression (SVR) with a
self-organizing feature map (SOFM) and feature se-
lection based on filtering was proposed for predicting
the next day’s price index using Taiwan index futures
(FITX). Important features were selected using the R-
squared value as input data for SVR. In (Lee, 2009),
a prediction model was developed on the basis of an
SVM with a hybrid feature selection method for find-
ing the original input features, using NASDAQ index
direction. In contrast to the above-mentioned study,
the f-score was used as a selection factor.
However, most of these studies have some limita-
tions for short-term prediction. First, given all histor-
IoTBD 2016 - International Conference on Internet of Things and Big Data
224
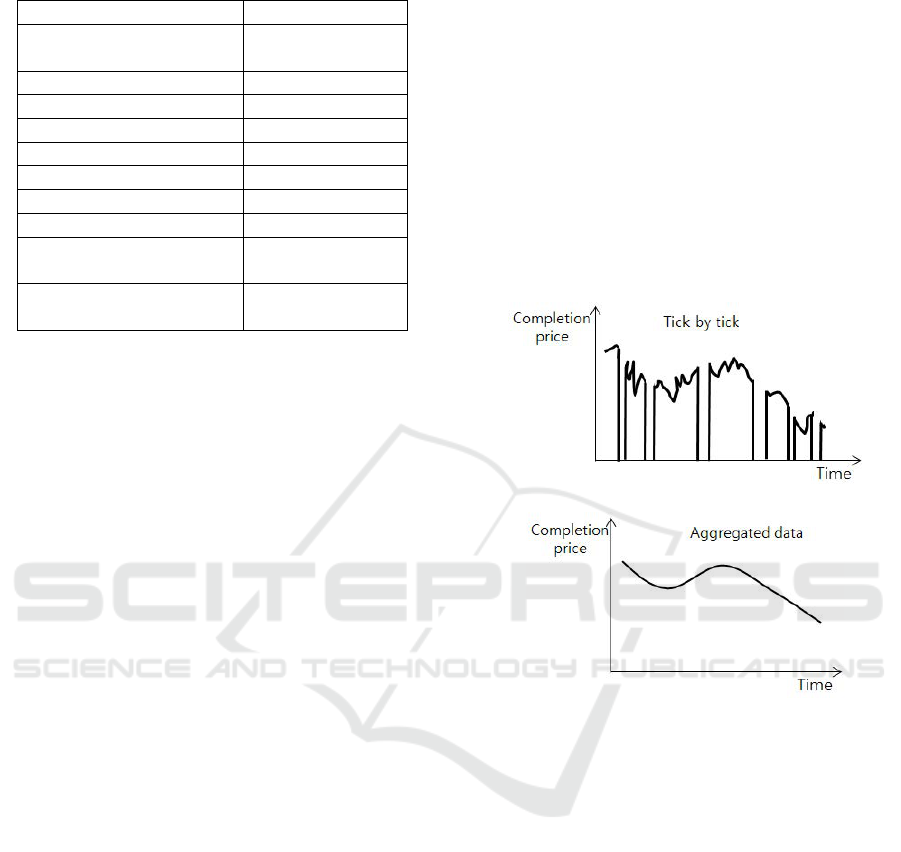
Table 1: Example of stock raw data.
Attribute Value
Date
(yyyymmddhhmmsss)
20140813090024
Type 0
Completion price (won) 77,500
Completion amount 37
Opening price (won) 78,900
High price (won) 78,900
Low price (won) 76,600
Price just before (won) 77,400
Accumulated completion
amount
475,021
Accumulated completion
price (won)
36,770,000,000
ical stock data as input data, because the next closing
price is predicted without removing the outliers, the
error rate is high. Second, although the total comple-
tion price is determined by a variety of factors such as
the foreign purchase closing price and domestic sell-
ing completion amount, it is insufficient to consider
such factors. In other words, it is necessary to con-
sider a combination of significant factors.
3 DATA SPECIFICATION
In this study, stock data that was gathered over twelve
consecutive months (August 2014 to July 2015) from
the Korea Composite Stock Price Index (KOSPI) was
used as the input .
The stock data was provided by Koscom. A data
sample is listed in Table 1; it consists of the date,
type, completion price, completion amount, opening
price, high price, low price, price just before, accu-
mulated completion amount, and accumulated com-
pletion price. Because there are four types (domestic
purchase price (0), domestic selling price (1), foreign
purchase price (2), and foreign selling price (3)), the
stock price is the sum of thirty-two items. The size of
each data set was 168 GB and the data was collected
during the one-year period from August 2014 to July
2015.
4 OUTLINE OF PROPOSED
MODEL
In this section, we describe the overall process, from
data preprocessing for making continuous data, the
search for similar pattern data, and the selection of
input data to the generation of the prediction model
from the perspective of data analysis and processing.
4.1 Aggregation of Stock Data
Because the tick-by-tick data we have are the data
generated per transaction, the completion price at the
time is zero if the transaction is not carried out, as
shown in Figure 2 (a). In other words, as the data
is non-continuous data, it is difficult to predict the
price. Consequently, we generate aggregated data at
five-minute intervals to obtain a continuous flow of
data, as shown in Figure 2 (b).
(a) Completion price per transaction.
(b) Completion price after aggregation.
Figure 2: The need for aggregation.
4.2 Searching for Similar Patterns
Above all, it is necessary to make patterns from ag-
gregated data for searching similar patterns. Figure 3
shows the processes of patterning the aggregated data.
The length of a pattern is one day and patterns are
generated at five-minute intervals, e.g., by the sliding
window method, for pattern matching analysis using
various patterns. The number of patterns for one hour
will be twelve.
Figure 4 shows similar patterns in the graph of
real stock price. The similar patterns can be found
by comparing historical patterns and the current pat-
tern. There are various methods for pattern match-
ing. We use a hierarchical clustering algorithm that
can find similar patterns quickly and simultaneously.
The patterns are structured by hierarchical clustering
and similar patterns are neighbor or sibling nodes of
the current pattern. If there are only a limited number
Stock Price Prediction based on Stock Big Data and Pattern Graph Analysis
225
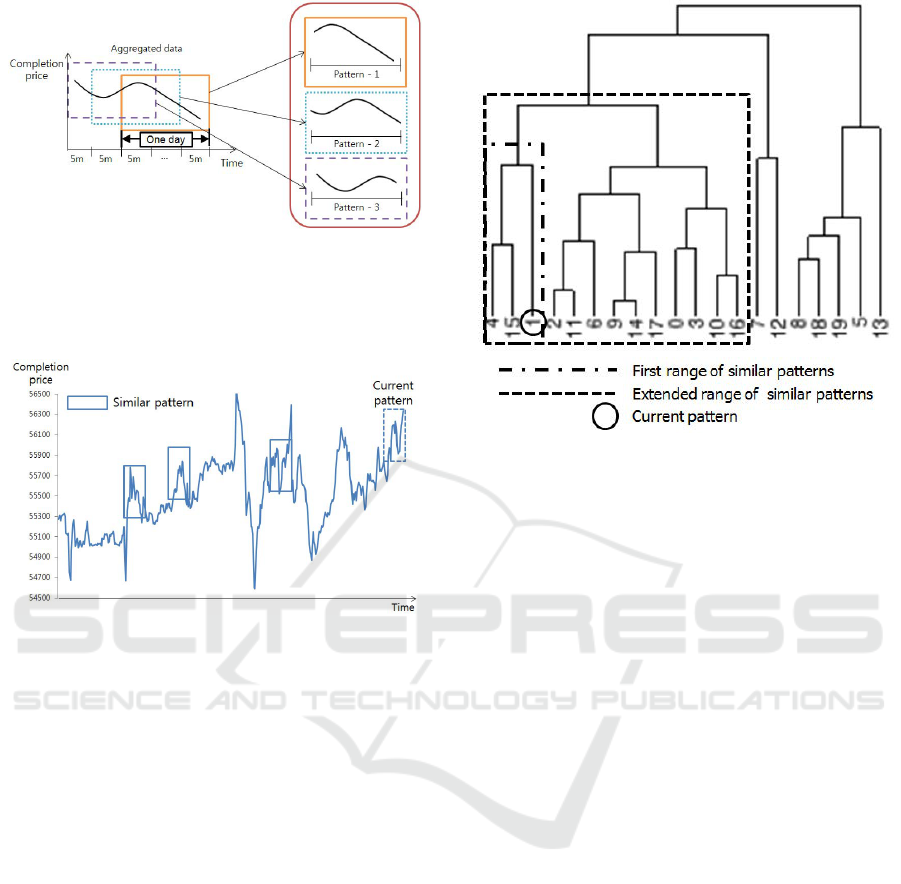
Figure 3: Method of patterning the aggregated data.
of similar patterns, it is possible to extend the range
of the similar patterns.
Figure 4: Similar stock patterns.
Figure 5 shows a hierarchical structure based on
the clustering algorithm; the numbers denote patterns.
Given 1 as the current pattern, 4 and 15 are similar
patterns in the initial range because of the neighbor
and sibling nodes. If we do not get satisfactory results
in the next steps, the range is extended and the number
of similar patterns is eventually increased from 2 to
12.
4.3 Feature Selection According to
Stepwise Regression Analysis
Although there are significant variables affecting the
stock price among the thirty-two variables, some vari-
ables do not have a major effect on the price. To dis-
tinguish these variables, we adopt feature selection,
which is performed using a bidirectional elimination
approach in stepwise regression, as a combination of
forward and backward approaches. Each step reviews
whether already selected variables are removed owing
to a new important variable, while the new variable is
selected one by one. The procedure is conducted as
follows.
• Repeatedly add and remove a variable among all
the variables; then conduct regression analysis
Figure 5: Similar patterns defined through hierarchical
structure.
with the remainder.
• Select the final variable association with the high-
est value of R-square as the explanatory power of
the regression model.
In this work, we consider the total completion
price as a dependent variable and thirty-two variables
as independent variables in the regression analysis,
which is provided as two functions in R as shown be-
low. We use the lm function to fit a linear model,
where y is a dependent variable and x
1
–x
32
are inde-
pendent variables.
fit <- lm(y˜x1+x2+x3+...+x32, data=stock_data)
After fitting, we use the step function for deter-
mining the final independent variables; the first factor
represents the linear model and the second factor de-
termines the direction of the stepwise process, which
combines the forward and backward approaches. A
total of eight variables are removed after applying
stepwise regression, as can be seen in Table 2.
bidirectional <- step(fit, direction="both")
4.4 Prediction Model Generation using
Artificial Neural Network
After feature selection, to generate the predicted stock
data, we use an ANN algorithm, which is widely used
in stock price forecasts (Kuo et al., 2001; Kim and
Han, 2000; Cao et al., 2005). Moreover, it has the ad-
vantage of high prediction accuracy through learning
by iterative adjustment. The learning is performed in
IoTBD 2016 - International Conference on Internet of Things and Big Data
226
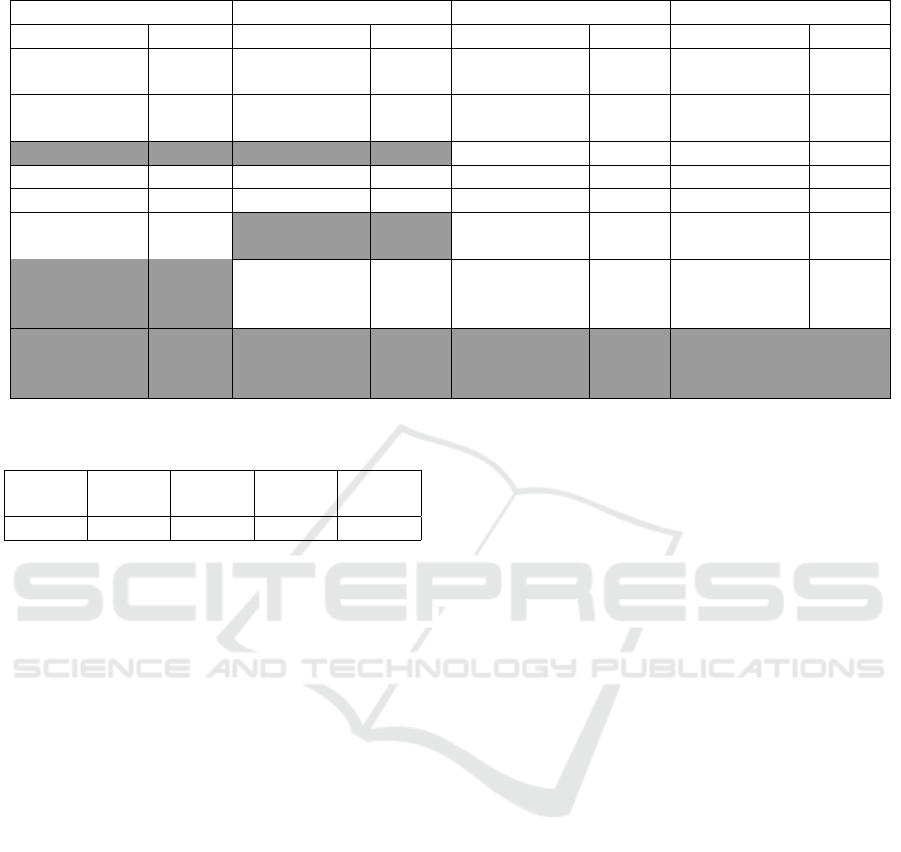
Table 2: Results of stepwise regression in real stock data of Hyundai Motor Company.
Domestic purchase price Domestic selling price Foreign purchase price Foreign selling price
Name Choice Name Choice Name Choice Name Choice
Completion
price
O
Completion
price
O
Completion
price
O
Completion
price
O
Completion
amount
O
Completion
amount
O
Completion
amount
O
Completion
amount
O
Opening price X Opening price X Opening price O Opening price O
High price O High price O High price O High price O
Low price O Low price O Low price O Low price O
Price
just before
O
Price
just before
X
Price
just before
O
Price
just before
O
Accumulated
completion
amount
X
Accumulated
completion
amount
O
Accumulated
completion
amount
O
Accumulated
completion
amount
O
Accumulated
completion
price
X
Accumulated
completion
price
X
Accumulated
completion
price
X
Accumulated
completion
price
X
Table 3: Explanatory powers according to hidden layers.
Hidden
layer 1
Hidden
layer 2
Hidden
layer 3
Hidden
layer 4
Hidden
layer 5
37.6% 95.5% 95.9% 94.2% 95.3%
one or more hidden layers. The learning rate increases
with the number of hidden layers. However, the con-
nection point between input and output could be lost
if there are too many hidden layers, and the learning
could be disturbed (Dominic et al., 1991).
We employed five hidden layers to ensure that the
system can bear the processing load and created the fi-
nal model with a hidden number that shows the high-
est explanatory power (R-squared value) by perform-
ing learning in sequence from hidden layer 1 to hid-
den layer 5 for each stock item. Table 3 summarizes
the explanatory power in each hidden layer, and the
layer with the highest value is layer 3.
5 SYSTEM ARCHITECTURE FOR
STOCK PRICE PREDICTION
This section describes the series of operations that
were implemented when generating the final artificial
neural network model. All the processes were con-
ducted on a cluster consisting of four connected com-
puters (one master and three slaves) with Hadoop and
RHive installed.
5.1 Series of Operations for Generating
Predicted Stock Data
We propose the following steps to generate a predic-
tion model for big data processing and analysis tools,
as shown in Figure 6.
Step 1 (Stock Data Aggregation and Pattern
Generation as Data Preprocessing): We stored the
one-year stock data provided by Koscom in Hadoop
distributed file systems (HDFSs) of the Hadoop-based
cluster. Because we could not manually modify the
source code of MapReduce for extracting the desired
data from each HDFS of the Hadoop cluster, we used
the RHive tool to provide HiveQL, which facilitates
the search for the desired data, e.g., through select
query of RDBMS. After the data was extracted, it was
aggregated at five-minute intervals by using R based
on the tick-by-tick data. Then, patterns were gener-
ated from them because of concatenation of similar
patterns in R of the master computer. The size of a
pattern was one day and the generation unit was five
minutes. The total number of patterns was 17,323.
Step 2 (Pattern Matching with Hierarchical
Clustering): To retrieve similar patterns with the cur-
rent pattern, we used the hclust function in R, which
offers two advantages: it can quickly autodetect sim-
ilar patterns and freely determine the range of similar
patterns simultaneously. Algorithm 1 describes the
procedure for finding similar patterns. After insert-
ing the current pattern into the aggregated patterns as
a historical dataset, clustered patterns were generated
via the hclust function. Then, similar patterns of the
same level as the current pattern could be found.
Step 3 (Feature Selection using Stepwise Re-
Stock Price Prediction based on Stock Big Data and Pattern Graph Analysis
227
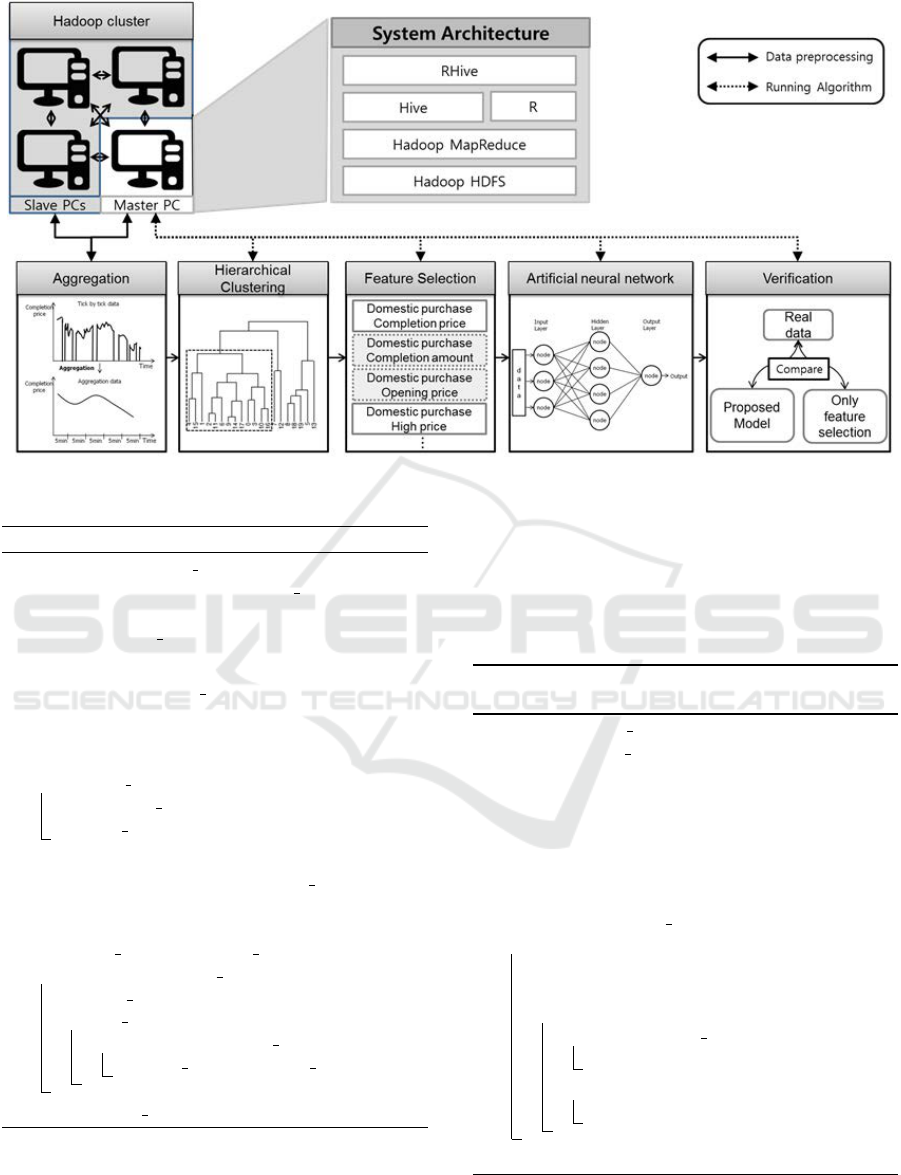
Figure 6: Dependent and independent variables should be defined in stepwise regression analysis.
Algorithm 1: Algorithm for pattern matching.
input : Aggregated patterns is a list of
aggregated data, current pattern
represents the current pattern
output: similar patterns is a list of similar
patterns after clustering
1 int last = Aggregated patterns.length()-1;
2 List<Integer> level = new
ArrayList<Integer>();
3 int level = 0; foreach count in
Aggregated patterns.length() do
4 Aggregated patterns[last][count] =
current pattern[count];
5 run(’sink()’);
6 run(’hc< −hclust(dist(Aggregated patterns),
method=’ave’)’);
7 run(’sink(’out.txt’)’);
8 List result patterns = Read File(’out.txt’);
9 foreach index in result patterns.length() do
10 if result patterns[index] ==
current pattern then
11 foreach level in result patterns do
12 similar patterns = find SP(index);
13 return similar patterns;
gression): Given several similar patterns of stock
price, insignificant variables among all the variables
constituting the price were removed. Algorithm 2 de-
scribes the steps for feature selection using stepwise
regression. Before selecting the variables, the time of
similar patterns was determined, and then, variables
at the time were brought. Variables with p value be-
low a specified threshold were judged as significant
variables.
Algorithm 2: Algorithm for feature selection in step-
wise regression.
input : similar patterns represents a list of
similar patterns, variables represents a
list of all variables constituting the
price
output: remainder is a list of variables
excluding the insignificant variables
1 boolean f lag = false;
2 variables =
getVariables(similar patterns.atTime());
3 while f lag == false do
4 remainder = run(’step(variables,
direction=’both’)’);
5 foreach i in remainder.length() do
6 if remainder[i].p value > 0.05 then
7 break;
8 else
9 f lag = true;
10 return remainder;
Step 4 (Predicted Data Generation on Artificial
Neural Network): To create the predicted data, we
IoTBD 2016 - International Conference on Internet of Things and Big Data
228

used an ANN after feature selection. Algorithm 3
describes the steps for generating the predicted data
using an ANN. Among the input data, we prepared
dependent and independent variables as training data
with another time zone because we would predict the
next day of the current pattern. Specifically, given
historical time of similar pattern ht, the time of the
dependent variable is ht + 1 and the time of the inde-
pendent variable is ht. After the independent and de-
pendent variables were bound, we generated an ANN-
based model using the neuralnet function provided by
R. Then, the independent variables at the current time
t in the model were input and the predicted data were
generated.
Algorithm 3: Algorithm for generation of predicted
data.
input : tr dependent represents the total
completion price at historical time
ht + 1, tr independent represents the
remaining variables excluding the total
completion price at historical time ht,
te dependent represents the remaining
variables excluding the total
completion price at current time t
output: predicted is a dataset generated by
ANN
1 run(’training < −
cbind(tr dependent,tr independent)’);
2 run(’colnames(training) < −
c(’output’,’input’)’);
3 run(’ANN result < − neuralnet(output input,
training, hidden=1∼5,act.fct=’tanh’)’);
4 run(predicted < − ’prediction(ANN result,
te dependent)’);
5 return predicted;
Step 5 (Verification using RMSE): To verify the
validity of the proposed model, we selected RMSE
as a measure of prediction accuracy; the function was
also provided in R. The measure was computed from
comparisons between real and predicted data.
6 EVALUATION
In this section, we describe the one-year test data pro-
vided by Koscom and evaluate the accuracy of each
stock item by computing the RMSE.
6.1 Dataset and Test Scenario
To prove the effectiveness of the proposed model, we
used a real historical stock dataset consisting of var-
ious items for the one-year period from August 2014
to July 2015. To measure the prediction accuracy, we
prepared three items (Hyundai Motor Company, KIA
Motors, and Samsung Electronics) as companies rep-
resenting the Republic of Korea, with their stock data
for August 1, 2014, to July 28, 2015, as the training
data, and their stock data for July 29–31, 2015, as the
test data. As a test scenario, first, two predicted stock
data for one day were generated according to the pro-
posed model and feature selection. Then, we checked
the prediction accuracy by using the RMSE values to
compare the predicted and real stock data.
6.2 Evaluation of Prediction Accuracy
We performed experiments to compute the accuracy
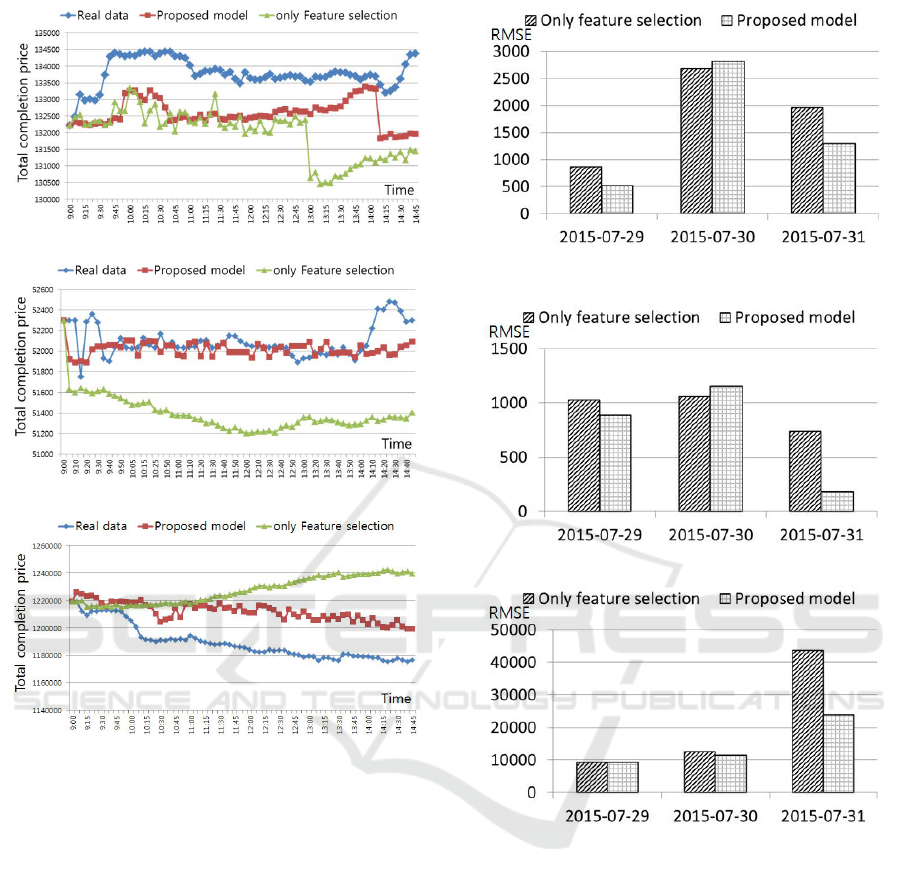
of the proposed method. Figure 7 compares the actual
data and two data values predicted by the proposed
model with only feature selection for July 31, 2015.
The x-axis represents the time at five-minute intervals
and the y-axis represents the total completion price,
i.e., stock price according to the time. First, Figure 7
(a) compares the results of Hyundai Motor Company
stock; we can see that the stock movement change
of the proposed model is closer to the real stock data
than that of only feature selection. In particular, this
can be an especially clear view of the rising curve of
the morning and the declining curve of the afternoon.
Figure 7 (b) shows the stock data derived from the
real and predicted data for KIA Motors. In contrast to
Figure 7 (a), there are slight differences between the
stock movement change of the proposed model and
the real data, whereas there is no clear view of the
rising and declining curve in the graph. Lastly, Fig-
ure 7 (c) depicts the stock data derived from the real
and predicted data for Samsung Electronics. As com-
pared with only the feature selection graph, the stock
movement change of the proposed model is similarly
drawn to the real data despite a slight difference in
price.
In this study, we selected RMSE as a measure of
prediction in order to verify the validity of our model
because this measure is frequently used in the stock
domain. Figure 8 shows the experimental results of
the proposed model and only feature selection us-
ing RMSE. In Figure 8 (a) and (b), we can see that
there are good predictions except on July 30, when
the interesting aspect is the same item. For this rea-
son, we can estimate that there are variables affect-
ing the same theme, not variables that affect individ-
Stock Price Prediction based on Stock Big Data and Pattern Graph Analysis
229
(a) Comparison results for Hyundai Motor Company stock.
(b) Comparison results for KIA Motors stock.
(c) Comparison results for Samsung Electronics stock.
Figure 7: Comparison results according to the proposed
model.
ual stocks; it is necessary to make up for this point.
Unlike Figure 8 (a) and (b), Figure 8 (c) shows good
prediction for all days. In particular, it shows good
predictions on the last day in all the graphs.
7 CONCLUSIONS
In this paper, we determined that stock prices sparsely
show similar patterns and that not all the variables
have a significant impact on the price. For short-
term prediction, we proposed a novel method based
on a combination of hierarchical clustering, stepwise
regression, and ANN model in order to find similar
historical patterns for each stock item and predict the
daily stock price using optimal significant variables
through feature selection. Moreover, we dealt with
the overall process using a big data processing frame-
(a) Comparison results for Hyundai Motor Company
stock.
(b) Comparison results for KIA Motors stock.
(c) Comparison results for Samsung Electronics stock.
Figure 8: RMSE results.
work based on Hadoop and R. Finally, we demon-
strated the prediction accuracy for three stock items
using RMSE.
In the future, we plan to enhance the reliability
of our model by further investigating big and small
pattern matching and analysis. In addition, we will
develop a distributed parallel algorithm and predict all
the stock items instead of only some of them.
ACKNOWLEDGEMENTS
This work was supported by the Research Program
funded by the Korea Centers for Disease Control and
Prevention(fund code#2015-E33016-00).
IoTBD 2016 - International Conference on Internet of Things and Big Data
230

REFERENCES
Bulkowski, T. N. (2011). Encyclopedia of chart patterns,
volume 225. John Wiley & Sons.
Cao, L. and Tay, F. E. (2001). Financial forecasting using
support vector machines. Neural Computing & Appli-
cations, 10(2):184–192.
Cao, Q., Leggio, K. B., and Schniederjans, M. J. (2005).
A comparison between fama and french’s model and
artificial neural networks in predicting the chinese
stock market. Computers & Operations Research,
32(10):2499–2512.
Dominic, S., Das, R., Whitley, D., and Anderson, C. (1991).
Genetic reinforcement learning for neural networks.
In Neural Networks, 1991., IJCNN-91-Seattle Inter-
national Joint Conference on, volume 2, pages 71–76.
IEEE.
Huang, C.-L. and Tsai, C.-Y. (2009). A hybrid sofm-svr
with a filter-based feature selection for stock mar-
ket forecasting. Expert Systems with Applications,
36(2):1529–1539.
Ince, H. and Trafalis, T. B. (2007). Kernel principal com-
ponent analysis and support vector machines for stock
price prediction. IIE Transactions, 39(6):629–637.
Kim, K.-j. and Han, I. (2000). Genetic algorithms approach
to feature discretization in artificial neural networks
for the prediction of stock price index. Expert systems
with Applications, 19(2):125–132.
Kim, Y., Jeong, S. R., and Ghani, I. (2014). Text opinion
mining to analyze news for stock market prediction.
Int. J. Advance. Soft Comput. Appl, 6(1).
Kimoto, T., Asakawa, K., Yoda, M., and Takeoka, M.
(1990). Stock market prediction system with modu-
lar neural networks. In Neural Networks, 1990., 1990
IJCNN International Joint Conference on, pages 1–6.
IEEE.
Kohara, K., Ishikawa, T., Fukuhara, Y., and Nakamura, Y.
(1997). Stock price prediction using prior knowledge
and neural networks. Intelligent systems in account-
ing, finance and management, 6(1):11–22.
Kuo, R. J., Chen, C., and Hwang, Y. (2001). An intelligent
stock trading decision support system through integra-
tion of genetic algorithm based fuzzy neural network
and artificial neural network. Fuzzy sets and systems,
118(1):21–45.
Lee, M.-C. (2009). Using support vector machine with a hy-
brid feature selection method to the stock trend predic-
tion. Expert Systems with Applications, 36(8):10896–
10904.
Lin, X., Yang, Z., and Song, Y. (2009). Short-term stock
price prediction based on echo state networks. Expert
systems with applications, 36(3):7313–7317.
Mittermayer, M.-A. (2004). Forecasting intraday stock
price trends with text mining techniques. In Sys-
tem Sciences, 2004. Proceedings of the 37th Annual
Hawaii International Conference on, pages 10–pp.
IEEE.
Nikfarjam, A., Emadzadeh, E., and Muthaiyah, S. (2010).
Text mining approaches for stock market prediction.
In Computer and Automation Engineering (ICCAE),
2010 The 2nd International Conference on, volume 4,
pages 256–260. IEEE.
Pai, P.-F. and Lin, C.-S. (2005). A hybrid arima and sup-
port vector machines model in stock price forecasting.
Omega, 33(6):497–505.
Wang, J.-H. and Leu, J.-Y. (1996). Stock market trend pre-
diction using arima-based neural networks. In Neural
Networks, 1996., IEEE International Conference on,
volume 4, pages 2160–2165. IEEE.
Stock Price Prediction based on Stock Big Data and Pattern Graph Analysis
231
