
A Big Data based Smart Evaluation System using Public Opinion
Aggregation
Robin G. Qiu
1
, Helio Ha
1
, Ramya Ravi
1
, Lawrence Qiu
2
and Youakim Badr
3
1
Big Data Lab, Penn State University, Engineering Division, Malvern, U.S.A.
2
School of EE & CS, Penn State University, University Park, Pennsylvania, U.S.A.
3
LIRIS-CNRS, Départment Informatique, INSA de Lyon, Lyon, France
Keywords: Big Data, Smart Evaluation System, Higher Education Services, Rankings, Ranking System,
Sentiment Analysis, Public Opinions.
Abstract: Assessing service quality proves very subjective, varying with objectives, methods, tools, and areas of
assessment in the service sector. Customers’ perception of services usually plays an essential role in
assessing the quality of services. Mining customers’ opinions in real time becomes a promising approach to
the process of capturing and deciphering customers’ perception of their service experiences. Using the US
higher education services as an example, this paper discusses a big data-mediated approach and system that
facilitates capturing, understanding, and evaluation of their customers’ perception of provided services in
real time. We review such a big data based framework (Qiu et al., 2015) in support of data retrieving,
aggregations, transformations, and visualizations by focusing on public ratings and comments from different
data sources. An implementation with smart evaluation services is mainly presented.
1 INTRODUCTION
Service quality is well recognized as the overall
perception of the services that results from
comparing the service provider's performance with
the general expectations of customers of how the
service provider in that industry should perform.
Challengingly, assessing service quality proves very
subjective, varying with objectives, methods, tools,
and areas of consideration in the service sector.
Regardless of how service providers think about
their provided services, frequently to a customer, it
is the encounter of a service or ‘moment of truth’
that defines the service. In other words, it is the
experience that customers perceived from their
encountered services subjectively defines service
quality (Qiu, 2014). Therefore, customers’
perceptions of experienced services play an essential
role in assessing the quality of consumed services.
Correspondingly, mining customer or public
opinions in real time becomes a promising approach
to the process of capturing customers’ perceptions of
their service experiences (Meyer and Schwager,
2007; Labrecque et al., 2013).
Education has been one of main services in the
US service sector for many decades. Ensuring that
the US education service performs well is one of top
nation’s priorities. The higher education particularly
draws much attention from a variety of stakeholders,
from students, parents, employers, the government,
to college administrators and boards of directors.
Hence, finding a reliable method of knowing how
the US higher education as a whole or an individual
college is performing is necessary. Over several
decades, there have been a variety of ranking
systems that in different perspectives provide
assessments of education services on higher
education nationally or internationally (Harvey,
2008; Bergseth et al., 2014). A few well known
ranking systems include the US News & World
Report (USNWR), the Times Higher Education
(THE) from the United Kingdom, and the Academic
Ranking of World Universities (ARWU) from
China’s Shanghai Jiao Tong University (SJTU)
(Huang and Qiu, 2016).
Regardless of ranking system or metrics, it is
typical to utilize service quality factors that are
subjectively selected and weighted. As a result, the
provided rankings’ objectivity and impartiality
become worrisome and sometimes confusing and
misleading (MIT, 2011). To some extent, a
quantitative and model-driven method to
520
Qiu, R., Ha, H., Ravi, R., Qiu, L. and Badr, Y.
A Big Data based Smart Evaluation System using Public Opinion Aggregation.
In Proceedings of the 18th International Conference on Enterprise Information Systems (ICEIS 2016) - Volume 1, pages 520-527
ISBN: 978-989-758-187-8
Copyright
c
2016 by SCITEPRESS – Science and Technology Publications, Lda. All rights reserved

computationally generate ranking factors’
weightings in a ranking system can help address the
objectivity and impartiality issues in its enabled
rankings (Huang and Qiu, 2016). The method bears
an acronym of HESSEM, i.e., Higher Education
System oriented Structural Equation Modeling.
Because selecting ranking factors for a ranking
system is also subjective, thus it is desirable for a
ranking system to allow ranking factors to be easily
adjusted, i.e., removed from or added into the
ranking system. Promisingly, HESSEM allows
ranking factors to be easily changed whenever
needed. However, it is never easy to identify new
factors impacting on rankings and then capture
sufficient data for the identified factors (Qiu et al.,
2015).
Gathering customers’ perceptions of their
experienced services is still the most pervasive and
dominative means for service organizations to
decipher the quality of services provided by the
organizations although there have been a lot of
changes in terms of tools and instruments used in
capturing and understanding customers’ perspectives
over the years. Periodically conducting customer
surveys and interviews has been popularly adopted
in the fields of marketing and after-sale services,
aimed at enhancing product designs, prioritizing
engineering and marketing efforts, and improving
after-sale services. Today, with the help of digital
media, mobile and pervasive computing, and
significantly enhanced tools and methods to capture
and understand customer interaction and behavior in
its deepen and refined granularity, traditional
approaches have been evolved and substantially
augmented by incorporating social data along with
traditional data sources to provide a complete picture
of customers (Ahlquist and Saagar, 2013; Labrecque
et al., 2013; Qiu, 2014; Qiu et al., 2014). As a result,
capturing and understanding not only cross-sectional
and longitudinal but also real time and
comprehensive customers’ perceptions of services
become practically implementable.
“People-centric sensing will help drive this trend
by enabling a different way to sense, learn, visualize,
and share information about ourselves, friends,
communities, the way we live, and the world we live
in.” (Campbell et al., 2008) Thus, it is worthy to
explore a way to collect and aggregate public
opinions to enhance assessment of service quality
(Qiu et al., 2015). This paper uses the US higher
education as a service example to show how big
data-mediated public opinion aggregation can be
well applied to augmenting the assessment of service
quality. Please keep in mind, a system of computing
rather than a service quality modeling approach is
presented in the remaining paper.
The remaining paper is organized as follows.
Section 2 briefly reviews a framework for capturing
and visualizing public options that has been used to
develop a ranking module, part of the Leveraging
Innovative Online Networks to Learn Education
Networks and Systems (LIONLENS) research
project by the authors. Section 3 then discusses how
the LIONLENS enables the core and fundamental
computing supports necessary for the realization of
aggregating and visualizing public opinions and
sentiment trends on the US higher education in its
ranking module. Finally, a brief conclusion for this
paper is given in Section 4.
2 A FRAMEWORK FOR
CAPTURING AND
VISUALIZING PUBLIC
OPINIONS
To the service provider of a service system,
capturing, understanding, and controlling the
interaction among all the stakeholders of a service
system plays an essential role in designing,
developing, and managing the service system (Qiu,
2014). A ranking system undoubtedly is a service
system. Thus, real time capturing and understanding
public perceptions or opinions become necessary for
the development of a desirable and reliable ranking
system, which would not only meet the needs of the
public but also be well aligned with the long-term
goals of ranking service providers. Bearing this
understanding in mind, a framework for developing
the LIONLENS including capturing and visualizing
public opinions has been proposed (Qiu et al., 2015),
which is graphically illustrated in Figure 1.
Technically and financially, the proposed framework
allows the LIONLENS to be modularly and then
gradually developed while evolving over time (Qiu,
2014).
As shown in Figure 1, the emerging big data
technologies, widely adopted mobile computing, and
social media can be fully applied and leveraged to
facilitate the process of monitoring and deciphering
the public’s acceptance and colleges’ performance in
real time (Qiu et al., 2015). The highlights of two
different perspectives of the proposed framework in
Figure 1 can be briefed explained as follows:
• From the systems perspective: an education
system consists of people, technologies,
resources, and education service products that
A Big Data based Smart Evaluation System using Public Opinion Aggregation
521
can generate respective values for all
stakeholders through service provision. To
evaluate education service quality, different
aspects of data on the system and the public
perception of its provided education must be
captured and deciphered. Indeed, in addition to
using traditional data source approaches,
distributed and mobile computing systems and
applications have been leveraged so that data
and information on college education services,
students enrollment profiles, faculty
performances, school facilities, campus life,
etc. can be effectively captured, retrieved, and
archived, college by college and/or colleges as
a whole. Technically, the implementations of
existing ranking systems differs significantly
from each other. However, there is no
significant difference in terms of data
collection tools and methods adopted by
existing ranking systems.
• From the analytical perspective: valid and
effective modeling methodologies should be
applied to not only enable ranking services, but
also uncover the insights from the collected
data and information and ultimately provide
prompt guidance for administrators to take
action for positive changes. Ranking systems
vary with adopted modeling methodologies,
computing technologies and implementations,
and operational models. As a result, ranking
and administrative services enabled by the
ranking systems could be descriptive,
predictive, and/or prescriptive.
Figure 1: A framework for developing the LIONLENS.
With the advent of the Internet and mobile
computing, voluminous and various data on higher
education can be retrieved and mined from the
Internet and social media. In other words, as such
data becomes richer and richer, the list of ranking
(or service quality) indicators should become easier
to be adjusted (i.e., added or removed) whenever
necessary. For instance, the inputs from the public
are vital for ranking systems. Therefore, public
ratings and comments must be taken into
consideration so that a ranking system can evolve to
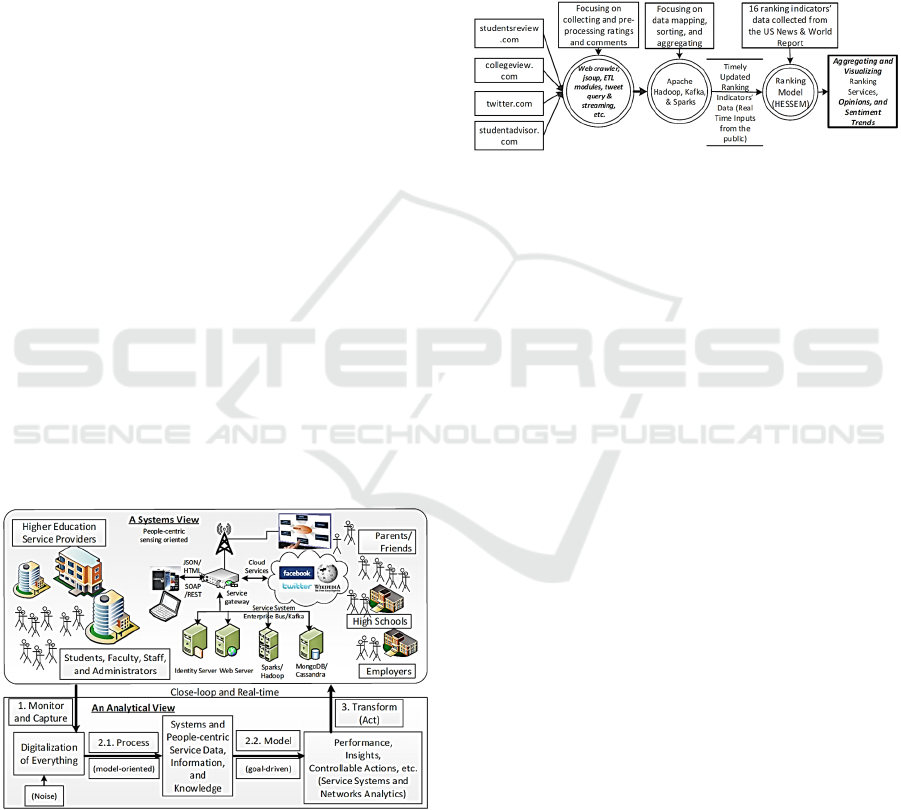
better meet the needs of stakeholders. Figure 2
shows the logic flows of the design and
implementation of the ranking module in the
LIONLENS, which gets enhanced by incorporating
public ratings and comments.
Figure 2: Monitoring, capturing, and visualizing colleges’
performance and public opinions.
As discussed earlier, this paper focuses on the
discussion of a systems and computing approach to
enhancing service quality assessment for the US
higher education. In other words, using the systems
perspective we aim to show how big data-mediated
public opinion aggregation can be practically
applied to addressing service assessment problems.
In particular, we show how big data technologies,
mobile computing, and social media can be fully
leveraged to facilitate the process of monitoring,
capturing, and visualizing colleges’ performance and
public opinions on education service quality in real
time. As shown in Figure 2, the process of adjusting
ranking factors is enhanced by including public
opinions’ sentiment analysis. In practice, public
opinions can be captured, retrieved, and analyzed
from websites and online media including twitters.
We have developed HESSEM - a quantitative
and model-driven ranking model to evaluate higher
education service quality in the US. Using collected
data, we applied structural equation modeling to
systematically determine ranking factor weights for
assessing education service quality and performance
of the US higher education (Huang and Qiu, 2016).
By extending the brief discussion presented in our
previous paper (Qiu et al., 2015), this paper in great
detail discusses how the public textual inputs can be
captured and filtered, and aggregated to enhance
educational service quality assessment. Therefore, in
the next section we explain technically and
functionally the core computing components and
algorithms applied in this study.
ICEIS 2016 - 18th International Conference on Enterprise Information Systems
522
3 BIG DATA-MEDIATED
FUNCTIONAL SUPPORTS
As mentioned earlier, in this paper we focus on
presenting technically and functionally the data
flows and computing components deployed in the
LIONLENS that support the retrieving and
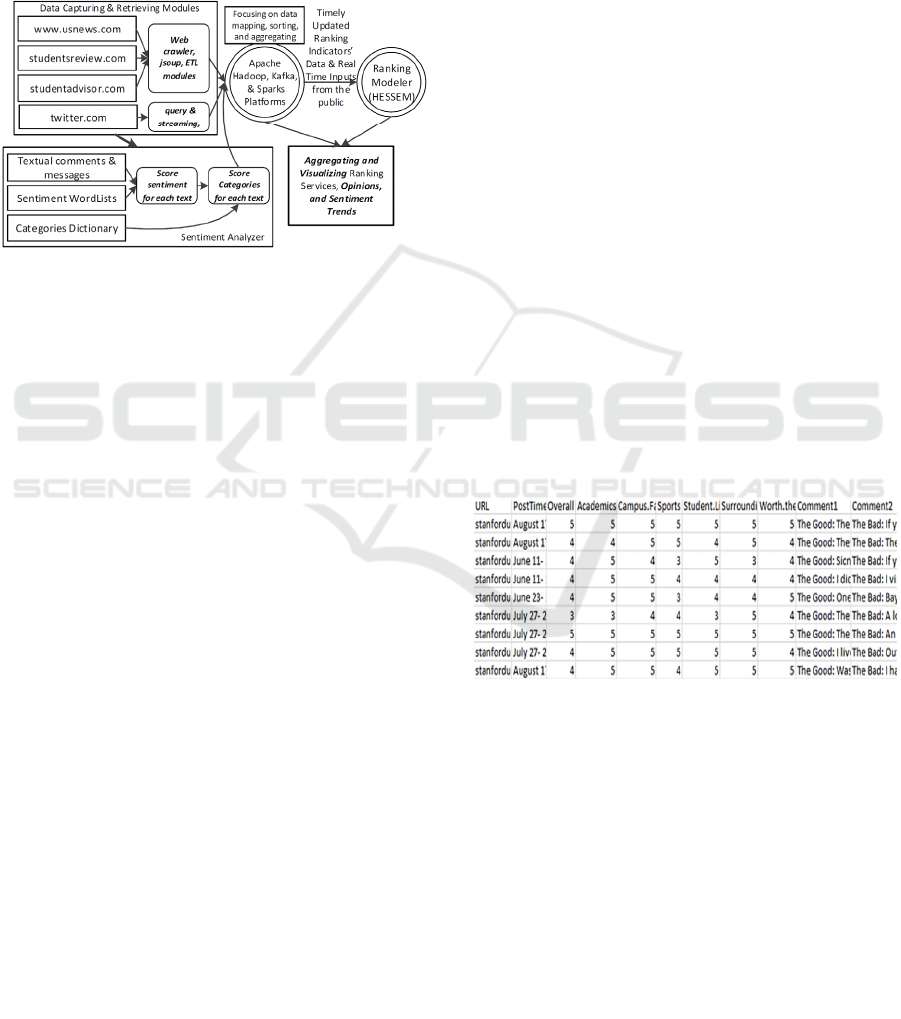
aggregating of the public opinions (Figure 3).
Figure 3: Functional flows and components in support of
retrieving and aggregating the public opinions.
As highlighted in Figure 3, five main computing
components in support of the ranking services
enabled by the LIONLENS, which are briefly
introduced as follows:
• Data capturing & retrieving modules: web
crawler, data extract-transform-load, and
tweets query and streaming modules are
applied and developed for retrieving and pre-
processing data from different data sources
over the Internet.
• Sentiment analyzer: Collected data and
information are saved as files that are
transformed and analyzed to generate
sentiment scores, indicating service
performance trends over time.
• Big data computing clusters or platforms:
Apache Hadoop & Sparks platform
technologies based on Lambda architecture is
used to aggregate, consolidate, and archive the
captured and pre-processed data.
• Ranking modeler: HESSEM is adopted for
generating rankings on a daily basis based on
archived and on-going, newly collected and
updated data.
• Visualization modules: interactive web
interfaces are developed and deployed to allow
end users to visualize aggregated public
opinions and sentiment trends on the higher
education in the US.
3.1 Data Capturing & Retrieving
Modules
To demonstrate how data and information on
education services can be used to enhance service
quality modeling, we developed web crawler, data
extract-transform-load, and tweets query and
streaming modules to crawl across a list of selected
websites and retrieve public comments and tweets.
As numerous information retrieval tools and
libraries are available over the Internet, these data
retrieving modules can be easily customized for
other websites. We use the studentadvisor.com as an
example to show how public ratings and comments
are captured, pre-processed, and utilized in this
project.
The studentadvisor.com website allows the
public to post their comments and ratings on any
colleges in the US. Ratings spanning over 6
categories from overall, academics, campus facility,
sports, student life, surrounding area, to worth the
money are Likert-scale based, from 1 to 5. Public
comments namely ‘The Good’, ‘The Bad’, and
‘WouldIdoItAgain’ are then text based. As soon as
web pages are downloaded, the targeted data
including ratings and comments are extracted and
transformed. To ensure that retrieved data will be
readily accepted by the big data platforms, the
transformed data for each college is loaded into a
corresponding CSV file as illustrated in Figure 4.
Figure 4: Data sample from studentAdvisor.com.
3.2 Data Capturing & Retrieving
Modules
Recently online social media has undoubtedly
become the most popular and convenient means for
the public to communicate, exchange opinions, and
stay connected. Hence, studying online messages
and formed online social networks has received a lot
of attention from scholars and professionals
worldwide. Sobkowicz et al. (2012) develop a
framework using content analysis and sociophysical
system modeling techniques, focusing on
understanding and visualizing the formation of
A Big Data based Smart Evaluation System using Public Opinion Aggregation
523
political opinions and online networks over social
media. Farina et al. (2014) present generally a
practical, technical solution to extract and visualize
massive public messages from different data
sources.
To get the general understanding of public
comments, we develop a sentiment analyzer to
process public comments. The sentiment analyzer
tries to answer two questions. First, it would like to
determine the sentiment strength of a comment, i.e.
quantifying how positive or negative a comment is.
Secondly, it would like to understand in which
perception areas a user tried to provide his/her
comment, i.e. classifying comments.
To quantify how positive or negative a comment
is, we extract relevant words based on a well-defined
sentiment dictionary. The AFINN is a list of English
words that is divided into positive and negative
sentiments. Positive words ranges with the strength
of from 1 to 5 and negative words ranges with the
strength of from -1 to -5. The current version of
AFFIN dictionary contains about 2500 words and
phrases (Nielsen, 2011). Instead of using 10 levels
of sentiment strength, we redefine the dictionary
using 4 levels, defined as very positive (5 and 4),
positive (3, 2, and 1), negative (-1, -2, and -3), and
very negative (-4 and -5), focusing on finding the
polarity of words in the text comments.
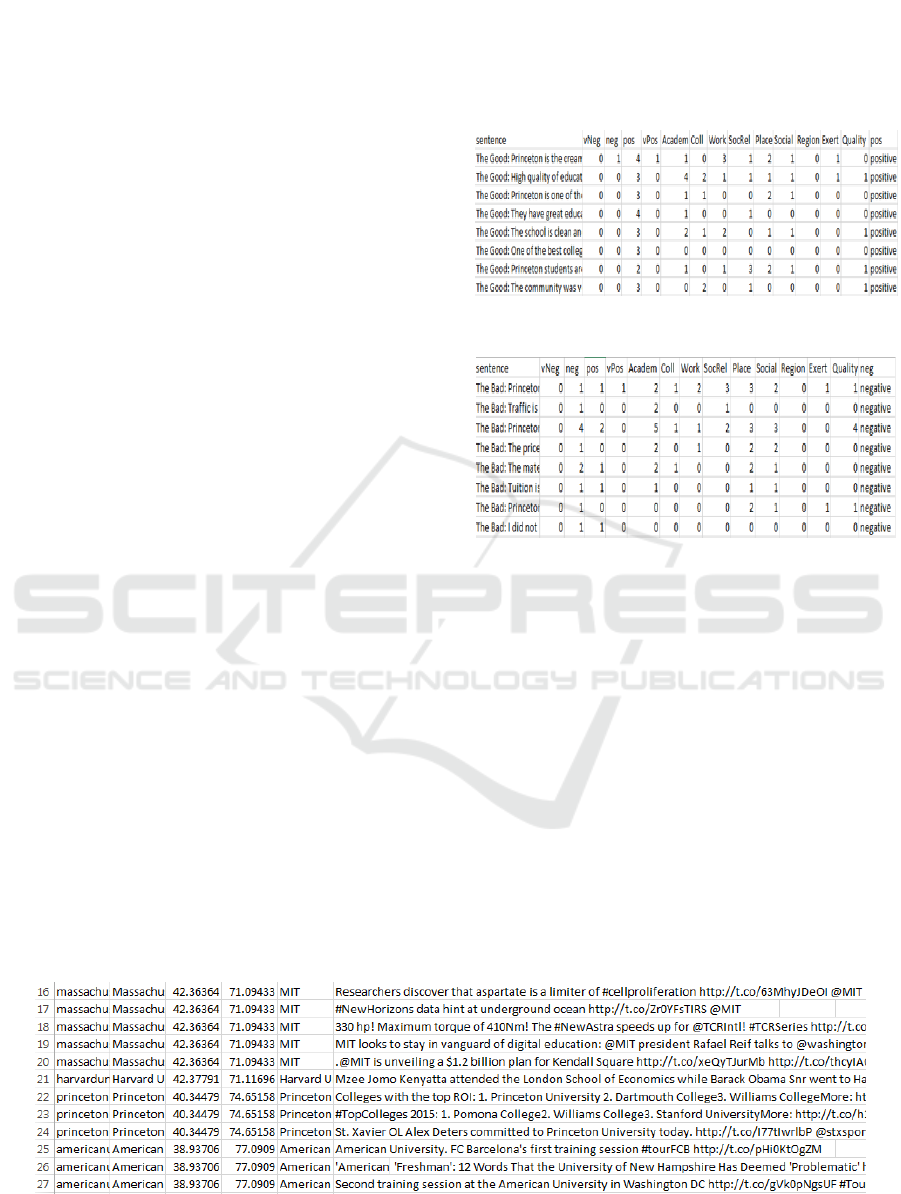
To support the categorization of words extracted
from comments, the General Inquirer Dictionary
(Stone, 1997) is then applied. The list of categories
includes Academ (academic and intellectual fields),
Coll (all human collectivities), Work (ways for
doing work), SocRel (interpersonal processes), Place
(place related words), Social (social interaction),
Region (region related words), Exert (movement
categories), and Quality (qualities or degrees of
qualities). The occurrences of words labeled in the
dictionary in a comment can be simply used as a
sentiment indicator of the comment. Thus, the
sentiment analyzer computes how many relevant
words that appear in a comment. Using “The Good”
and “The Bad” comments for Princeton University
respectively, Figure 5 and 6 show sample results of
sentiment analysis in this study. The method of
validating dictionaries and relabeling words and
detailed analysis in support of comments’
categorization and classification are well presented
in Ravi’s thesis (2015).
Figure 5: An example of “The Good” comments.
Figure 6: An example of “The Bad” comments.
Twitter.com is a very popular online social
networking service, which essentially leverages real
time push technologies and allows the public to post
and read up to 140-characters microblogs called
tweets. With the advent of smartphone technologies
and services, mobile devices have made
microblogging extremely handy and dynamic.
Because of the vivid and pervasive, and short, easily
understandable nature of microblogs, microblogging
has substantially increased its popularity in the
public (Yu and Qiu, 2014). Researchers start to pay
much attention to understandings of tweets, aimed at
getting better and real time understandings of
various social behavior and market trends (Wu et al.,
2010; Alper et al., 2011; Marcus et al., 2012).
Figure 7: An example of tweets retrieved from Twitter.com.
ICEIS 2016 - 18th International Conference on Enterprise Information Systems
524
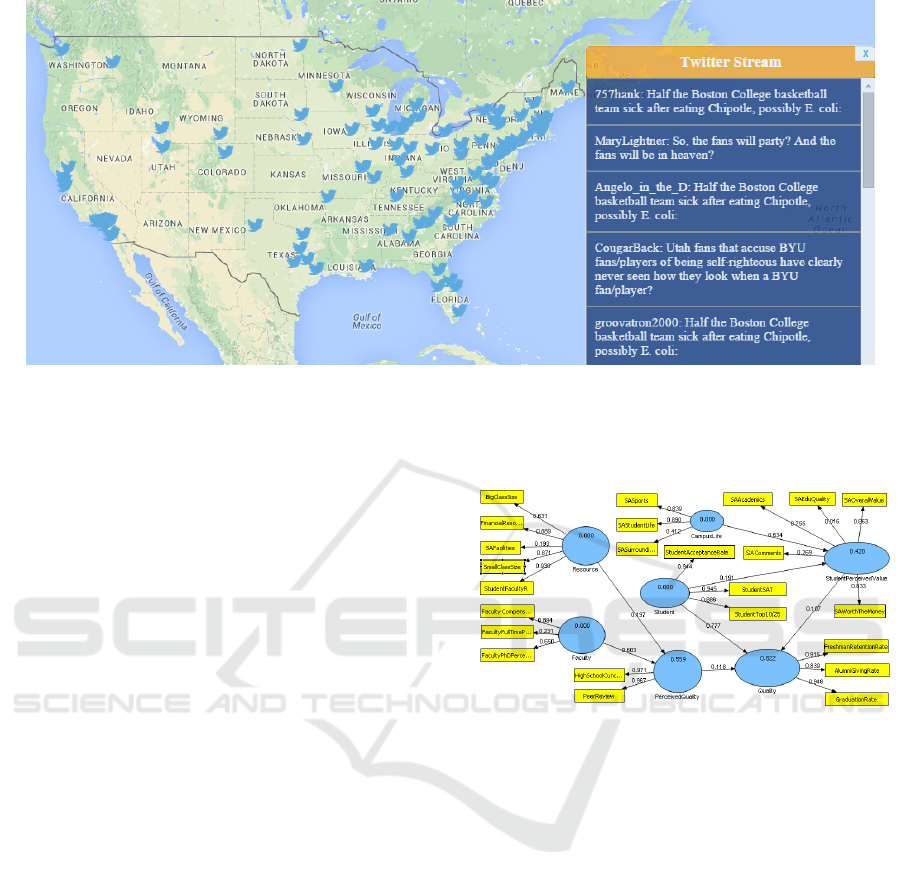
Figure 8: An interactive map view of sentiment trends of public opinions using streaming tweets.
To test out the concept of retrieving public
opinions from a variety of data sources, tweets thus
are used in this study. In this study, we focus on a
list of targeted colleges in the US. Tweets from
Twitter.com are retrieved using predefined queries
(Figure 7) or streamed using a list of keywords in
real time (Figure 8). Clean texts are extracted from
received raw tweets and then further analyzed using
our developed sentiment analyzer.
3.3 Big Data Computing Platforms
Data and information from the Internet are generally
unstructured and mostly stored as images and texts.
Our endeavor in enhancing service quality in this
study substantially relies on the successful design,
development, and deployment of big data computing
platforms. Our deployed platforms use a scalable
Lambda architecture to deal with big data volume
and velocity simultaneously, supporting a hybrid
computation model as both batch and real-time data
processing can be combined transparently. The
distribution layer consists of an Apache Kafka
messaging broker. The batch layer includes HDFS,
MapReduce, Hive, Pig, and Spark batch. The
Apache Spark streaming layer includes Spark core
and resilient distributed datasets, HBase, Cassandra,
and MongoDB to perform lightning-fast cluster
computing transformations and actions.
As shown in Figure 3, ratings, comments, and
sentiment scores are processed in either batches or
streaming, depending on how public opinions are
retrieved from their data sources. Ratings,
comments, and sentiment scores are aggregated,
consolidated, and archived; they become readily
available for use, i.e., visualizations or further
aggregations and computations.
Figure 9: Enhancing the HESSEM by including sentiment
scores of public opinions.
3.4 Ranking Modeler
Although demonstrating how educational service
quality on the US higher education gets modeled in a
quantitative and real-time manner is not the purpose
of this paper, briefly showing how the assessment of
service quality or performance gets enhanced by
incorporating public opinions should be worthwhile.
Figure 9 provides an overview of enhanced
HESSEM models for top 100 colleges in the US,
which has taken into consideration the above-
mentioned sentiment scores computed from public
opinions (Ravi, 2015; Huang & Qiu, 2015). A full
list of new rankings can be found in Ravi (2015).
3.5 Visualizations of Aggregated Public
Opinions and Sentiment Trends
As discussed in last section, the performance of
educational services of a given college perceived by
A Big Data based Smart Evaluation System using Public Opinion Aggregation
525
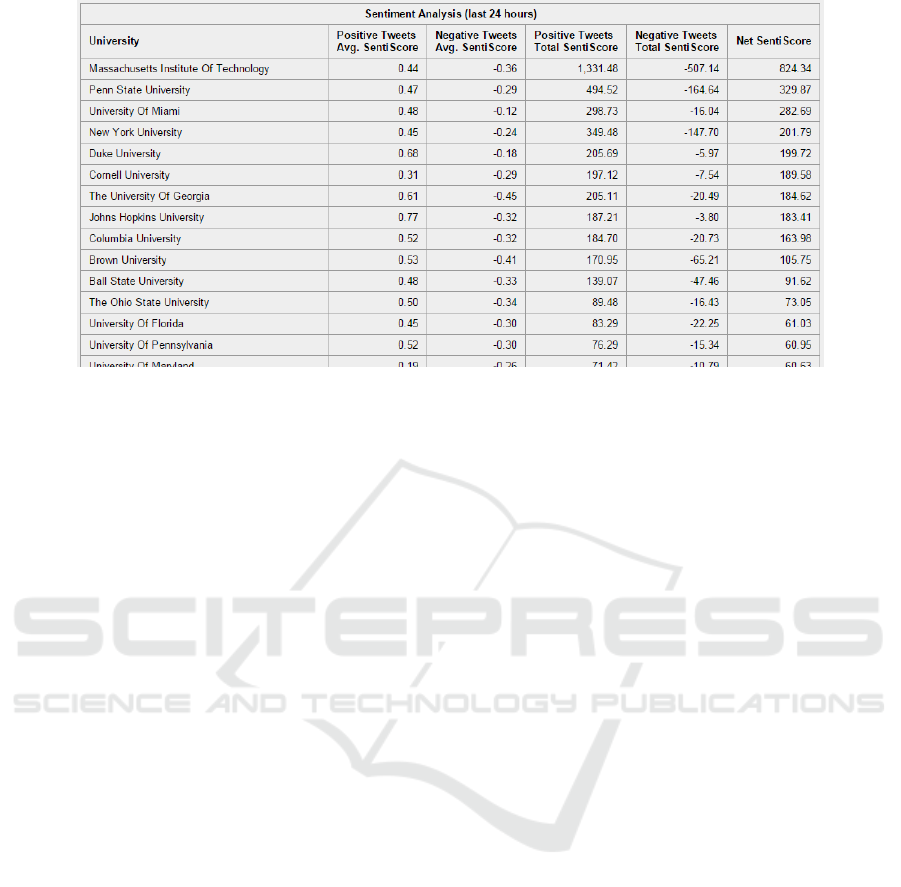
Figure 10: A statistic report of sentiment trends of public opinions based on tweets.
the public changes with public opinions. If the
proposed approach and system gets fully deployed
with the ability of assessing the quality of college’s
services on a daily basis, aggregating and visualizing
public opinions can then play an important role in
helping stakeholders promptly understand what the
public values the performance and quality of their
provided education services. Sentiment trends can be
one of effective indicators.
Sentiment trends could timely help
administrators understand what the public is
thinking about the moving direction of their
provided services. A sudden jump of the number of
tweets on a college might serve an alert, indicating
that an event is currently drawing much public
attention. Figure 8 shows an interactive map view of
sentiment trends of public opinions using streaming
tweets. By clicking a college tweet icon on the map,
one can clearly see its sentiment trend for last 15
days or a customized interval. Figure 10 presents a
statistic report of sentiment trends of public opinions
based on tweets.
4 CONCLUSIONS
As discussed earlier, HESSEM allows ranking
factors to be easily changed over time. But it is
challenging to identify meaningful factors and then
collect sufficient data for the identified factors. As
public opinions play a key role in assessing
customers’ perception of their consumed services,
this paper focused on introducing a systems
approach to aggregating and visualizing public
opinions. We demonstrated that capturing and
understanding public ratings and comments on
higher education helped enhance service quality
assessment in general and develop a better and more
effective rating system for education in the future.
By capturing and deciphering market trends in
real time, the presented systems approach truly
possesses promising potential of facilitating
decision-making of addressing the needs of
customers in the service industry. Although there
will be a variety of research areas we could further
our studies, collecting more data and information
from other popular websites including facebook and
Google trends and improving sentiment analysis
accuracy in the education service domain are surely
what we will work on in the near future. Through
educational data mining and learning analytics, we
could promptly uncover more insights to assist
stakeholders in administrating and transforming their
higher education practices in an effective and
satisfactory manner. From a systems perspective, the
proposed big data based evaluation system could
become smarter and smarter as both the assessing
model and the used service quality factors can be
evolved over time.
ACKNOWLEDGEMENTS
This work was done with great support and help
from the Big Data Lab at Penn State. Dr. Adrian
Barb from Penn State significantly contributed to the
deployment of big data platforms. The project
entitled “Big Data Platform (Massive Data) for
Proactive Analyses of Behaviors of Users in Urban
Worlds” is financially supported by the Rhône-
ICEIS 2016 - 18th International Conference on Enterprise Information Systems
526

Alpes Region, France. This project was also partially
supported by IBM Grants (JLP201111006-1, 2011-
12; IBM-NUAA-SUR, 2012-13: Customer
Behaviour Analytics in Multi-channel Scenario) and
the Penn State Faculty Development Research Fund
(Exploring Mechanisms for Enriching Mobile User
Browsing Experience – 2014-15; Building a
Foundation to Showcase Potential of an IoT Based
“Sense and Respond” Framework – 2015-16).
REFERENCES
Ahlquist, J., & Saagar, K. 2013. Comprehending the
complete customer: leveraging behavioral and
attitudinal data for actionable analytics. Analytics,
May/June, 36-50.
Alper, B., Yang, H., Haber, E., & Kandogan, E. 2011.
Opinionblocks: Visualizing consumer reviews. IEEE
VisWeek 2011 Workshop on Interactive Visual Text
Analytics for Decision Making.
Bergseth, B., Petocz, P., and Abrandt Dahlgren, M. 2014.
Ranking quality in higher education: guiding or
misleading? Quality in Higher Education, 20(3), 330-
347.
Campbell, A.T., Eisenman, S.B., Lane, N.D., Miluzzo, E.,
Peterson, R.A., Lu, H., Zheng, X., Musolesi, M.,
Fodor, K. and Ahn, G.S., 2008. The rise of people-
centric sensing. IEEE Internet Computing, 12(4), 12-
21.
Farina, J., Mazuran, M., and Quintarelli, E. 2014.
Extraction, Sentiment Analysis and Visualization of
Massive Public Messages. New Trends in Databases
and Information Systems, 159-168. Springer
International Publishing.
Harvey, L. 2008. Rankings of higher education
institutions: A critical review. Quality in Higher
Education, 14(3), 187-207.
Huang, Z. and Qiu, R. G. 2016. A quantitative and mode-
driven approach to assessing the US higher education.
Accepted by Quality in Higher Education.
Labrecque, L. I., vor dem Esche, J., Mathwick, C., Novak,
T. P., & Hofacker, C. F. 2013. Consumer power:
Evolution in the digital age. Journal of Interactive
Marketing, 27(4), 257-269.
Marcus, A., Bernstein, M. S., Badar, O., Karger, D. R.,
Madden, S., and Miller, R. C. 2012. Processing and
visualizing the data in tweets. ACM SIGMOD
Record, 40(4), 21-27.
Meyer, C., & Schwager, A. 2007. Understanding customer
experience. Harvard Business Review, 85(2), 116.
MIT., 2011. MIT Ranked 3rd in the World, 5th in the
U.S.?. MITFaculty Letter, Retrieved Aug. 18, 2015
from http://web.mit.edu/fnl/volume/241/usnews.html.
Nielsen, F. Å. 2011. A new ANEW: Evaluation of a word
list for sentiment analysis in microblogs. arXiv
preprint arXiv:1103.2903.
Qiu, R. G. 2009. Computational thinking of service
systems: dynamics and adaptiveness modeling.
Service Science, 1(1), 42-55.
Qiu, R. G. 2014. Service Science: the Foundations of
Service Engineering and Management, John Wiley &
Sons: Hoboken, New Jersey, USA.
Qiu, R. G., Wang, K., Li, S., Dong, J. and Xie, M., 2014,
June. Big data technologies in support of real time
capturing and understanding of electric vehicle
customers dynamics. The 5th IEEE International
Conf. on Software Eng. and Service Science, 263-267.
Qiu, R. G., Ravi, R., and Qiu, L. 2015. Aggregating and
visualizing publicati opinions and sentiment trends on
the US higher education. The 17th International
Conference on Information Integration and Web-
based Applications & Services, 262-266.
Ravi, R. 2015. A Quantitative and Big Data Driven
Approach to Assessing the US Higher Education. MS
Thesis Paper, The Pennsylvania State University.
Sobkowicz, P., Kaschesky, M., and Bouchard, G. 2012.
Opinion mining in social media: Modeling,
simulating, and forecasting political opinions in the
web. Government Information Quarterly, 29(4), 470-
479.
Stone, P. J. 1997. Thematic text analysis: New agendas for
analyzing text content. Text Analysis for the Social
Sciences. Mahwah, NJ: Lawrence Erlbaum, 33-54.
Wu, Y., Wei, F., Liu, S., Au, N., Cui, W., Zhou, H., & Qu,
H. 2010. OpinionSeer: interactive visualization of
hotel customer feedback. IEEE Transactions on
Visualization and Computer Graphics, 16(6), 1109-
1118.
Yu, Y., and Qiu, R. G. 2014. Followee recommendation in
microblog using matrix factorization model with
structural regularization. The Scientific World
Journal, 1-10.
A Big Data based Smart Evaluation System using Public Opinion Aggregation
527
